


Trend Following - Week in Review - August 8, 2025

"Resilience in Pockets, Retreat Elsewhere"
This Week in Trend – 8 August 2025
Welcome back to This Week in Trend, your weekly pulse check on global futures and the state of systematic trend following.
This week highlighted a market split between strength in select assets and weakness elsewhere. Trend followers had opportunities in coffee, silver, and certain equity markets, while energy, palladium, and grains struggled. With the TTU Trend Barometer at 34 percent, the environment remains challenging, but not devoid of tradable structure.
The message is clear, focus on the surviving pools of persistence and avoid forcing trades where the tide has gone out.
SG Trend Index Performance
- Month-to-date (as of Aug 8): +1.05%
- Year-to-date: -9.08%
(Previous week MTD: +0.45% | YTD: -9.58%)
The SG Trend Index improved slightly, though gains remain modest. Year-to-date performance is still deep in negative territory, underscoring the challenging environment for systematic trend followers.
TTU Trend Barometer: 34 Percent – Moderately Weak
- Previous reading: 36 Percent
- 10-day rate of change: Falling Rapidly
At 34 percent, fewer than 35 percent of markets are showing medium to strong trend conditions. This further deterioration points to shrinking price persistence, with fewer clear opportunities for systems to latch onto.
"At thirty-four, the tide is low — only a few rock pools remain."
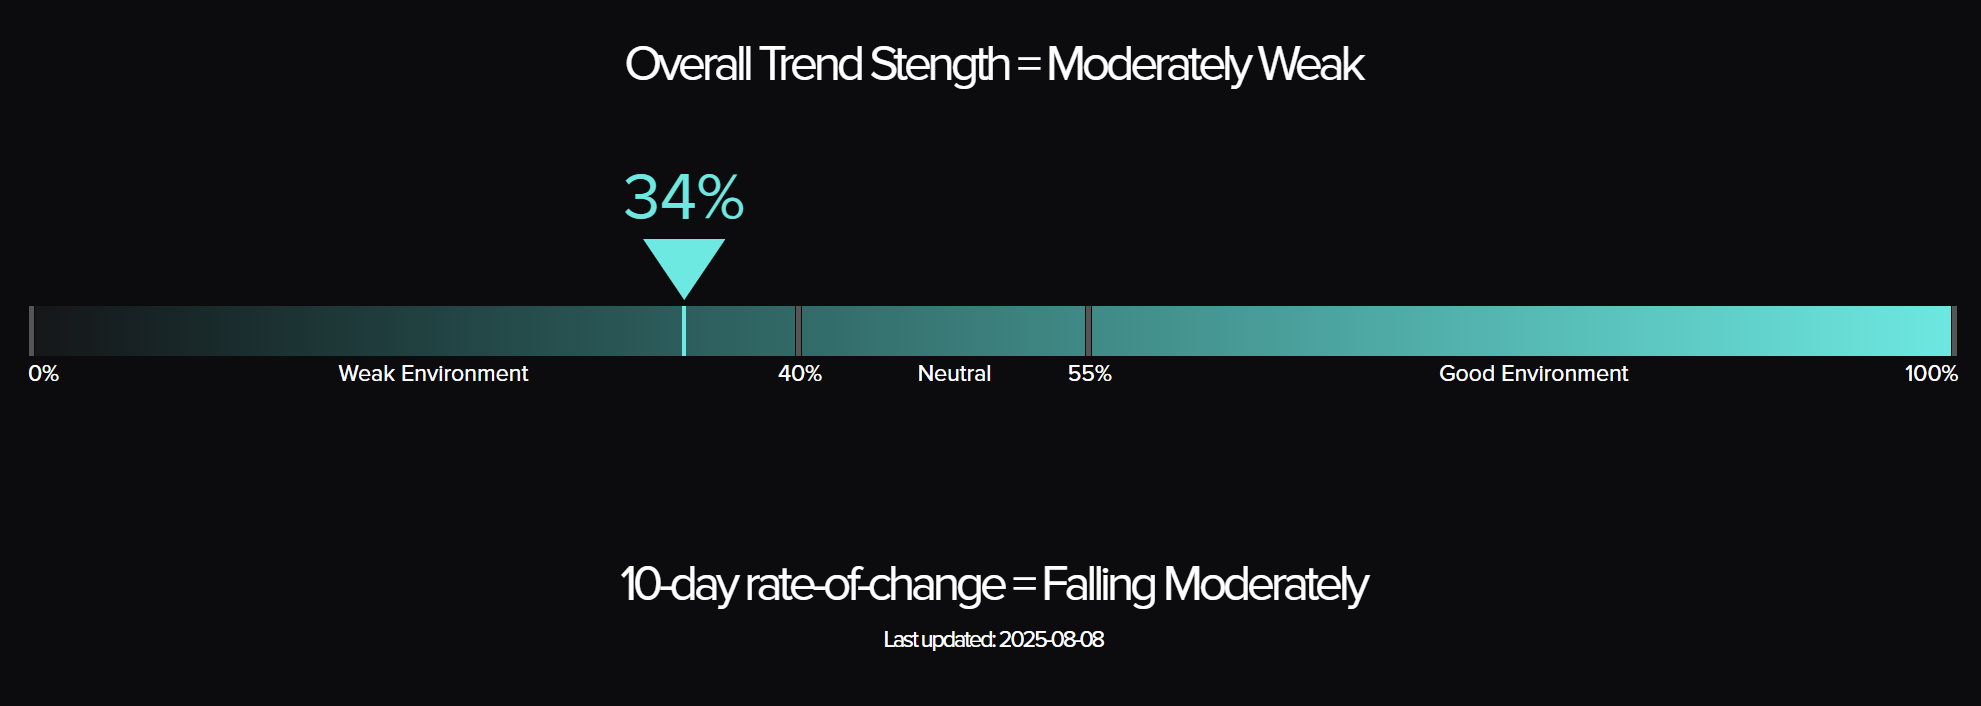
The Top Traders Unplugged (TTU) Trend Barometer is a proprietary tool that measures the percentage of markets with medium to strong trends. Similar to a thermometer, where 0 degrees Celsius equates to freezing, a TTU Trend Barometer reading below 40% indicates a “cold” environment for trend-following, while readings above 55% signal a “hotter,” more favourable trend environment.
Weekly Asset Class Snapshot
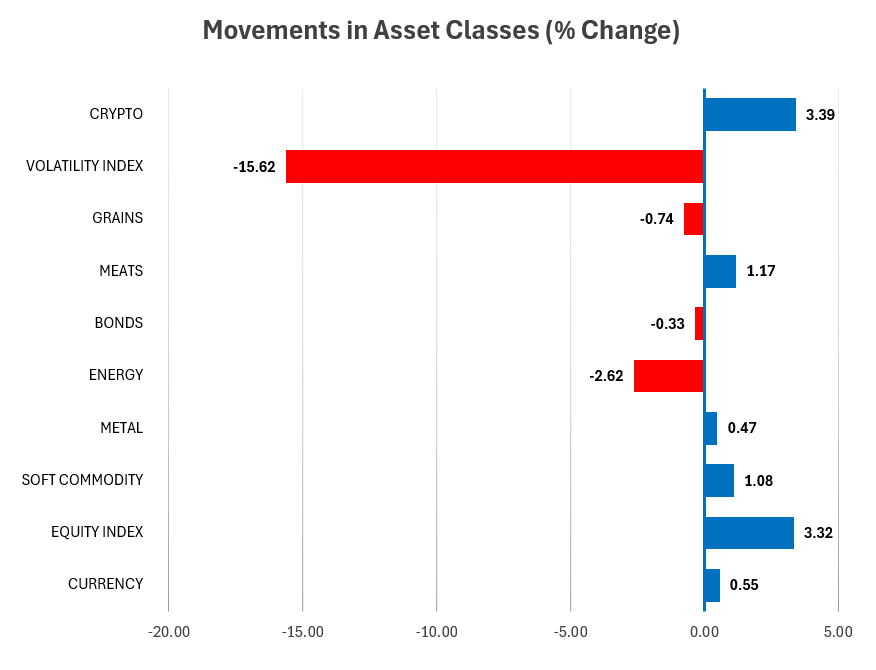
Source: Finwiz.com
Crypto, equities, and select soft commodities outperformed. Energy fell further, bonds slipped, and volatility collapsed sharply.
Asset Class Breakdown – Reversals and Continuations
- Energy: -2.62% (Previous: +0.30%)
Crude oil (WTI and Brent) fell again, with natural gas extending its slide. The sector is in retreat, with many systems likely reducing or exiting long exposure. - Metals: +0.47% (Previous: -6.89%)
A mixed week — silver and copper gained while palladium fell sharply and platinum eased. Gold held near highs. - Equities: +3.32% (Previous: -3.19%)
Strong gains across major indexes, led by the Nikkei 225 and Nasdaq 100. The rebound restored some equity trend signals. - Soft Commodities: +1.08% (Previous: -5.32%)
Coffee and cocoa surged, orange juice recovered but lumber softened. The sector regained some structure. - Grains: -0.74% (Previous: -2.75%)
Losses slowed, but wheat, soybeans, and corn remain under pressure. Trend signals are still weak. - Meats: +1.17% (Previous: +0.03%)
Lean hogs and live cattle saw mixed action, but the sector held steady overall. - Bonds: -0.33% (Previous: +1.01%)
Modest pullback across the curve, with structure holding but momentum stalling. - Currencies: +0.55% (Previous: -0.80%)
Slight gains for majors against the USD, but no strong directional alignment across FX pairs. - Crypto: +3.39% (Previous: -3.05%)
Bitcoin rebounded, preserving its uptrend, though volatility in the space remains elevated. - Volatility Index: -15.62% (Previous: +11.27%)
A sharp drop in the VIX signalled easing market stress, potentially re-risking conditions for trend systems.
Performance Highlights – This Week’s Market Leaders & Laggards
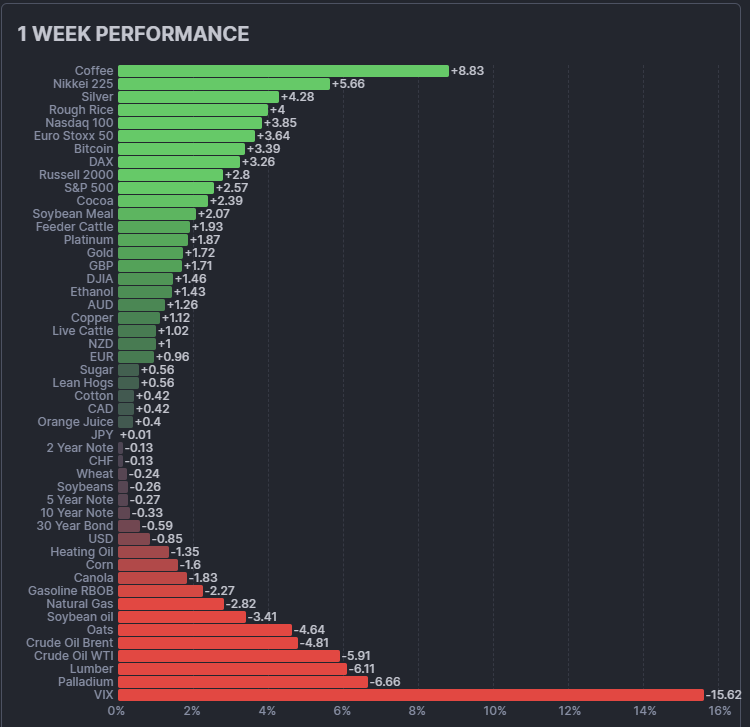
Top Market Movers
Top Gainers
- Coffee: +8.83% – Breakout strength, leading softs
- Nikkei 225: +5.66% – Fresh highs
- Silver: +4.28% – Precious metals support
- Rough Rice: +4.00% – Agricultural surprise
- Nasdaq 100: +3.85% – Tech-led equity rally
Top Losers
- VIX: -15.62% – Sharp volatility collapse
- Palladium: -6.66% – Precious metals divergence
- Lumber: -6.11% – Softs pullback
- Crude Oil WTI: -5.91% – Energy under pressure
- Crude Oil Brent: -4.81% – Follow-through selling in oil
Portfolio View - Positioning and Impact
- Energy
Oil weakness likely pushed systems into deeper short territory. Natural gas trends remain down, with shorts holding dominance. - Metals
Silver and copper provided long-side opportunities, but palladium and platinum weakened, creating internal dispersion in the metals complex. - Grains
Selling pressure slowed but momentum remains negative. Systems are likely underweight or out of key contracts. - Softs
Coffee and cocoa strength could re-engage long exposure. Orange juice recovery may tempt systems back in, though volatility is high. - Equities
Broad equity gains, particularly in Asia and tech-heavy indexes, restored bullish setups. - Bonds
Mild pullback but the long bias remains intact. Systems are likely holding reduced positions. - Currencies
Mixed week without strong coordinated trends. USD weakness provided some relief for risk currencies. - Crypto
Bitcoin recovery may support long exposure, though drawdown risk persists. - Volatility
Collapse in the VIX eases pressure on risk assets, but may also reduce breakout opportunities for volatility strategies.
Final Reflections – Resilience in Pockets, Retreat Elsewhere
This week highlighted a market split between strength in select assets and weakness elsewhere. Trend followers had opportunities in coffee, silver, and certain equity markets, while energy, palladium, and grains struggled. With the TTU Trend Barometer at 34 percent, the environment remains challenging, but not devoid of tradable structure.
The message is clear: focus on the surviving pools of persistence and avoid forcing trades where the tide has gone out.

List of Resources used in the Week in Review
Important Disclaimers
This document is directly solely to Accredited Investors, Qualified Eligible Participants, Qualified Clients and Qualified Purchasers. No investment decision should be made until prospective investors have read the detailed information in the fund offering documents of any manager mentioned in this document. This document is furnished on a confidential basis only for the use of the recipient and only for discussion purposes and is subject to amendment This document is neither advice nor a recommendation to enter into any transaction. This document is not an offer to buy or sell, nor a solicitation of an offer to buy or sell, any security or other financial instrument. This presentation is based on information obtained from sources that TopTradersUnplugged (“TTU”) (“considers to be reliable however, TTU makes no representation as to, and accepts no responsibility or liability for, the accuracy or completeness of the information. TTU has not independently verified third party manager or benchmark information, does not represent it as accurate, true or complete, makes no warranty, express or implied regarding it and shall not be liable for any losses, damages, costs or expenses relating to its adequacy, accuracy, truth, completeness or use.
All projections, valuations, and statistical analyses are provided to assist the recipient in the evaluation of the matters described herein. Such projections, valuations and analyses may be based on subjective assessments and assumptions and may use one among many alternative methodologies that produce different results accordingly, such projections, valuations and statistical analyses should not be viewed as facts and should not be relied upon as an accurate prediction of future events. There is no guarantee that any targeted performance will be achieved Commodity trading involves substantial risk of loss and may not be suitable for everyone
TTU is not and does not purport to be an advisor as to legal, taxation, accounting, financial or regulatory matters in any jurisdiction. The recipient should independently evaluate and judge the matters referred to herein. TTU does not provide advice or recommendations regarding an investor’s decision to allocate to funds or accounts managed by any manager (“or to maintain or sell investments in funds or accounts managed by any manager, and no fiduciary relationship under ERISA is created by the investor investing in funds or accounts managed by any manager, or through any communication between TTU and the investor
In reviewing this document, it should be understood that the past performance results of any asset class, or any investment or trading program set forth herein, are not necessarily indicative of any future results that may be achieved in connection with any transaction. Any persons subscribing for an investment must be able to bear the risks involved and must meet the suitability requirements relating to such investment. Some or all alternative investment programs discussed herein may not be suitable for certain investors This document is directed only to persons having professional experience in matters relating to investments. Any investment or investment activity to which this document relates is available only to such investment professionals. Persons who do not have professional experience in matters relating to investments should not rely upon this document.
This document and its contents are proprietary information of TTU and may not be reproduced or otherwise disseminated in whole or in part without TTU’s prior written consent.
This document contains simulated or hypothetical performance results that have certain inherent limitations AND SHOULD BE VIEWED FOR ILLUSTRATIVE PURPOSES. Unlike the results shown in an actual performance record, these results do not represent actual trading. HYPOTHETICAL PERFORMANCE RESULTS HAVE MANY INHERENT LIMITATIONS, SOME OF WHICH ARE DESCRIBED BELOW. NO REPRESENTATION IS BEING MADE THAT ANY ACCOUNT WILL OR IS LIKELY TO ACHIEVE PROFITS OR LOSSES SIMILAR TO THOSE SHOWN IN FACT, THERE ARE FREQUENTLY SHARP DIFFERENCES BETWEEN HYPOTHETICAL PERFORMANCE RESULTS AND THE ACTUAL RESULTS SUBSEQUENTLY ACHIEVED BY ANY PARTICULAR INVESTMENT ACCOUNT.
ONE OF THE LIMITATIONS OF HYPOTHETICAL PERFORMANCE RESULTS IS THAT THEY ARE GENERALLY PREPARED WITH THE BENEFIT OF HINDSIGHT IN ADDITION, HYPOTHETICAL TRADING DOES NOT INVOLVE FINANCIAL RISK, AND NO HYPOTHETICAL TRADING RECORD CAN COMPLETELY ACCOUNT FOR THE IMPACT OF FINANCIAL RISK IN ACTUAL TRADING FOR EXAMPLE, THE ABILITY TO WITHSTAND LOSSES OR TO ADHERE TO A PARTICULAR TRADING PROGRAM OR OTHER ASSET.
There are numerous other factors related to the markets in general or to the implementation of any specific trading program which cannot be fully accounted for in the preparation of hypothetical performance results and all of which can adversely affect actual trading results. No representation is being made that any investment will or is likely to achieve profits or losses similar to those being shown.
Most Comprehensive Guide to the Best Investment Books of All Time

Most Comprehensive Guide to the Best Investment Books of All Time
Get the most comprehensive guide to over 600 of the BEST investment books, with insights, and learn from some of the wisest and most accomplished investors in the world. A collection of MUST READ books carefully selected for you. Get it now absolutely FREE!
Get Your FREE Guide HERE!