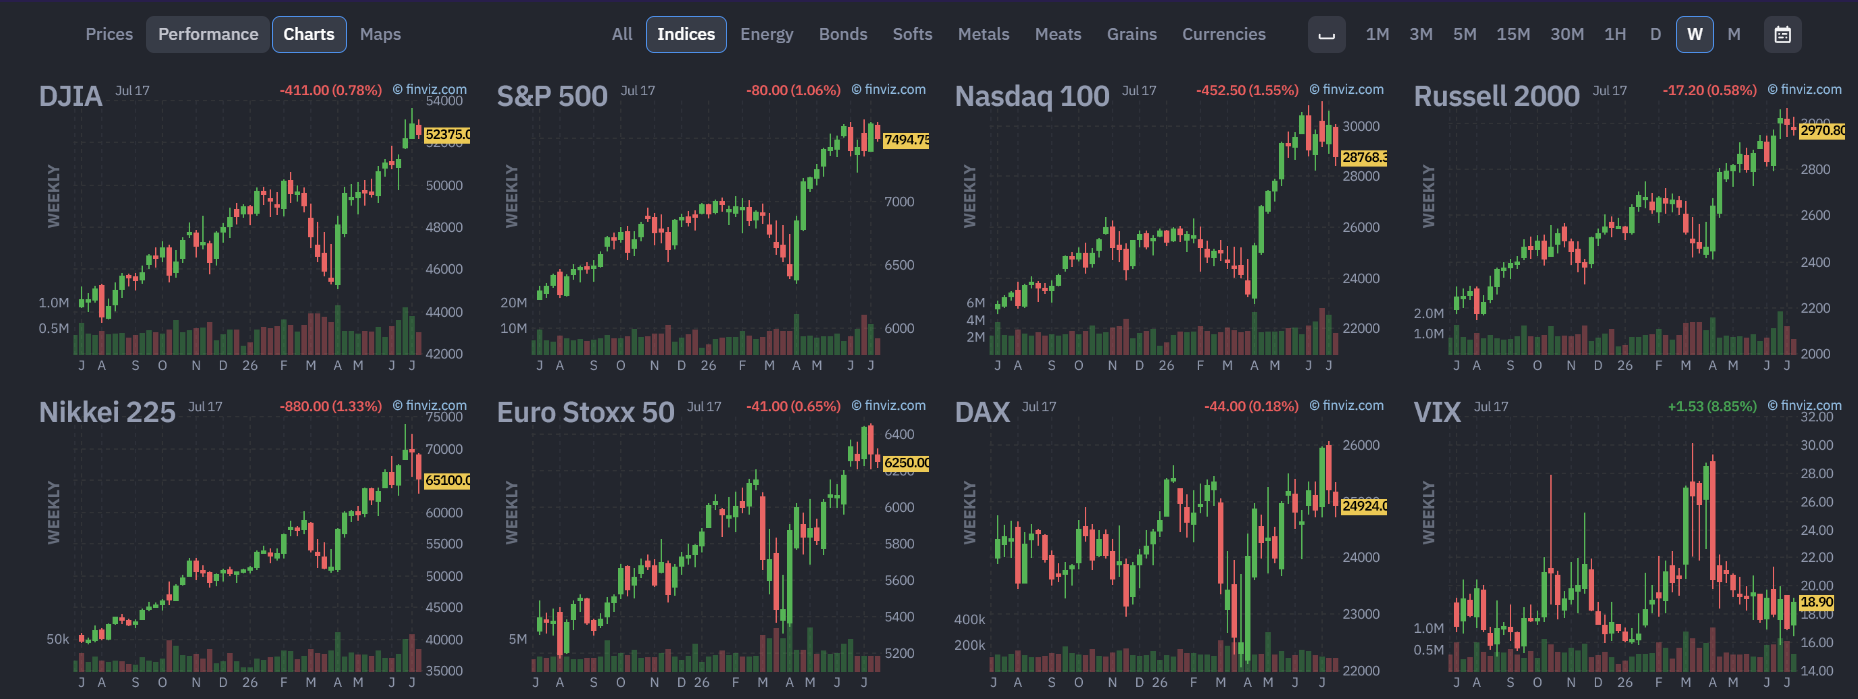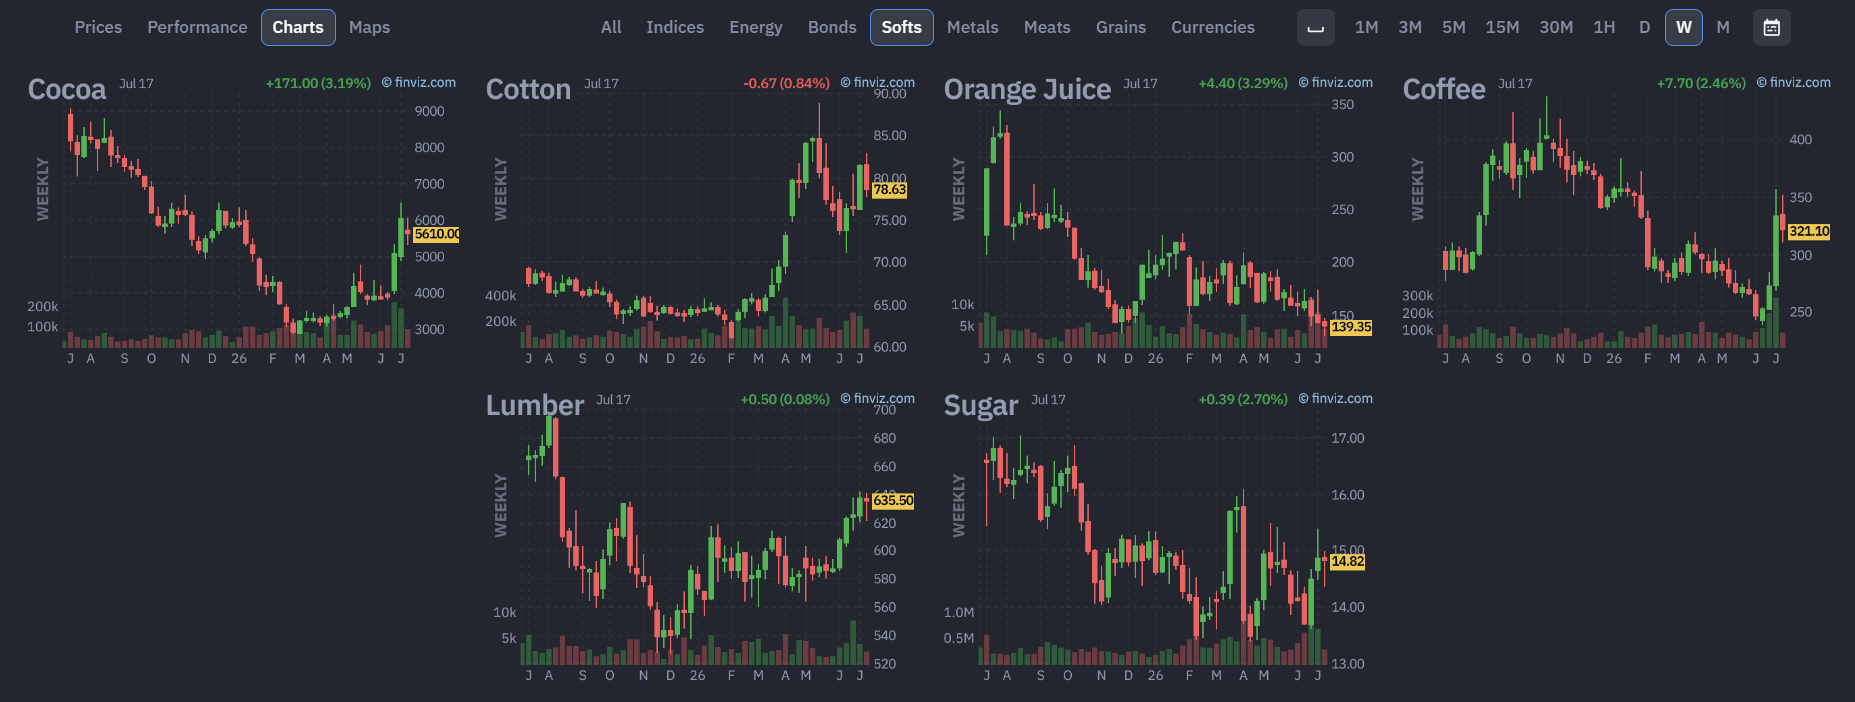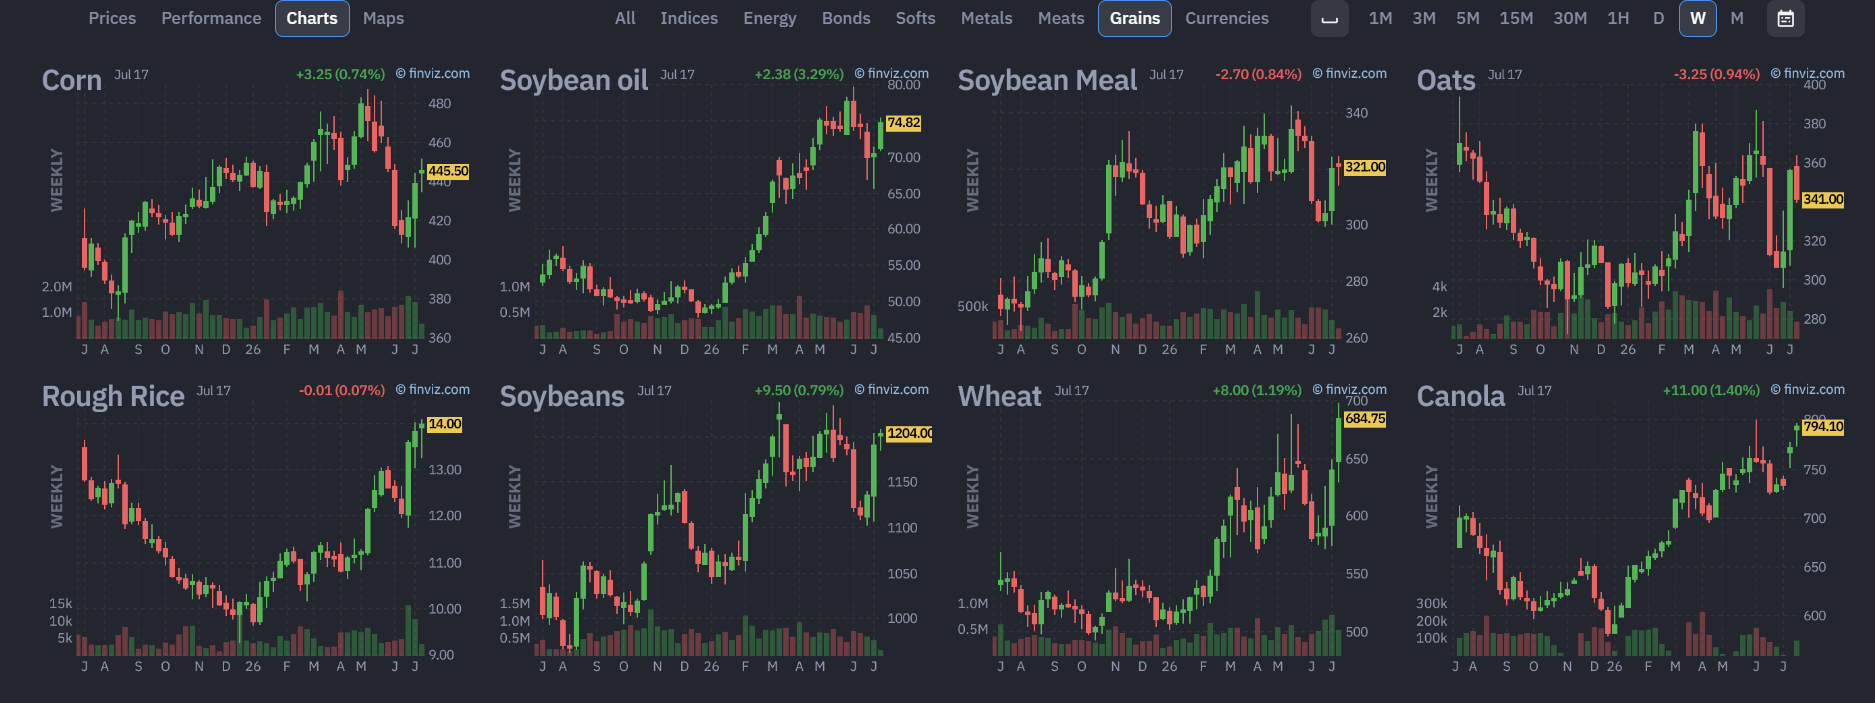




“Strength in the Wrong Direction”
June broke the pattern that had defined the first five months of 2026. For the first time in the cycle, the trend benchmarks closed lower, ending a run of five consecutive positive months, even as the trend environment itself firmed steadily through the month. The TTU Trend Barometer recovered from May's 32 in Moderately Weak territory to close June at 55, back at the boundary where Neutral gives way to a favourable regime, climbing week by week in the mirror image of May's collapse. Yet the three trend benchmarks each gave back ground, and the defining feature of the month was the divergence between the two: a trend environment that strengthened through June alongside benchmark returns that turned modestly negative. The S&P 500 Total Return Index also fell, slipping 0.95 percent as the equity advance paused near record highs into month-end, so that neither the systematic complex nor equities delivered a gain.
The SG Trend Index held up best of the three, easing 1.17 percent, narrowly ahead of the TTU Trend Following Index at minus 1.54 percent and the BTOP50 at minus 1.76 percent, a spread of under sixty basis points. The losses were modest, but their source is the point: the trend strength that firmed through June built almost entirely on the downside. The petroleum complex, whose violent reversals had defined May, resolved decisively lower, the precious metals rolled over from their winter and spring highs, the equity indices paused and pulled back from records into month-end, and Bitcoin extended a decline running since January. The Barometer, which counts the share of markets in medium-to-strong trends regardless of direction, rose because those moves were real and sustained; the benchmarks slipped because the new strength pointed the wrong way for books still carrying the long-equity and long-metals exposure that had rewarded them earlier in the year.
The Barometer's path traces the recovery. Entering June at 32, its lowest reading of the cycle, the indicator stepped back above the 40 boundary to 43 as a hotter-than-expected payrolls report drove a broad, synchronised risk-off move, held at 43 as equities and crypto rebounded while energy broke down, firmed to 45 on a split tape led by soft commodities, and rose 10 points to 55 into the final week as the equity uptrend rolled over and the petroleum and metals declines deepened. The sequence of 32, 43, 43, 45, 55 climbed steadily from Moderately Weak through Neutral to the favourable boundary, the exact inverse of May's slide, but with the crucial difference that June's firming came as markets fell rather than rose.
The benchmark results for June were as follows:
- TTU Trend Following Index: -1.54 percent for June (trailing 12 months +23.10 percent)
- SG Trend Index: -1.17 percent for June (trailing 12 months +24.14 percent)
- BTOP50 Index: -1.76 percent for June (trailing 12 months +14.73 percent)
- S&P 500 Total Return: -0.95 percent for June (trailing 12 months +22.33 percent)
The trailing twelve-month figures turned down, reversing the steady climb of the prior months as a stronger June 2025 rolled out of the window and a negative June 2026 took its place. The SG Trend Index now stands at 24.14 percent over the trailing year, the TTU TF Index at 23.10 percent, and the BTOP50 at 14.73 percent. On a year-to-date basis the SG Trend Index sits at 9.12 percent, the TTU TF Index at 8.56 percent, and the BTOP50 at 7.76 percent, all three easing from May but holding in positive territory through the first half of 2026, with the two pure trend benchmarks still ahead of the quasi-trend BTOP50.
June's message for trend followers is that a strengthening environment and a positive month are not the same thing. The Barometer's climb to the favourable boundary confirms that persistent, capturable trends returned after May's fractured tape, but they returned on the downside, and the diversified benchmarks that had built their year-to-date gains on the long side gave a little back as those moves ran against them. The cycle that began in January has not been broken, the benchmarks remain positive on the year and the drawdowns are shallow. But June was the month in which the environment turned back up while the composites turned down, and the resolution of the energy complex into a sustained decline now offers the kind of clean, persistent trend on the short side that the systematic universe can build on if it holds.
June 2026 Trend Index Performance
June delivered the first negative month of the 2026 cycle, the losses modest but earned in a month that reversed direction almost weekly before resolving into a broad risk-off move at the close. The SG Trend Index held up best at minus 1.17 percent, ahead of the TTU Trend Following Index at minus 1.54 percent and the BTOP50 at minus 1.76 percent, with the S&P 500 Total Return down 0.95 percent. The path to those figures, rather than the figures themselves, is what defined the month.
The month opened with a broad risk-off move. A hotter-than-expected May payrolls report, roughly 172,000 jobs against expectations near 88,000, pushed pricing toward a Federal Reserve that might raise rather than cut, and in the week to 5 June yields rose, the dollar reversed higher, and equities, the precious metals and bonds fell together, the equity indices down 2.18 percent, metals down 6.18 percent and Bitcoin down 16.94 percent. The synchronised decline lifted the Barometer from 32 back above the 40 boundary to 43, and the SG Trend Index, rewarded on established short exposure in crypto, grains and the non-dollar currencies, sat up 1.35 percent for the month at that point.
The following week reversed much of it. Equities and crypto rebounded, the Nikkei printing a fresh high, and the whipsaw cut against the positioning the prior week had rewarded. The Barometer held at 43, the change in direction leaving the share of trending markets unchanged, but the SG Trend Index surrendered roughly 2.27 points on the year to sit at minus 0.71 percent for the month, the sharpest give-back of June. The one clean directional development was the petroleum complex, which broke down hard as the spring supply premium began to unwind, opening a fresh short even as the broader reversal hit continuation books.
The second half of the month rotated leadership without resolving cleanly. In the week to 19 June the tape split, soft commodities surging on counter-trend bounces in Cocoa and Coffee while the equity indices extended toward records and crude fell for a second week, the Barometer firming to 45 and the index giving back a shallow 0.10 of a point. The final week turned decisively risk-off: the equity indices rolled over from record territory with the Nasdaq down 4.40 percent, the precious metals deepened their decline with Silver off 10.63 percent, crude extended its breakdown into a third week with Brent down 10.65 percent, and Cocoa surged a further 20.25 percent against the move. The breadth and persistence of the downside lifted the Barometer 10 points to 55, its close at the favourable boundary, while the SG Trend Index eased to minus 1.25 percent month-to-date before recovering to finish June at minus 1.17 percent.
As of 30 June 2026, the TTU Trend Following Index comprised 51 active programs, with 49 submitting performance data by the reporting cut-off and two yet to report, highlighted in the table below. The active count eased from 54 in May, the first step down after the run from 43 at the close of 2025 through 47, 49, 51 and 54 across the opening months of the year, a reconstitution effect rather than any change to the construction methodology, which continues to require a fully verified fifteen-year track record. The composite retains its broad, long-tenured cross-section, and in a month where the strongest trends ran counter to prevailing long positioning, the diversification that underpins each of the three benchmarks did its defensive work in reverse, limiting the give-back to a fraction of the year's accumulated gains rather than allowing any single sector reversal to compound into a larger loss.
The relationship with equities inverted the one May had displayed. In May the S&P 500 delivered the single clean trend of the period while the systematic complex absorbed a whipsaw and emerged marginally ahead; in June both fell together, equities pausing from records while the trend benchmarks gave back ground on the unwinding long-side trends. This downside co-movement is the counterpart to the upside co-movement of the prior two months, and, like it, it is incidental rather than structural. The correlation of minus 0.09 between the TTU TF Index and the S&P 500 over the long run confirms the two return streams remain independent, and a month in which both happen to fall says no more about that independence than one in which both advance.
SG Trend Index
The SG Trend Index is designed to track the 10 largest trend following CTAs of the Managed Futures space.
Criteria for inclusion in the Index, as determined by Société Générale, are as follows:
- Must trade primarily futures (including FX forwards);
- Must be broadly diversified across asset classes;
- Must be an industry recognized trend follower;
- Must exhibit significant correlation to trend following peers;
- Must be open to new investment; and
- Must report returns on a daily basis (net of fees).
The index currently is:
- Equally weighted;
- Calculated in base currency;
- Has an inception date of 1st January 2000;
- Rebalanced annually on 1st January; and
- Reconstituted annually on 1st January based on eligibility criteria.
There was a slight modification to the Index from January 2013 to the present. Previously the Programs needed to be a constituent of the SG CTA Index, and the 10 largest Managers was not a requirement.
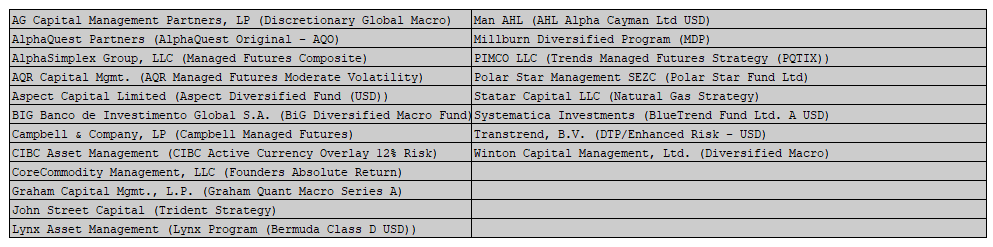
For the 2026 year, following the annual rebalance of the Index, we say goodbye to the Systematica Investments (BlueTrend) Program and welcome back the PIMCO LLC (PIMCO Trends Managed Futures) Program. The listing of the 10 eligible programs in the Index for 2026 is as follows:

The SG Trend Index, which tracks the ten largest institutional trend-following CTAs, declined 1.17 percent in June, its first negative month of 2026 and the end of a five-month run of positive returns that began in January. Even so, the index held up better than its peers, posting the smallest loss of the three trend benchmarks. The decline pulled the trailing twelve-month return down to 24.14 percent from 27.52 percent in May, the first step lower after months of steady gains as a stronger June 2025 rolled out of the window alongside the negative month itself. The year-to-date figure eased to 9.12 percent, slipping back below the double-digit territory it had held since April but preserving the bulk of the year's advance through the first half of 2026.
The month's shape was the reverse of May's. Where May round-tripped from an early loss up to a mid-month high and back to flat, June ran the other way, the index rising to a month-to-date high of 1.35 percent in the first week before surrendering that gain and more through the balance of the month. The largest institutional programs entered June carrying the long-side exposure that had rewarded them through the spring, principally in equities and the precious metals, alongside established shorts in crypto, grains and the non-dollar currencies. The opening payrolls-driven risk-off played to the short book, and the index gained as crypto, metals and the non-dollar majors fell together. From there the month turned against it: equities and crypto rebounded sharply in the second week, whipsawing the shorts that had just paid, and into month-end the long-side exposure came under pressure as the equity indices rolled over from records and the precious metals deepened their decline. The persistent short that developed in the petroleum complex, as crude fell for three consecutive weeks, cushioned the net, but it was not enough to offset the reversals elsewhere, and the index closed the month down just over one percent. A loss of this size through intra-month swings of this magnitude is the defensive face of scale and diversification, the same breadth of exposure that held May's whipsaw to a flat result containing June's reversals to a shallow one.
The long-term characteristics of the SG Trend Index were little changed on the month. Since inception it has delivered a historical CAGR of 5.57 percent with a maximum drawdown of 20.61 percent, reflecting both the durability and the inherent cyclicality of large-scale systematic programs. The CAGR eased marginally from 5.64 percent at the close of May, a single small down month pulling the long-term compounding rate slightly lower without materially altering the track record, while the maximum drawdown was unchanged, June's shallow loss falling well short of the levels that would extend it. These managers benefit most when sustained trends reassert themselves in the direction of their positioning, and June was a month in which persistence returned but ran the other way, a reasonable environment in which to give back a little rather than to compound gains.
Since its launch in 2000, the SG Trend Index has maintained its role as a core institutional benchmark for trend-following performance. Over the long run it sits between the higher-returning TTU Trend Following Index and the broader BTOP50 Index, capturing the central tendency of the industry's largest managers, though in June, as in May, the compression of the three benchmarks left it narrowly at the head, this time by posting the smallest loss rather than the largest gain. Its high correlation of 0.95 with the TTU TF Index reinforces its usefulness as a barometer of collective institutional behaviour, even as its construction produces more moderated long-run returns relative to smaller or more aggressive trend-following composites.
The performance of the SG Trend Index since 1st January 2000 to the end of last month is seen in the following chart:

You will notice how the SG Trend Index is highly correlated with the BTOP50 Index and the TTU TF Index and uncorrelated with the S&P500TR Index.
Despite the high correlation between the various trend following Indexes, the long-term performance of these three Trend Following Indexes in terms of CAGR is different. The SG Trend Index plots between the BTOP50 Index and the TTU TF Index.
BTOP 50 Index
The BTOP50 Index seeks to replicate the overall composition of the managed futures industry with regards to trading style and overall market exposure. Unlike the SG Trend Index and the TTU TF Index, the BTOP50 is not strictly a trend-following index and is more broadly representative of the entire managed futures segment, of which a dominant style is trend following. We like to think of the BTOP 50 as a ‘quasi trend-following Index’ as opposed to a pure trend-following Index.
Like the SG Trend Index, the BTOP50 Index is designed to track the performance of the largest Programs by AUM, however the Programs included may not be all Trend Following Programs.
The criteria for inclusion in the Index as determined by BarclayHedge are as follows:
- Must be a Program represented in the Barclay CTA Universe;
- In each Calendar year, the Programs selected must in aggregate be no less than 50% of the investable assets of the Barclay CTA Universe;
- The Programs must be open for investment;
- The Manager must be willing to provide Barclay Hedge with daily return performance;
- The Program must have at least two years of trading activity; and
- The Program’s advisor must have at least three years of operating history.
The index currently is:
- Equally weighted;
- Rebalanced annually on 1st January
- Reconstituted annually on 1st January based on eligibility criteria.
Despite the '50' tag in the BTOP 50 description, the 2026 constituent listing has not yet been released by BarclayHedge at the time of this report. The 2025 listing of 20 constituents remains the most recent available reference.
The BTOP50 Index declined 1.76 percent in June, its first negative month of 2026 and the end of the five-month positive run that began in January. It was the heaviest loss of the three trend benchmarks, leaving the index in third position among them for a second consecutive month, though this time by a wider margin than May's few basis points. Over the trailing twelve months, the index now stands at 14.73 percent, down from 18.65 percent in May, the first step lower after months of steady gains as a stronger June 2025 rolled out of the window alongside the negative month itself. The year-to-date figure eased to 7.76 percent through the first half of 2026, giving back part of the ground it had built toward the double-digit threshold that the two pure trend benchmarks reached earlier in the year and have themselves now slipped back below.
The BTOP50's position at the foot of the three carries more meaning in June than the compressed ordering did in May. Where May offered so little directional capture that the composites clustered within fourteen basis points, June produced sharp, persistent trends on the downside, and the broader managed futures construction of the BTOP50, with its meaningful weight to non-trend-following strategies, participated in the unwinding less selectively than the pure trend composites. The reversals that defined the month, the payrolls-driven risk-off, the mid-month equity and crypto rebound, and the month-end roll-over in equities and the precious metals, cut across the diversified book without the concentration in the developing energy short that cushioned the pure trend benchmarks, and the index gave back marginally more as a result.
The long-term profile of the BTOP50 was little changed on the month. Since inception it has produced a historical CAGR of 4.31 percent with a maximum drawdown of 15.94 percent, reinforcing its reputation for stability and risk moderation. The CAGR eased from 4.39 percent at the close of May to 4.31 percent now, a movement consistent with a modest down month that contributed below the long-term compounding rate, while the maximum drawdown was unchanged, June's shallow loss falling well short of the levels that would extend it. Neither the return nor the risk profile was altered in any material way.
June illustrated a different facet of the BTOP50's broad construction from the one May displayed. Where May's fracturing tape left the index flat because there were few sustained trends for any managed futures strategy to capture, June offered persistent trends in abundance, but on the downside and against prevailing long positioning, so the same breadth that had preserved capital in a directionless month produced a modest loss in a firming but reversing one. This is the structural trade-off seen from the other side: broad diversification dilutes convexity when directional conditions strengthen in the direction of positioning, and it offers no special shelter when they strengthen against it, leaving the index to give back ground alongside its trend-following peers rather than ahead of them.
The index's high correlation of 0.96 with the SG Trend Index and 0.93 with the TTU TF Index confirms that its performance remains closely aligned with its trend-following peers, even as its broader mandate produces more moderated long-term returns. The correlation of minus 0.10 with the S&P 500 Total Return Index remains an important structural feature of the index over the long run. Where April and May had seen the BTOP50 and the S&P 500 advance together, June saw them decline together, the equity index easing 0.95 percent as the trend benchmarks gave back more, a reminder that uncorrelated does not mean negatively correlated and that periods of co-movement, whether to the upside or the downside, are a natural feature of the long-run statistical relationship.
The performance of the BTOP 50 Index since 1st January 2000 to the end of last month is seen in the following chart:

The BTOP 50 Index is highly correlated with the trend following Indexes of the SG Trend Index and the TTU TF Index, however its long-term performance is the lowest of the 3 Trend Following Indexes. While there is a significant representation of Trend Following Programs within the Index, the non-trend following Programs contribute to this diluted long-term performance.
TTU TF Index
The TTU TF Index has been developed by Top Traders Unplugged to provide a performance measure of the trend-following programs with a long-term track record.
At TTU, we recognize the importance of a robust trading approach to these uncertain markets and feel that AUM is not a good robustness measure when it comes to assessing performance of the trend-following industry. It is our strong opinion that the ultimate selection measure to apply in constituting a Trend Following Index is not AUM or a proxy risk metric such as the Sharpe, Sortino, MAR ratio, Ulcer Index or Serenity ratio. The superior metric to assess long-term performance is the long-term validated track record itself.
We have therefore developed a different method for constructing our TTU TF Index.
The criteria for inclusion into the TTU TF Index are as follows:
- Monthly performance results need to be captured in the Nilsson Hedge CTA database;
- Must be geographically diversified across asset classes;
- Must be fully systematic in nature using quantitative rules for entry and exit;
- Must possess at least a 15-year unbroken track record to the current reporting month;
- Must adopt trend following as their dominant investment strategy;
- Are currently active programs; and
- Must report performance monthly (net of fees).
The Index:
- Is Equally weighted;
- Is Rebalanced monthly;
- Is Reconstituted monthly;
- Has an inception date of 1st January 2000
As of 30 June 2026, the TTU Trend Following Index is composed of 51 active programs, each with a long-term, fully verified performance record. This represents a step down from the 54 active programs at the close of May, the first contraction after the steady expansion from 43 programs at the close of 2025 through 47 in January, 49 in February, 51 in April and 54 in May. The reduction is a reconstitution effect rather than any change to the construction methodology, which continues to require a fully verified 15-year track record, and it returns the composite to its April level while retaining the broad, long-tenured cross-section of systematic trend-following behaviour that defines it. The monthly index return reflects the equal-weighted average performance of all programs reporting for the period.
For June, 49 of the 51 programs submitted performance data by the reporting cut-off, with two programs yet to report as highlighted in the table below. The reporting count matched May's 49 even as the active roster narrowed, so the share of the composite reporting for the month rose, with only two programs outstanding against five a month earlier. The index maintains continuity and consistency in its long-term construction, and the equal-weighted return for June is drawn from the highest reporting coverage in several months.

The performance of the TTU TF Index from 1st January 2000 to the end of last month is as follows:

Now you might be intrigued by the performance result of the TTU TF Index. While it is highly correlated with the BTOP 50 Index and the SG Trend Index, we can see that long term performance of the TTU TF Index clearly outstrips alternative Index measures.
The dominant contributor of this outperformance is the requirement for any participating Program in the Index to have a long-term track record. You see, using AUM as a criterion for inclusion is not necessarily a useful selection criterion. While AUM reflects ‘market appeal', it does not imply that this ‘market appeal' is strongly correlated with ‘long term performance'.
Our process of Index construction gives us an insight into how any diversified ensemble of trend following Programs with a long-term track record approaches an optimal portfolio as we increase the number of Programs in the Index. Simply by diversifying into a large ensemble of Trend Following Programs with a long-term track record, we magically improve the Index result. CAGR is increased and our drawdowns are reduced.
Of course, we already know this ‘diversification' principle of Trend Following. As we increase our diversification efforts, we obtain improvement both in terms of the maximum drawdown and in the CAGR generated by the ensemble. This is why we seek to strive for maximum market and system diversification within our individual programs. The TTU TF Index just takes this diversification one step further and diversifies across many different TF Programs to deliver a superior risk-adjusted result.
TTU TF Index Performance
The TTU Trend Following Index, composed exclusively of long-tenured systematic trend programs, declined 1.54 percent in June, its first negative month of the 2026 cycle and the end of a five-month run of positive returns. The index sat second among the three trend benchmarks for the month, behind the SG Trend Index at minus 1.17 percent and ahead of the BTOP50 at minus 1.76 percent, the same ordering as May but with the composites now separated by a wider fifty-nine basis points as the sharp downside trends of June gave the construction methodologies more to diverge on. Over the trailing twelve months the index stands at 23.10 percent, down from 26.30 percent in May, the first decline in the rolling figure after months of steady gains as a stronger June 2025 rolled out of the window alongside the negative month itself. The year-to-date figure eased to 8.56 percent through the first half of 2026, slipping back below the double-digit territory it had held since April but retaining the bulk of the year's advance.
June's loss was earned in a month that reversed the logic of May. Where May delivered a sustained whipsaw that never resolved, leaving the index flat as few moves persisted long enough to be captured, June delivered persistent trends in abundance, but on the downside and against the long-side exposure the composite carried into the month. The petroleum complex, which had swung two ways through May, broke down cleanly and fell for three consecutive weeks as the spring Strait of Hormuz supply premium unwound in full, rewarding the developing short. Against that, the equity indices rolled over from records into month-end and the precious metals deepened a decline from their winter and spring highs, both cutting against the long exposure that had rewarded the composite earlier in the year, while a mid-month rebound in equities and crypto whipsawed the shorts that the opening payrolls risk-off had paid. The TTU Trend Barometer traced 32, 43, 43, 45 and 55 across the weeks, climbing from its cycle low back to the favourable boundary, but the strength it measured pointed largely downward, and the index gave back a fraction of the year's gains rather than compounding them. This is the diversification methodology working defensively in reverse: the breadth across 51 long-tenured programs that had preserved capital through May's directionless tape now contained June's adverse reversals to a shallow loss rather than a damaging one.
The long-term profile of the TTU TF Index was little changed on the month. Since its inception in 2000, the index has delivered a CAGR of 7.62 percent with a maximum drawdown of 20.72 percent. The CAGR eased marginally from 7.70 percent at the close of May, a modest down month contributing slightly below the long-term compounding rate, while the maximum drawdown was unchanged, June's loss falling well short of the levels that would extend it. These characteristics continue to reflect the strength of the construction methodology, which prioritises the durability of verified track records over scale, popularity, or short-term risk statistics.
The TTU TF Index continues to exhibit strong alignment with institutional benchmarks, maintaining a correlation of 0.95 with the SG Trend Index and 0.93 with the BTOP50 Index. Yet despite these close relationships, it has consistently delivered superior long-term risk-adjusted performance. That edge rests on the track-record-based selection at the heart of the construction, and the composite retains a broad cross-section of systematic trend-following behaviour, with eight more programs than the 43 it held at the close of 2025 even after the reconstitution that trimmed the active roster from 54 to 51 this month. The breadth continues to smooth idiosyncratic variation while preserving the long-term performance edge that verified-track-record selection delivers, a diversification advantage that showed its defensive value in a month where the strongest trends ran against prevailing positioning.
For comparison, the S&P 500 Total Return Index declined 0.95 percent in June and now stands at 22.33 percent over the trailing twelve months. Since 2000, the S&P 500 TR has produced a CAGR of 8.22 percent, but with a substantially larger maximum drawdown of 50.95 percent. Where April and May had seen the TTU TF Index and the S&P 500 advance together, June saw them decline together, equities pausing from record highs while the trend benchmarks gave back rather more. The comparison this month is again one of contrast rather than partnership, but inverted from May: where May's equity strength dwarfed a flat systematic complex, June's modest equity pullback sat alongside a modest systematic loss, both engines easing at once. The low correlation of minus 0.09 between the two indices confirms that the sources of return remain fundamentally different, and this downside co-movement, like the upside co-movement of the prior two months, is a natural feature of that independence rather than a departure from it, the uncorrelated nature of the two return streams continuing to deliver the structural diversification benefit that defines trend following's role within a multi-asset portfolio.

TTU Trend Barometer
The TTU Trend Barometer closed June at 55, back at the boundary where Neutral gives way to a favourable regime, having climbed steadily through the month from the cycle low of 32 at which May ended. The month-end figure recovers the ground lost in May and stands in near-symmetry with it: where May's volatile journey resolved into a breakdown to 32, June's resolved into a recovery to 55, the two closes mirroring each other at opposite ends of the range. Yet the character of June's ascent sets it apart from a conventional recovery. The Barometer measures the persistence of price trends regardless of their direction, and June's climb was built almost entirely on the downside, as market after market fell together with force, so that the reading firmed even as the trend benchmarks it normally tracks gave back ground.
The Barometer, which measures the persistence of price trends across 44 global futures markets, began June at 32, in Moderately Weak territory below the 40 boundary. The first full week brought a broad, synchronised reversal: a hotter-than-expected May payrolls report drove market pricing toward a Federal Reserve that might raise rather than cut, and yields rose, the dollar reversed higher, and equities, the precious metals, grains and crypto fell together, the equity indices down 2.18 percent and metals down 6.18 percent. The uniformity of the decline lifted the Barometer from 32 to 43, back above the 40 boundary and into Neutral, with the 10-day rate of change reversing from “Falling Rapidly” to “Rising Weakly.” Crucially, the reading rose not because conditions turned benign but because a broad move lower restored the directional alignment that May's fractured tape had lost.
The second week held the level at 43 even as direction reversed beneath it. Equities and crypto rebounded, the Nikkei printing a fresh high, while the petroleum complex broke down hard, crude giving back its early-June bounce, and the metals split two ways. The share of markets in medium-to-strong trends was little changed as one set of trends replaced another, and the Barometer held flat while the rate of change firmed to “Rising Moderately.” The third week firmed the level to 45 on a split tape, soft commodities surging on counter-trend bounces in Cocoa and Coffee while the petroleum complex fell for a second week and the equity uptrend extended toward records, the count of strongly trending markets edging up even as the rate of change eased to “Falling Weakly.” The final week resolved decisively lower and lifted the Barometer 10 points to 55: the equity indices rolled over from record territory with the Nasdaq down 4.40 percent, the precious metals deepened their decline with Silver off 10.63 percent, crude extended its breakdown into a third week with Brent down 10.65 percent, and Bitcoin pressed lower, a cluster of sharp, persistent downside moves that carried the reading up to the favourable boundary with the rate of change back at “Rising Weakly.”
The month's Barometer trajectory, 32, 43, 43, 45 and 55, carries several important messages. First, the recovery was cumulative rather than indecisive, the reading building week by week without the repeated threshold tests that defined May, when the indicator tested the 55 line four times in five weeks without settling. June did not whipsaw across a boundary; it climbed toward one. Second, and most importantly, the ascent was driven by the downside. The Barometer rewards medium-to-strong trends regardless of direction, and June's firming came as the petroleum complex, the precious metals, the equity indices and crypto resolved into sustained declines, not as any broad advance took hold. Third, this is why the Barometer and the trend benchmarks diverged through the month. In the ordinary case a Barometer climbing toward favourable territory signals the return of the clean trends on which the composites compound; in June the trends that returned ran against the long-side positioning the benchmarks carried, so rising trend strength coincided with modest losses rather than gains. The reading is a faithful measure of how strongly markets were trending; it makes no claim about whether those trends favoured a long-biased book, and in June they did not.
At 55, the Barometer enters July at the favourable boundary, having recovered the full distance from May's cycle low. The “Rising Weakly” rate of change at the close tilts the evidence mildly toward further firming rather than a relapse, and the reading reflects a trend environment in which persistent, capturable moves have returned across most sectors, led by the breakdown in energy, the pullback in the precious metals and the pause in the equity advance. The condition for that strength to convert into benchmark gains, rather than to sit alongside losses as it did in June, is for the developing trends to hold and for positioning to align with them: the resolution of the petroleum complex into a sustained decline, now three weeks old, offers the clearest and most durable of those trends on the short side, and it is the kind of persistence whose return, rather than the mere presence of movement, is the condition required for the cycle to reassert itself.

The Trend Barometer is a proprietary tool we use at TTU to assess the trend strength of a diversified portfolio consisting of 44 markets across all sectors. We firstly subdivide the trend strength of each market of a hypothetical diverse portfolio into five ranges from strong up, medium up, neutral, medium down and strong down. We then aggregate these results into a single portfolio number which we use to describe the overall trend strength across a hypothetical Program portfolio.
We then arbitrarily divide this percentage range into 3 where a value of 0-30 is considered a very unfavourable market regime for trend following programs, a range between 30 to 55 is a somewhat neutral environment for Trend Following Programs (but not an environment where you could expect consistent performance) and values more than 55 are considered to be a favourable regime for trend following programs, where they should see good performance.
Aside from the occasional dispersed readings when compared to overall trend following performance, this method is surprisingly powerful in describing CTA monthly performance and can be used to connect market trading environments to resultant manager performance.
The Macro Environment
For a blow-by-blow macro wrap for the month, we recommend you listen to our weekly systematic investor series by clicking on the links below. It is also worthwhile listening to our past catalogue, as it provides you with an understanding of how these markets can shape the emotions of a trader and why it is therefore essential that trend followers adopt systematic rules-based processes to keep these emotions in check.
You can find all of our weekly conversations by clicking this link.
Top 10 Lists
We have prepared the following Top 10 lists (excluding non-reporting programs) for various performance categories based on monthly performance returns for a 15-year period commencing 1st January 2011 to the current month.
Top 10 Listing – by Compound Annual Growth Rate


Top 10 Listing – by Risk Adjusted Return (Serenity Ratio)


Top 10 Listing – by Last 12 months Performance


Performance Results for the TTU Top 5 by Serenity Ratio
In a research project we undertook at TTU, we examined three different allocation methods that could be deployed by an investor seeking to optimally allocate investment funds towards 5 of the top-ranked Globally Diversified Systematic Trend Following Programs with a long-term track record.
These three methods adopted 3 different forms of performance metric, namely:
- Top 5 performers by Compound Annual Growth Rate (CAGR) using a rolling lookback of 15 years.
- Top 5 performers by MAR ratio (CAGR/Max Draw%) using a rolling lookback of 15 years.
- Top 5 performers by Serenity Ratio using a rolling lookback of 15 years.
The findings of our project can be obtained by clicking on this link.
Our research determined that the optimal selection method was the Serenity Ratio method.
The Serenity Top 5 Selection Method delivered a 4.27 percent loss in June, its second negative month of 2026 and by far the steeper of the two, following May's 0.84 percent giveback. The two months together mark a clear pullback from April's standout 7.30 percent gain, which remains the strongest monthly result of the year, and June's loss is the steepest single month of 2026 for the composite. The concentration that had amplified April's exceptional upside worked in full reverse this month: where the broad benchmarks gave back between one and two percent, the five-program Serenity grouping surrendered more than four. The trailing twelve-month return fell to 37.45 percent from 44.68 percent in May, the first decline in the rolling figure as a stronger June 2025 rolled out of the window alongside the negative month, and the year-to-date return eased to 15.12 percent through the first half of 2026. That remains a solid start to the year, but two consecutive down months have trimmed roughly six points from the April peak, and the pullback is now material rather than marginal.
June's loss is the mirror of April's gain, and the two illustrate the character of the concentrated composite as clearly as May and April did. The Serenity-selected managers navigated the same reversals that cost the broad benchmarks a modest amount, but the concentration that lets the grouping compound so powerfully when trends run in its favour cuts the other way when they do not. The first half of June was the harder stretch: a payrolls-driven risk-off gave way to a sharp equity and crypto rebound within a week, the kind of two-way reversal that whipsaws a convex, trend-sensitive book, and the leadership rotated before positioning could settle. The second half delivered persistent downside trends in energy, the precious metals and the equity indices, but a book carrying the long-side exposure that had rewarded it through the spring would not have held those declines in full. The Barometer's climb from 32 to 55 offered no shelter here: in May the composite gave ground as the Barometer fell, and in June it gave more as the Barometer rose, because both months lacked the sustained persistence in the direction of positioning on which the composite thrives. A loss of this size is the downside face of the same asymmetry that produced April's gain, not a departure from it.
The 2026 Serenity selection retains all five programs from the 2025 listing, with the revised ranking order effective from 1 February 2026 to 31 January 2027. The continuity of the selection reflects the durability and consistency of these managers' risk-adjusted performance across a full 15-year evaluation window. Mulvaney Capital Management's Global Diversified Program continues to be the primary source of variability within the portfolio, and June demonstrated the downside of that variability as sharply as April demonstrated the upside. Its high-convexity profile, which amplified the composite's gains in April as energy resolved into a sustained uptrend, worked against it through June's repeated first-half reversals and the mid-month rotation of leadership, precisely the conditions in which a convex program tracking expanding trend persistence gives ground rather than gaining it. This behaviour remains a defining feature of the Serenity composite, introducing controlled variability that cuts in both directions while preserving the long-term asymmetry that the framework is built to capture.
The Serenity Ratio continues to prove effective as a manager selection tool by prioritising durability, drawdown control, and long-term persistence over short-term performance metrics. Across the full reporting horizon, the Serenity composite has delivered a CAGR of 5.66 percent with a maximum drawdown of 26.82 percent, while maintaining a low correlation of minus 0.02 to the S&P 500 Total Return Index. The CAGR eased from 5.85 percent at the close of May to 5.66 percent now, a larger single-month move than the broad benchmarks recorded and consistent with the composite's greater concentration, while the maximum drawdown was unchanged, the two-month cumulative loss of roughly five percent falling well short of the historical extreme. These characteristics reinforce the composite's role as a structural diversifier within multi-asset portfolios. June's combination of a 4.27 percent loss alongside a 0.95 percent equity decline shows a different facet of the diversification relationship from the one May displayed: where May saw the two return streams move in opposite directions, the composite falling while equities rose, June saw them fall together but by very different magnitudes and for entirely different reasons. Over the long run, the near-zero correlation confirms that this co-movement, like May's divergence, is incidental rather than structural, and that the sources of return within the Serenity composite remain fundamentally distinct from those driving traditional markets.

The 2026 Serenity selection is as follows and will be maintained for the investment period between 1st February 2026 to 31st January 2027:
- Man AHL: AHL Evolution;
- Man AHL: AHL Alpha;
- Quantica Capital AG: Managed Futures Program;
- Mulvaney Capital Management: Global Diversified Program; and
- Man AHL: AHL Dimension.
Individual Performance Results for the 5 Programs used for the Serenity allocation to the reporting month using the 2026 listing are as follows:


Performance Results for the Alternative 60/40 portfolio using the TTU Top 5 by Serenity Ratio
In our “How to Invest with the Best”blog post, we also highlighted the significant improved risk-adjusted performance results that could be achieved by replacing the 40% allocation to Bonds in the traditional 60/40 portfolio with an allocation of 40% towards the TTU Top 5 by Serenity ratio.
The evaluation compared the performance of a traditional 60% Equity/40% Bond portfolio against a 60% Equity/40% Serenity portfolio to highlight the uncorrelated historical nature of this Alternative 60/40 portfolio and demonstrate the benefits that a sizeable allocation towards the Serenity portfolio would bring to an investor if equity and bond markets go back to their historic relationship and become more positively correlated in the future. There is no guarantee that correlations remain static over time and it is possible that bond markets and equity markets may lose their uncorrelated relationship that has existed in the last 20 years or so. It is far less likely that the TF managers within the Serenity Grouping will ever be strongly positively correlated to the Equities market, over the long run, given the extensive global diversification and ability to go long and short, that is present within the constituents of the Serenity Grouping.
Chart 21 below showcases the comparative performance results for the period 1 January 2000 to the end of last month:
- A 100% investment in the S&P500TR portfolio;
- A 100% investment in the VBMFX which is a proxy for the bond market;
- A 100% investment in the VBIAX which is a suitable proxy for the classic 60% Equity/40% Bond portfolio;
- A 100% investment in a 60% S&P500TR 40% Serenity portfolio; and
- A 100% investment in the Serenity Portfolio.

The comparison of alternative portfolio allocations above highlights the strong historic risk adjusted returns that have been enjoyed by 60% S&P500TR / 40% Serenity Composite Portfolio.
A more detailed assessment of this powerful 60/40 investment option is reflected below.

Important Disclaimers
This document is directly solely to Accredited Investors, Qualified Eligible Participants, Qualified Clients and Qualified Purchasers. No investment decision should be made until prospective investors have read the detailed information in the fund offering documents of any manager mentioned in this document. This document is furnished on a confidential basis only for the use of the recipient and only for discussion purposes and is subject to amendment This document is neither advice nor a recommendation to enter into any transaction. This document is not an offer to buy or sell, nor a solicitation of an offer to buy or sell, any security or other financial instrument. This presentation is based on information obtained from sources that TopTradersUnplugged (“TTU”) (“considers to be reliable however, TTU makes no representation as to, and accepts no responsibility or liability for, the accuracy or completeness of the information. TTU has not independently verified third party manager or benchmark information, does not represent it as accurate, true or complete, makes no warranty, express or implied regarding it and shall not be liable for any losses, damages, costs or expenses relating to its adequacy, accuracy, truth, completeness or use.
All projections, valuations, and statistical analyses are provided to assist the recipient in the evaluation of the matters described herein. Such projections, valuations and analyses may be based on subjective assessments and assumptions and may use one among many alternative methodologies that produce different results accordingly, such projections, valuations and statistical analyses should not be viewed as facts and should not be relied upon as an accurate prediction of future events. There is no guarantee that any targeted performance will be achieved Commodity trading involves substantial risk of loss and may not be suitable for everyone
TTU is not and does not purport to be an advisor as to legal, taxation, accounting, financial or regulatory matters in any jurisdiction. The recipient should independently evaluate and judge the matters referred to herein. TTU does not provide advice or recommendations regarding an investor’s decision to allocate to funds or accounts managed by any manager (“or to maintain or sell investments in funds or accounts managed by any manager, and no fiduciary relationship under ERISA is created by the investor investing in funds or accounts managed by any manager, or through any communication between TTU and the investor
In reviewing this document, it should be understood that the past performance results of any asset class, or any investment or trading program set forth herein, are not necessarily indicative of any future results that may be achieved in connection with any transaction. Any persons subscribing for an investment must be able to bear the risks involved and must meet the suitability requirements relating to such investment. Some or all alternative investment programs discussed herein may not be suitable for certain investors This document is directed only to persons having professional experience in matters relating to investments. Any investment or investment activity to which this document relates is available only to such investment professionals. Persons who do not have professional experience in matters relating to investments should not rely upon this document.
This document and its contents are proprietary information of TTU and may not be reproduced or otherwise disseminated in whole or in part without TTU’s prior written consent.
This document contains simulated or hypothetical performance results that have certain inherent limitations AND SHOULD BE VIEWED FOR ILLUSTRATIVE PURPOSES. Unlike the results shown in an actual performance record, these results do not represent actual trading. HYPOTHETICAL PERFORMANCE RESULTS HAVE MANY INHERENT LIMITATIONS, SOME OF WHICH ARE DESCRIBED BELOW. NO REPRESENTATION IS BEING MADE THAT ANY ACCOUNT WILL OR IS LIKELY TO ACHIEVE PROFITS OR LOSSES SIMILAR TO THOSE SHOWN IN FACT, THERE ARE FREQUENTLY SHARP DIFFERENCES BETWEEN HYPOTHETICAL PERFORMANCE RESULTS AND THE ACTUAL RESULTS SUBSEQUENTLY ACHIEVED BY ANY PARTICULAR INVESTMENT ACCOUNT.
ONE OF THE LIMITATIONS OF HYPOTHETICAL PERFORMANCE RESULTS IS THAT THEY ARE GENERALLY PREPARED WITH THE BENEFIT OF HINDSIGHT IN ADDITION, HYPOTHETICAL TRADING DOES NOT INVOLVE FINANCIAL RISK, AND NO HYPOTHETICAL TRADING RECORD CAN COMPLETELY ACCOUNT FOR THE IMPACT OF FINANCIAL RISK IN ACTUAL TRADING FOR EXAMPLE, THE ABILITY TO WITHSTAND LOSSES OR TO ADHERE TO A PARTICULAR TRADING PROGRAM OR OTHER ASSET.
There are numerous other factors related to the markets in general or to the implementation of any specific trading program which cannot be fully accounted for in the preparation of hypothetical performance results and all of which can adversely affect actual trading results. No representation is being made that any investment will or is likely to achieve profits or losses similar to those being shown.