


How to Invest with the Best: The Case for Increasing Allocations towards Globally Diversified Systematic Trend Following CTAs
At TopTradersUnplugged (“TTU”) we are passionate and committed advocates of Systematic Globally Diversified Trend Following, and our content focuses on ways to inform you about this very robust and powerful (but often overlooked) technique applied by many very successful Fund Managers.
While I spend a lot of my time with my guests discussing ways to compel greater allocations of investment capital towards this proven segment of the Alternative Investment Industry, some of you have suggested that there really is no need to consider other investment classes. The Trend Following segment itself is already highly diversified, offers superior risk adjusted returns (if done right) and can demonstrate via the proven track record of a number of industry practitioners how this method has delivered real wealth to its investors for decades.
In fact, my good friends from ‘Down Under’ at ATS Trading Solutions have been regularly producing a monthly report covering the Trend Following industry that showcase how an investor can invest in established Systematic Trend Following Managers to generate superior long-term wealth.
Now of course you could take the far harder road yourself and spend many years learning the ropes of systematic diversified trend following before attempting to develop your own algorithmic systems and diversified portfolios to invest in, but for those interested in the road to long term wealth, there is a far easier path to take. Namely, to jump on the shoulders of existing Systematic Trend Following Managers with a long-term and proven track record and simply ‘invest with the best’.
To demonstrate what we mean, Rich and I would like to demonstrate how an investor with about half a million in investment capital can participate in either a direct investment or a sizeable allocation to this investment opportunity to benefit from the considerable risk adjusted returns this segment brings to an investment portfolio.
To do this, we are using the excellent free data resources of NilssonHedge to obtain return data from the Managers. Nilsson Hedge maintain an industry database that is accessible by the public which captures monthly returns of the Hedge Fund universe with particular emphasis placed towards the performance returns of the Commodity Trading Advisors (CTA’s). Having obtained this monthly return data we then narrow our focus to those CTAs that meet the definition of globally diversified systematic trend following managers.
Who are the Diversified Systematic Trend Following CTAs?
Within this segment of CTAs, we have many of the Managers that have featured on Top Traders Unplugged over the years such as Marty Lueck, David Harding, Marty Bergin, Nigol Koulajian and Jerry Parker (who was of course part of Richard Dennis’s famous ‘Turtle Traders’ you may be familiar with).
This group of Managers place a great deal of emphasis on methods of diversification within their trend following models in terms of geography, asset class, system design, and timeframe to name a few. Given the extensive diversification that is achieved by these Managers across hundreds of non-correlated return streams, this method of trading necessitates a systematic rules-based process of application.
The globally diversified systematic trend following CTAs saw fairly rapid growth since their humble beginnings in the 1970’s, although this growth has largely plateaued in the past decade, and within the Nilsson Hedge database, as at 31st March 2021, we have about 151 current Programs to choose from which are:
- Geographically diversified across a broad array of asset classes that include soft commodities, energies, metals, bonds, fixed income, foreign exchange, and equities;
- Fully systematic in nature using quantitative rules-based processes for entry and exit decisions; and
- Adopt Trend Following trading techniques as the dominant investment strategy within the Program.
Now while this segment of CTA’s have experienced strong growth in Program numbers, we focus our attention on those current Programs with at least a 15-year track record.
Having a long track record is perhaps the best indicator of Program/Manager robustness. To still be delivering absolute returns to the investor over such a duration takes a special breed of Manager. One who has expertise in surviving the turmoil of a variety of different market regimes.
As at 31st March 2021 we can therefore refine our listing to 38 Programs (with a minimum 15-year track record) that meet the criteria as being Systematic Globally Diversified Trend Following Funds.
Table 1: Globally Diversified Trend Following Funds with at least a 15-year track record as at 31st March 2021.

The 38 Programs listed in Table 1 are the current list of Programs that meet our definition, but over the past 20 years or so, we have seen a further 113 Programs also meet this definition. These 113 Programs have subsequently ceased operation.
So, given this large number of Programs that meet this definition (a total of 151 Programs over a 21-year investment horizon), a question arises for an investor seeking to allocate investment capital towards these Programs. How do we, as investors with finite capital looking to invest in the track record of these Programs choose the top performers from amongst these 151 Programs …without the benefit of hindsight?
You see, sitting with the performance results of these Programs in front of us, it is an easy process selecting the top handful of performers since January 2000, but without a crystal ball looking forward in time, how do we in say year 2000 choose which Programs to invest in from this very large listing.
Fortunately, there is a “simple” process we can apply which avoids any form of hindsight bias yet allows us to select those performers which offer excellent risk adjusted returns and we will step you through this method of allocation.
Methods of Optimal Allocation
Let us assume that we have $500K to invest and we wish to obtain broad exposure across 5 CTAs with an equal allocation of $100K that meet the following definition:
- Are currently active Programs;
- Possess at least a 15-year track record;
- Are globally diversified and invest across a broad array of asset classes;
- Are fully systematic in nature using quantitative rules-based processes for entry and exit decisions;
- Adopt Trend Following trading techniques as the dominant investment strategy within the Program;
- Offer pooled Onshore and/or Offshore investment vehicles; and
- Allow for a Minimum investment of $100K.
Here are 3 possible methods we could apply using different performance metrics in our selection criteria.
- Top 5 Performers by Compound Annual Growth Rate (CAGR) using a rolling lookback of 15 years.
- Top 5 Performers by MAR ratio (CAGR/Max Draw%) using a rolling lookback of 15 years.
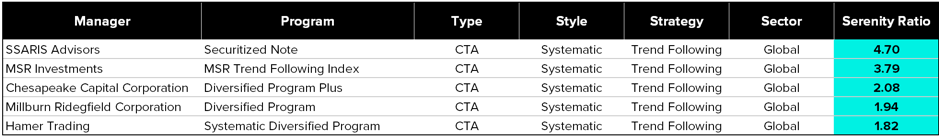
- Top 5 Performers by Serenity Ratio using a rolling lookback of 15 years.
We compare these 3 different selection methods in this paper to demonstrate that while each of these methods produces a satisfactory long term investment performance result, the third selection method (Top 5 Performers by Serenity Ratio) is the superior selection approach.
For further information on these risk management metrics interested readers are encouraged to read this excellent article by Keyquant.
How we Undertake the Process
Let us say we are Marty McFly, and we take our DeLorean back to December 1999. We want to invest our hard-earned $500K capital in the optimal selection of the best 5 long-term Trend Following Funds of the day.
So, we look at our list of Trend Following Managers available in December 1999 with a 15-year track record and we then select which recipe we are going to use for our long-term investment process and then we calculate the CAGR, the MAR or the Serenity Ratio for the period 1st January 1985 and 31st December 1999.
Having undertaken these calculations, we then rank the results to obtain the top 5 for each recipe.
Here are the Top 5 (highlighted) ranked results for each method for the 15-year period to 31 December 1999:
Table 2: Top 5 Performers by Compound Annual Growth Rate (CAGR)
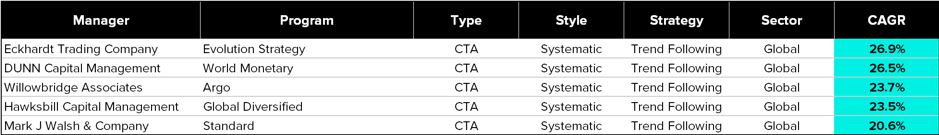
Table 3: Top 5 Performers by MAR ratio (CAGR/Max Draw%)

Table 4: Top 5 Performers by Serenity Ratio
Having chosen the method of allocation and following the determination of the Top 5 ranked Funds we then equally allocate our $500K capital across the top 5 for each method and hold this investment allocation for a period of 12 months till 31 December 2000. With initial capital available of $500K we therefore allocate $100K to each of the Top 5 in the listing.
When we arrive 12 months later at 31st December 2000, we then undertake the process again by reviewing the performance of eligible Managers over the prior 15-year lookback window.
Let us assume that our investment capital for the 12 months to 31 December 2000 earned $45K for the year. We therefore have a new total of $545K to allocate. We rerun this exercise again to find the Top 5 in accordance with our chosen allocation method and then equally allocate our available equity of $545K across the Top 5 performers assigning $109K to each Fund.
As you can imagine, we simply undertake this process as soon as Fund Performance results are made available for each Calendar Year ending 31 December. In practical terms given reporting delays, this means that we actually invest early February each year based on the performance period ending 31 December for each 15-year rolling lookback period, or do the review based on data as of the end of November each year, which mostly like would not produce a significant difference.
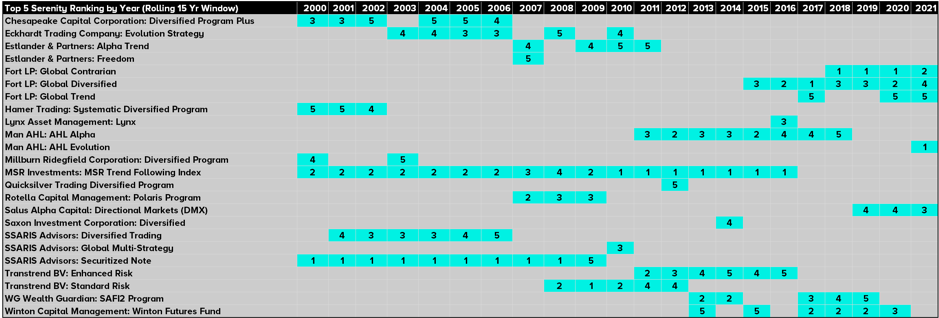
By applying this process, the following Tables demonstrate the Top 5 Funds that were invested in each year between 1st January 2000 to-date.
Table 5: Top 5 Performers by CAGR using a rolling lookback of 15 years

Table 6: Top 5 Performers by MAR Ratio using a rolling lookback of 15 years
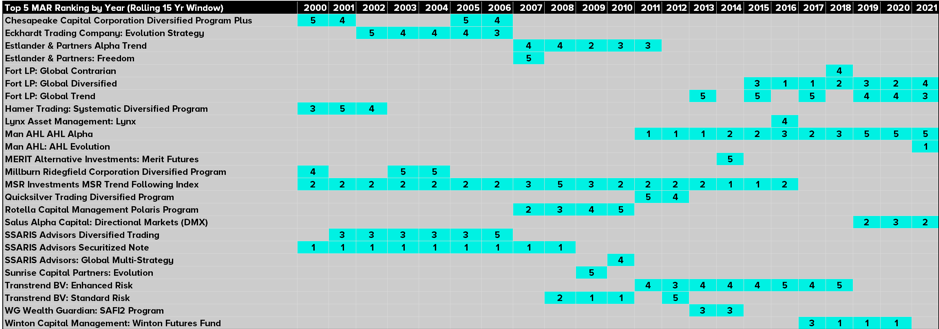
Table 7: Top 5 Performers by Serenity Ratio using a rolling lookback of 15 years
Performance Results Between Each Allocation Method
We can now evaluate the performance results of each allocation method over the performance period from 1st Jan 2000 to 31st March 2021. Please note that updates are available each month on this blog.
Chart 1: CAGR Selection Method

The CAGR method for manager selection produces an overall performance result that approximates the returns of a 100% investment in the S&P500TR index over the investment period, BUT with far lower drawdowns.
The CAGR for the 21-year period as displayed in Table 8 was 6.18% per annum with a maximum drawdown of 31.67%. The S&P500TR index experienced a 6.82% return per annum over the same period with a maximum drawdown of 50.95%.
Chart 2: MAR Selection Method

The MAR method for manager selection produced a far superior risk adjusted return than the CAGR method over the same investment period and the method also surpassed the risk-adjusted performance metrics of a 100% investment allocation in the S&P500TR index.
Using the MAR method for selection, Table 9 reflects a CAGR for the 21-year period of 5.20% per annum with a maximum drawdown of 15.84%. The far lower volatility experienced in this method provides a suitable option for those investors seeking quality returns without the commensurate drawdown exposure experienced by most traditional or alternative investments.
Chart 3: Serenity Ratio Selection Method

The Serenity Ratio method for manager selection produced the best risk adjusted returns than either the CAGR or the MAR method. This is not surprising as the Serenity Ratio itself is a ‘path dependent’ method of investment selection, unlike more popular selection methods like Sharpe or Sortino ratio. This risk adjusted ratio adopts a path dependent measure (evaluates the degree of autocorrelation in the equity curve) and estimates both the average and extreme risks carried by a Portfolio.
Using the Serenity method for selection, Table 10 reveals a CAGR for the 21-year period of 5.20% per annum with a maximum drawdown of 14.44%. The result is marginally improved from the MAR method of investment allocation.
Comparative Performance Results
Chart 4 below reflects the comparative performance results of the 3 different selection methods against the performance of the S&P500TR index over the 21-year performance period.
Chart 4: Comparative Performance of Selection Methods
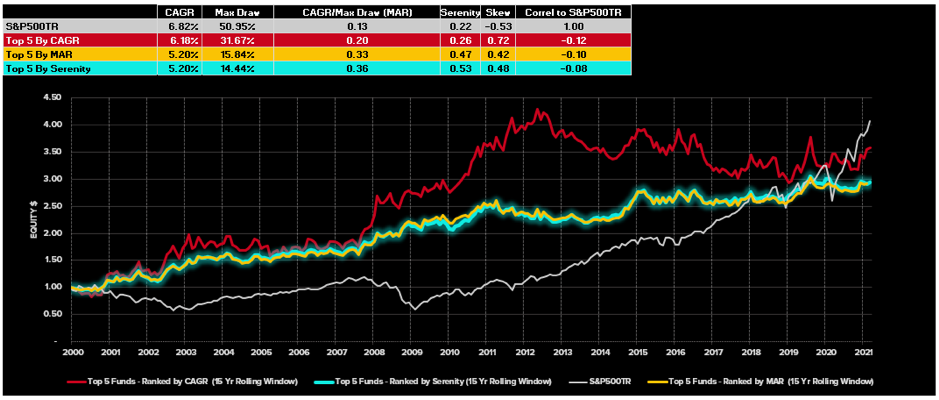
It is clear from the risk adjusted metrics of Chart 4 above that the Top 5 method of selection by either MAR or the Serenity Ratio produces the biggest ‘bang for the risk buck’ of the different alternatives. According to this performance result, the Serenity Ratio method of selection produced the optimal allocation result with an overall CAGR for the 21-year period of 5.20% with a Maximum drawdown of 14.44%. This represents a MAR of 0.36.
Such low levels of drawdown allow those investors with a higher risk appetite to include a degree of leverage in their funding allocation to achieve higher returns with commensurate increases in overall maximum drawdown. For the purposes of this assessment, we have excluded the potential to enhance returns through leverage and assume a 100% capital allocation of equity in the investment decision.
Building a Better 60/40 Portfolio with Trend Following
From the analysis already conducted I have hopefully convinced you of the significant wealth building returns that can be generated by a 100% investment allocation in this group of specialist long term CTA’s using powerful path dependent risk selection techniques such as the Serenity Ratio, but what about those investors who already have a sizeable portfolio invested in more traditional portfolio allocation methods such as the classic 60% Equity/40% Bond Portfolio?
We would like to argue the case in this paper for why an allocation of say 40% of a traditional portfolio towards this investment category of trend following CTAs makes so much sense.
It has long been argued by many passive investors that the 60% Equity and 40% Bond Portfolio offers better risk adjusted returns than a 100% investment in US Equities…and while this may have been true in recent history where bond performance has been largely uncorrelated / negatively correlated with equity performance, this may not be the case in the future.
You will notice in Chart 5 below that the Top 5 Funds Ranked by the Serenity Ratio are almost perfectly uncorrelated with US equity market with a Pearson Correlation Coefficient of -0.08 for the performance history since 1st January 2000. And perhaps more importantly, it is unlikely that these systematic globally diversified Trend Following managers will ever become highly correlated with US Equities for long periods of time, as their geographic and system diversification ensures that their performance behaviour will be quite unlike the US Equity market…or any developed equity market for that matter.
So, let us now compare the following outcomes over the Performance period from 1st January 2000 to 31st March 2021 to see what differing allocations towards Equities, Bonds and the Top 5 CTAs ranked by the Serenity ratio has achieved over the performance history.
For the US Equity market, we use the S&P500TR Index as a performance proxy for this sector and for the classic 60% Equity/40% Bond Portfolio we use the Vanguard Balanced Index (VBIAX) as our proxy. We then create the “Alternative 60/40” portfolio using the Top 5 Funds ranked by the Serenity ratio, instead of bonds.
Chart 5: Comparative Performance of Different Hypothetical Portfolio Models

Now while a 100% allocation towards the Top 5 by Serenity produces a CAGR of 5.20% with a Max Drawdown of 14.44%, a 60% Equity and 40% allocation towards the Top 5 by Serenity Ratio produces a CAGR of 6.76% with a Maximum Drawdown of only 26.86%. This is an outstanding result for those seeking superior risk-adjusted returns from the Traditional 60% Equity and 40% Bond portfolio.
Chart 6 below displays the detailed performance results of the proposed “Alternative 60/40” Portfolio in all its glory.
Chart 6: S&P500TR/Serenity (60/40 Method)

Now, this performance result is based on past performance where Bonds and Equities have displayed favourable correlation benefits, due to the falling interest rates for the past 40 years….but if the story changes in the future and Equities and Bonds become highly positively correlated which they have been for the most part over the last 100 years, then the prior favourable correlation offsets may disappear making the traditional 60% Equity and 40% Bond Portfolio a highly volatile investment option. This is a further reason to at least consider and ideally take action towards altering the investment allocation by replacing the 40% Bond allocation to a 40% allocation to the Top 5 by Serenity portfolio of long-standing globally diversified systematic CTAs.
Conclusion
We hope this short write-up highlights the benefits of at least considering a larger allocation towards the long-standing globally diversified systematic CTA’s that are the subject of this selection method. You really do not need to look elsewhere when deciding how to allocate your investment capital.
We recommend the Serenity Ratio as a powerful tool to use in the manager selection process when making allocations towards this segment of the Alternative Investment industry and treat the extent of the performance track record as a most valuable guide in the selection process.
The managers who are the subject of this write-up are already highly diversified which assist in delivering powerful risk adjusted returns and from their long-term track record, these highly experienced managers have demonstrated their ability to offer wealth building returns while protecting investors finite capital across a broad array of different market conditions.
When it comes to wealth building over the long-term, a long-term track record of performance success is perhaps your most reliable guide for an uncertain future. No-one knows what the future will bring…but at least we know from the validated track records of these long-standing managers that they are no strangers to taking uncertainty by the horns and delivering absolute investment returns for their clients.
Important Disclaimers
This document is directly solely to Accredited Investors, Qualified Eligible Participants, Qualified Clients and Qualified Purchasers. No investment decision should be made until prospective investors have read the detailed information in the fund offering documents of any manager mentioned in this document. This document is furnished on a confidential basis only for the use of the recipient and only for discussion purposes and is subject to amendment This document is neither advice nor a recommendation to enter into any transaction. This document is not an offer to buy or sell, nor a solicitation of an offer to buy or sell, any security or other financial instrument. This presentation is based on information obtained from sources that TopTradersUnplugged (“TTU”) (“considers to be reliable however, TTU makes no representation as to, and accepts no responsibility or liability for, the accuracy or completeness of the information. TTU has not independently verified third party manager or benchmark information, does not represent it as accurate, true or complete, makes no warranty, express or implied regarding it and shall not be liable for any losses, damages, costs or expenses relating to its adequacy, accuracy, truth, completeness or use.
All projections, valuations, and statistical analyses are provided to assist the recipient in the evaluation of the matters described herein. Such projections, valuations and analyses may be based on subjective assessments and assumptions and may use one among many alternative methodologies that produce different results accordingly, such projections, valuations and statistical analyses should not be viewed as facts and should not be relied upon as an accurate prediction of future events. There is no guarantee that any targeted performance will be achieved Commodity trading involves substantial risk of loss and may not be suitable for everyone
TTU is not and does not purport to be an advisor as to legal, taxation, accounting, financial or regulatory matters in any jurisdiction. The recipient should independently evaluate and judge the matters referred to herein. TTU does not provide advice or recommendations regarding an investor’s decision to allocate to funds or accounts managed by any manager (“or to maintain or sell investments in funds or accounts managed by any manager, and no fiduciary relationship under ERISA is created by the investor investing in funds or accounts managed by any manager, or through any communication between TTU and the investor
In reviewing this document, it should be understood that the past performance results of any asset class, or any investment or trading program set forth herein, are not necessarily indicative of any future results that may be achieved in connection with any transaction. Any persons subscribing for an investment must be able to bear the risks involved and must meet the suitability requirements relating to such investment. Some or all alternative investment programs discussed herein may not be suitable for certain investors This document is directed only to persons having professional experience in matters relating to investments. Any investment or investment activity to which this document relates is available only to such investment professionals. Persons who do not have professional experience in matters relating to investments should not rely upon this document.
This document and its contents are proprietary information of TTU and may not be reproduced or otherwise disseminated in whole or in part without TTU’s prior written consent.
This document contains simulated or hypothetical performance results that have certain inherent limitations AND SHOULD BE VIEWED FOR ILLUSTRATIVE PURPOSES. Unlike the results shown in an actual performance record, these results do not represent actual trading. HYPOTHETICAL PERFORMANCE RESULTS HAVE MANY INHERENT LIMITATIONS, SOME OF WHICH ARE DESCRIBED BELOW. NO REPRESENTATION IS BEING MADE THAT ANY ACCOUNT WILL OR IS LIKELY TO ACHIEVE PROFITS OR LOSSES SIMILAR TO THOSE SHOWN IN FACT, THERE ARE FREQUENTLY SHARP DIFFERENCES BETWEEN HYPOTHETICAL PERFORMANCE RESULTS AND THE ACTUAL RESULTS SUBSEQUENTLY ACHIEVED BY ANY PARTICULAR INVESTMENT ACCOUNT.
ONE OF THE LIMITATIONS OF HYPOTHETICAL PERFORMANCE RESULTS IS THAT THEY ARE GENERALLY PREPARED WITH THE BENEFIT OF HINDSIGHT IN ADDITION, HYPOTHETICAL TRADING DOES NOT INVOLVE FINANCIAL RISK, AND NO HYPOTHETICAL TRADING RECORD CAN COMPLETELY ACCOUNT FOR THE IMPACT OF FINANCIAL RISK IN ACTUAL TRADING FOR EXAMPLE, THE ABILITY TO WITHSTAND LOSSES OR TO ADHERE TO A PARTICULAR TRADING PROGRAM OR OTHER ASSET. There are numerous other factors related to the markets in general or to the implementation of any specific trading program which cannot be fully accounted for in the preparation of hypothetical performance results and all of which can adversely affect actual trading results. No representation is being made that any investment will or is likely to achieve profits or losses similar to those being shown.
Most Comprehensive Guide to the Best Investment Books of All Time

Most Comprehensive Guide to the Best Investment Books of All Time
Get the most comprehensive guide to over 600 of the BEST investment books, with insights, and learn from some of the wisest and most accomplished investors in the world. A collection of MUST READ books carefully selected for you. Get it now absolutely FREE!
Get Your FREE Guide HERE!