

“The Shock That Reversed Everything”
This Week in Trend – 10 October 2025
Welcome to This Week in Trend, your lens into the shifting dynamics of global futures markets and the evolving landscape of systematic trend following.
For most of the week, markets drifted quietly higher. Then Friday arrived.
In a single session, President Trump’s surprise tariff escalation on Chinese imports detonated across global markets – unwinding an entire week of positioning and sending volatility through the roof.
The result was a synchronized reversal: equities collapsed, crypto plunged, metals fractured, and volatility exploded. For systematic traders, it was one of those rare sessions where everything moved -together and fast.
SG Trend Index Performance
- Month-to-date (as of Oct 10): +2.53%
- Year-to-date: +0.21%
(Previous week: +0.58% MTD | -1.94% YTD)
The SG Trend Index held modestly positive despite the turmoil, reflecting gains earlier in the week from long bond and precious metal exposures that offset losses in equities, energy, and crypto.
Systems were generally caught mid-trend – leaning long risk into a sharp reversal. The volatility spike compressed recent gains but didn’t dismantle the broader positive momentum evident since mid-September.
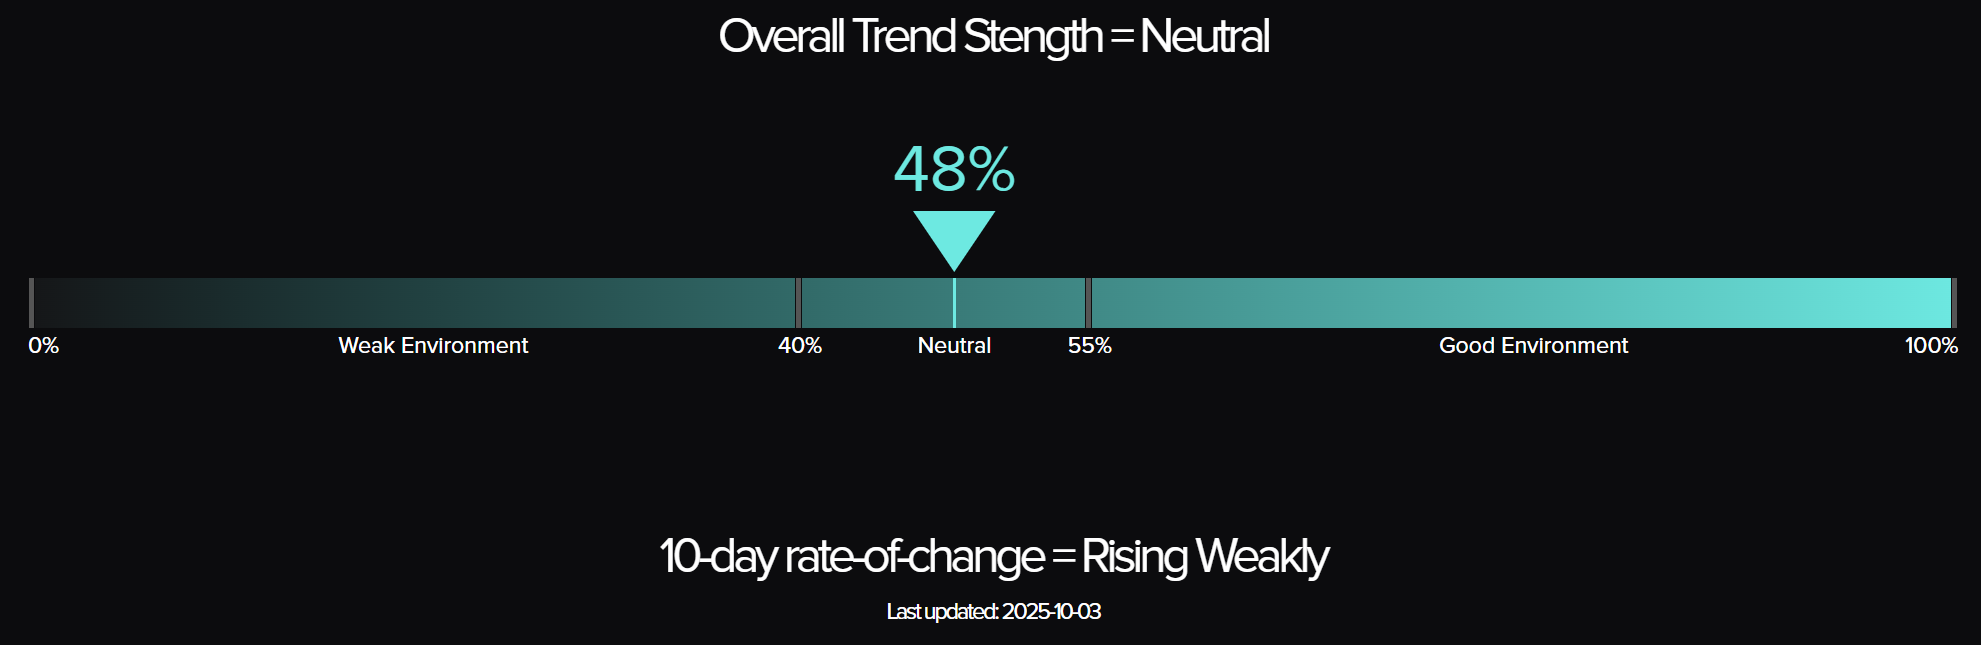
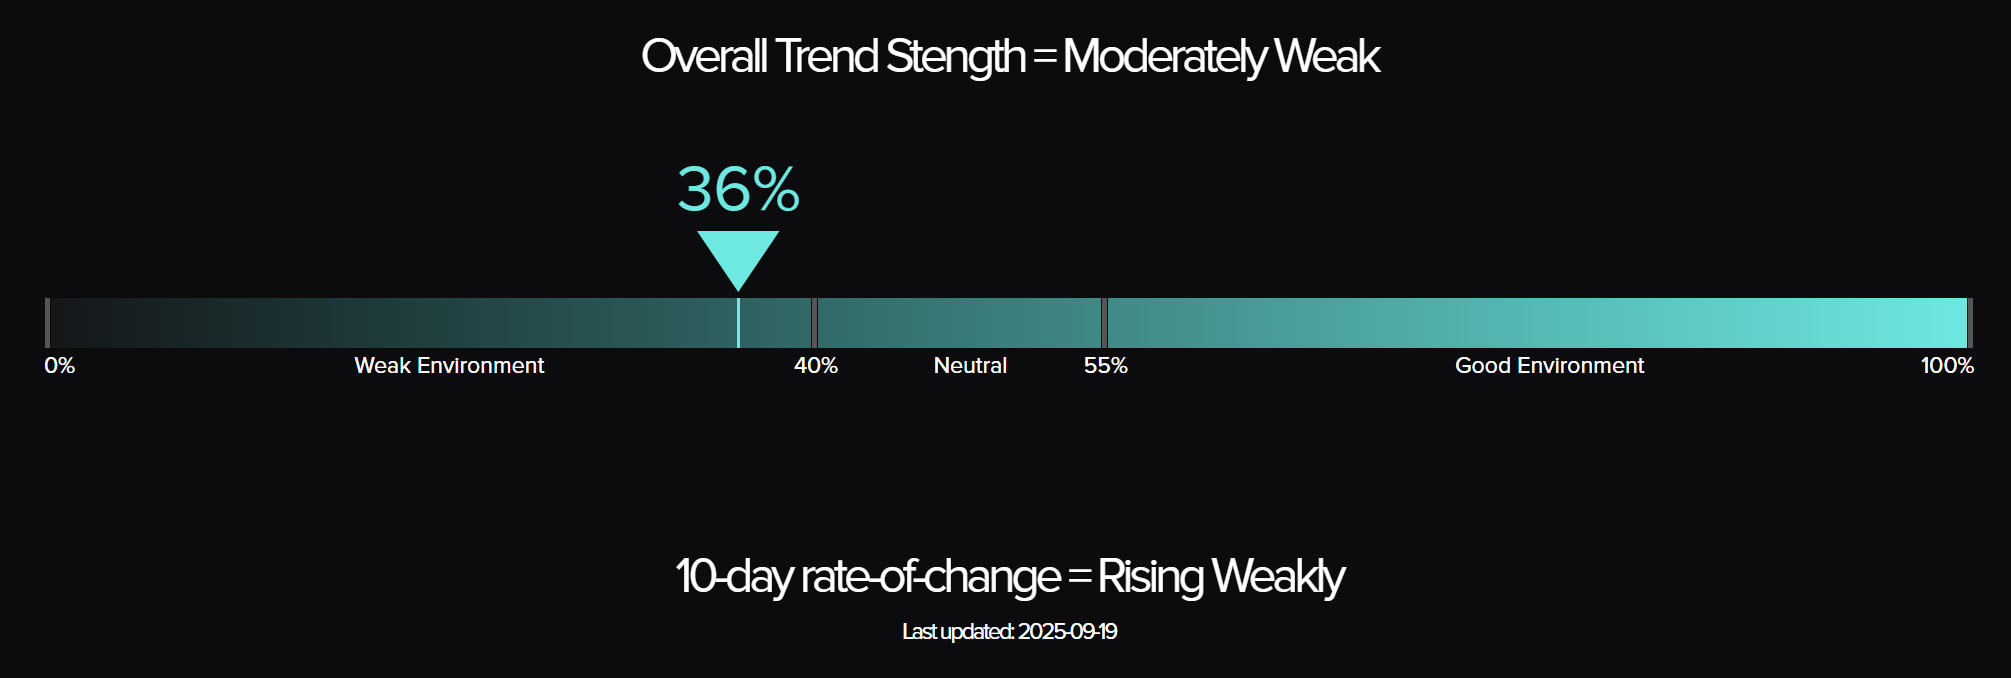
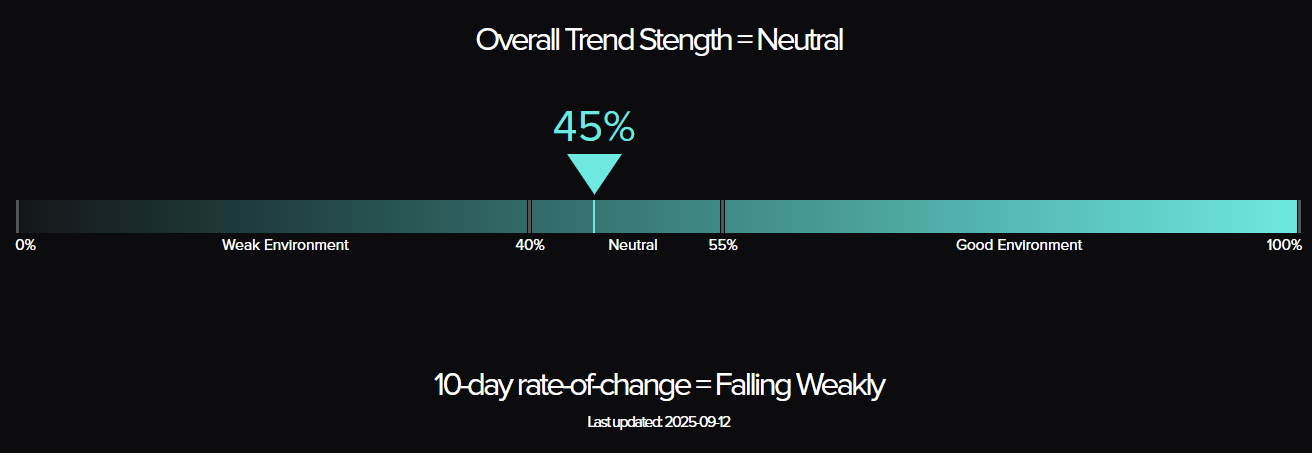
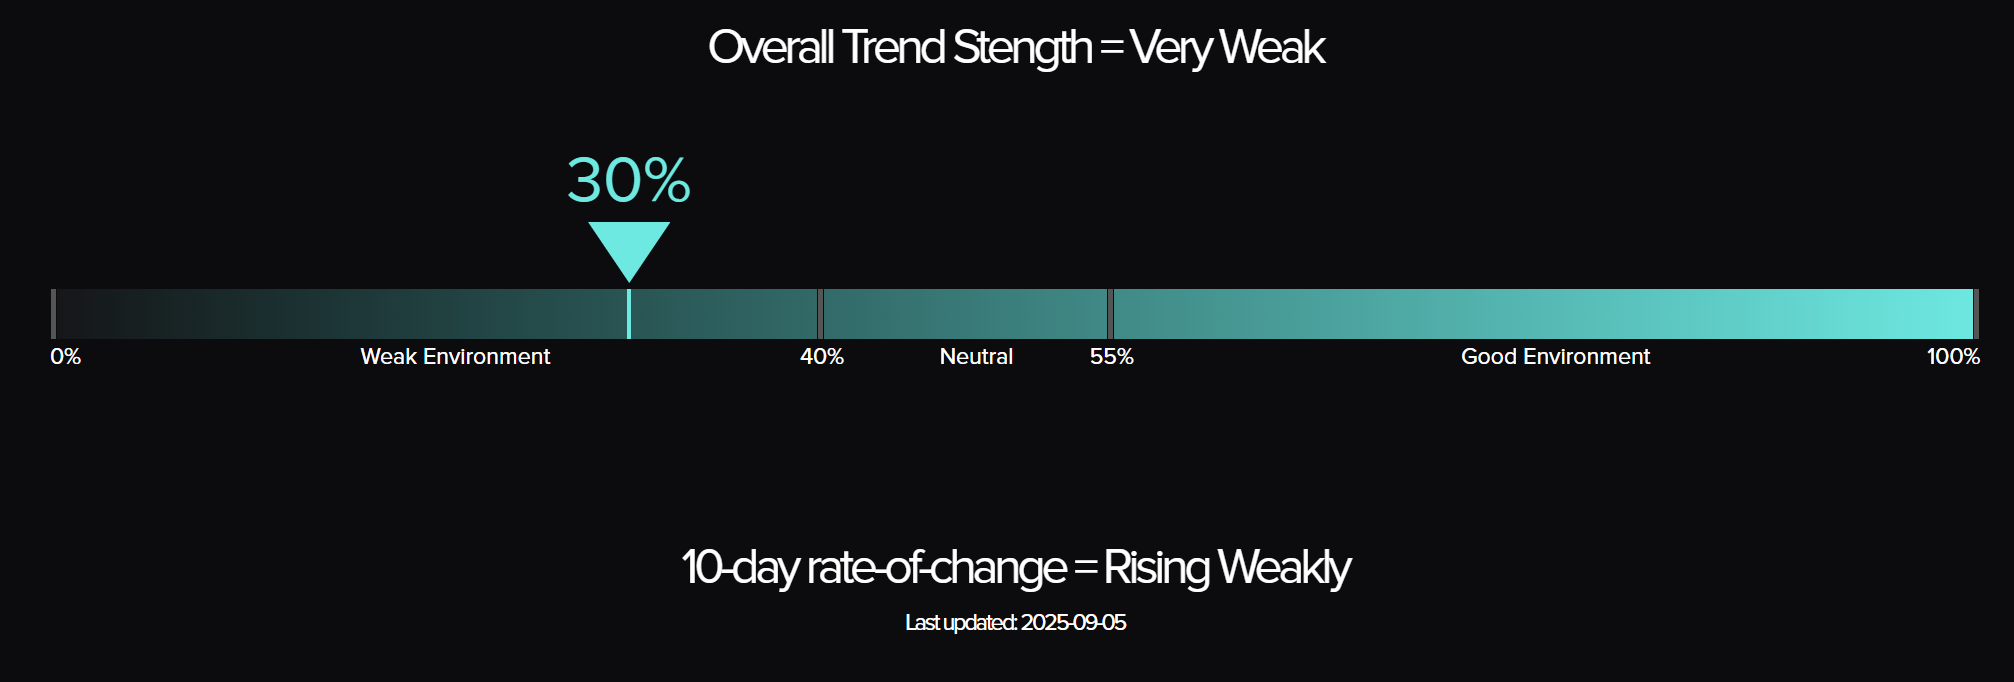
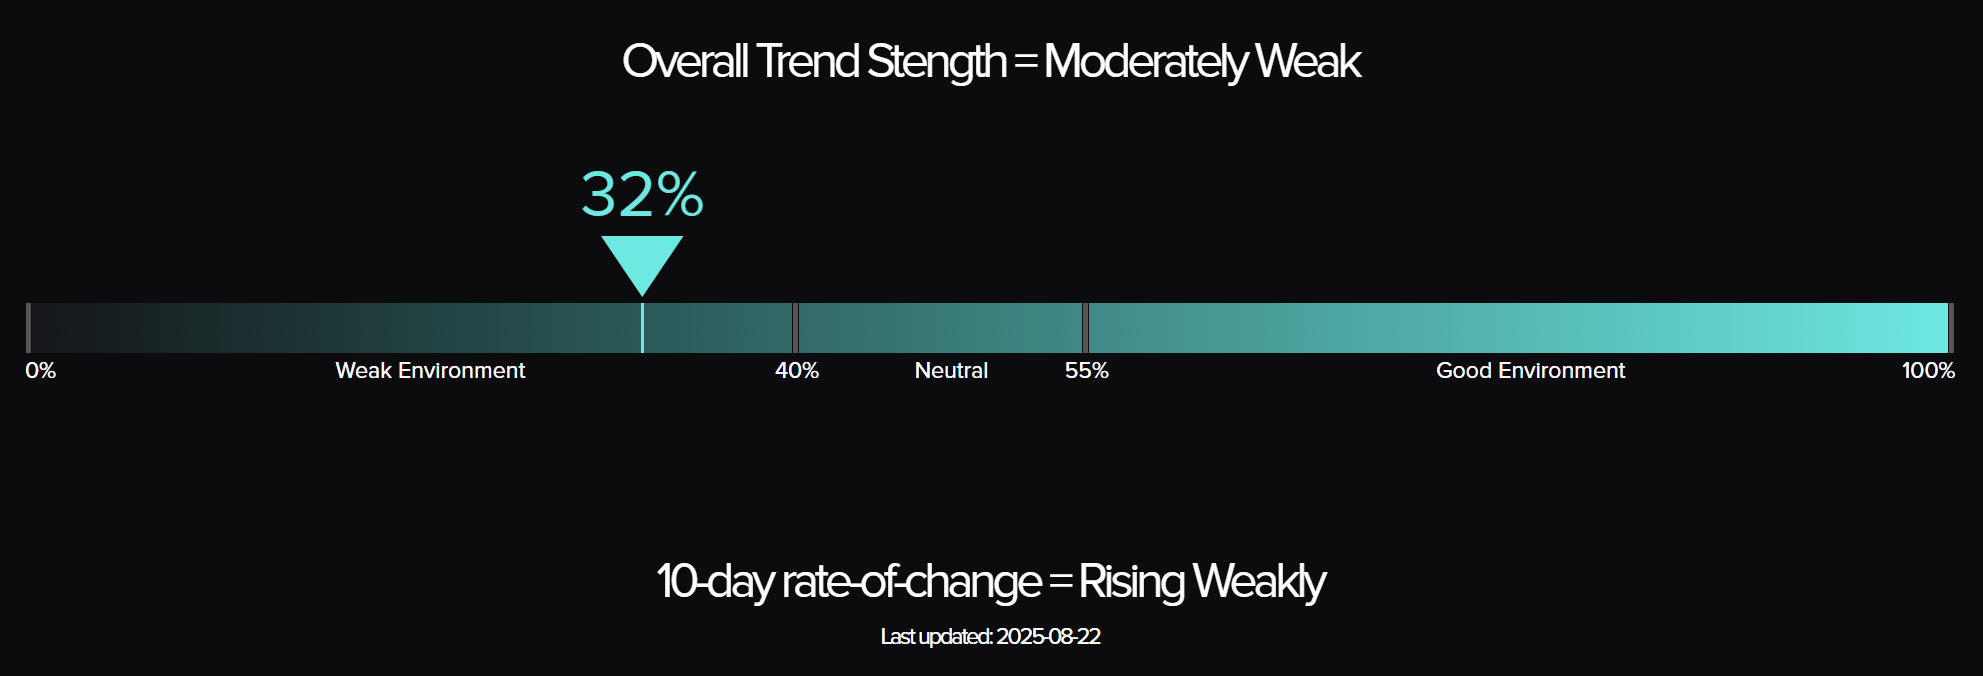
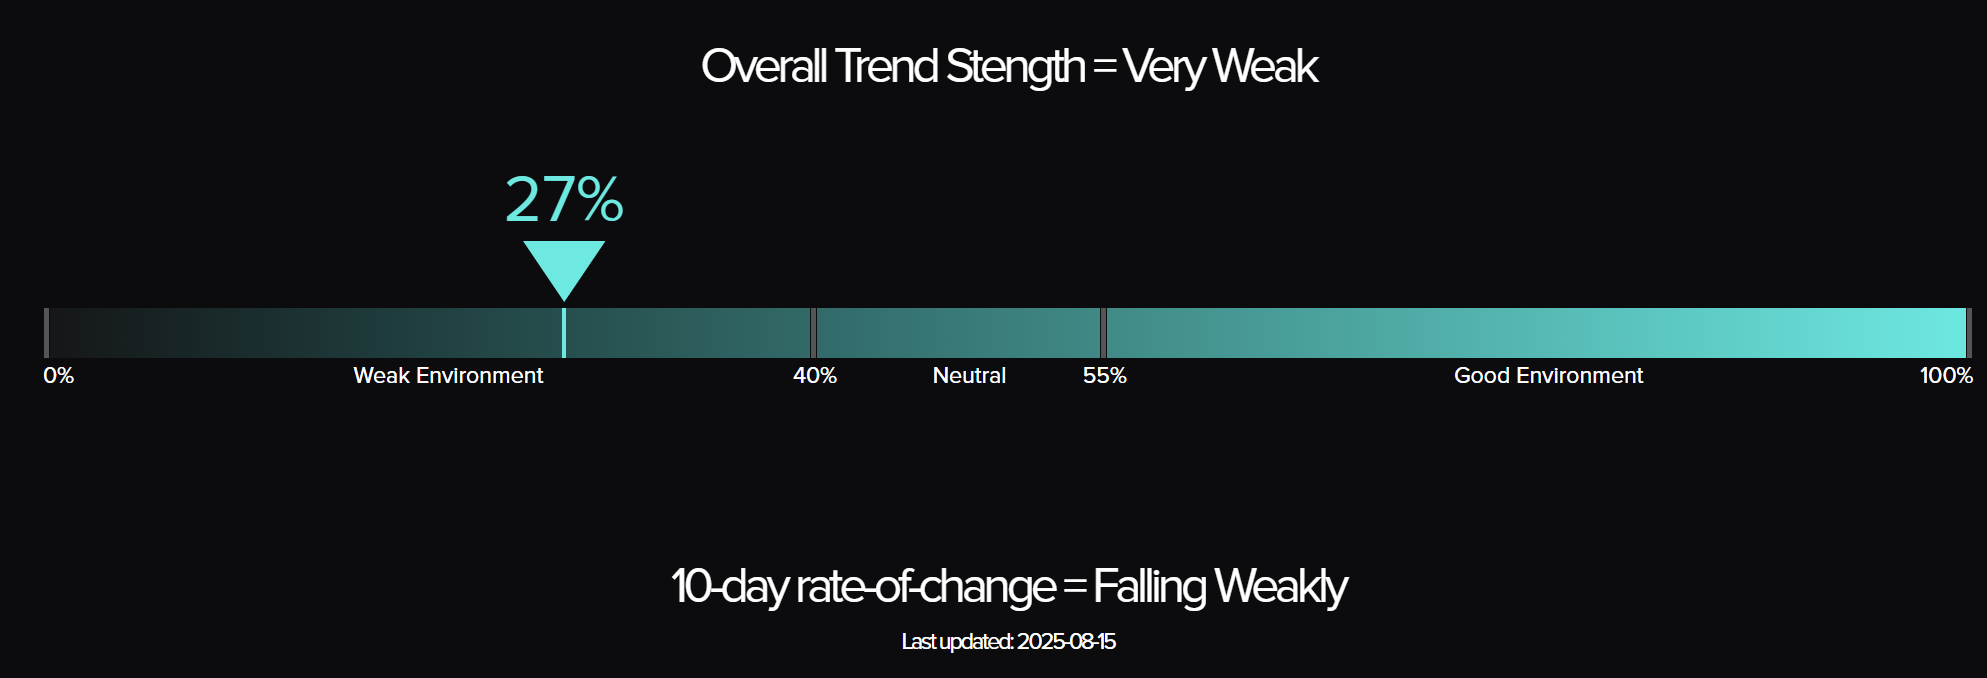
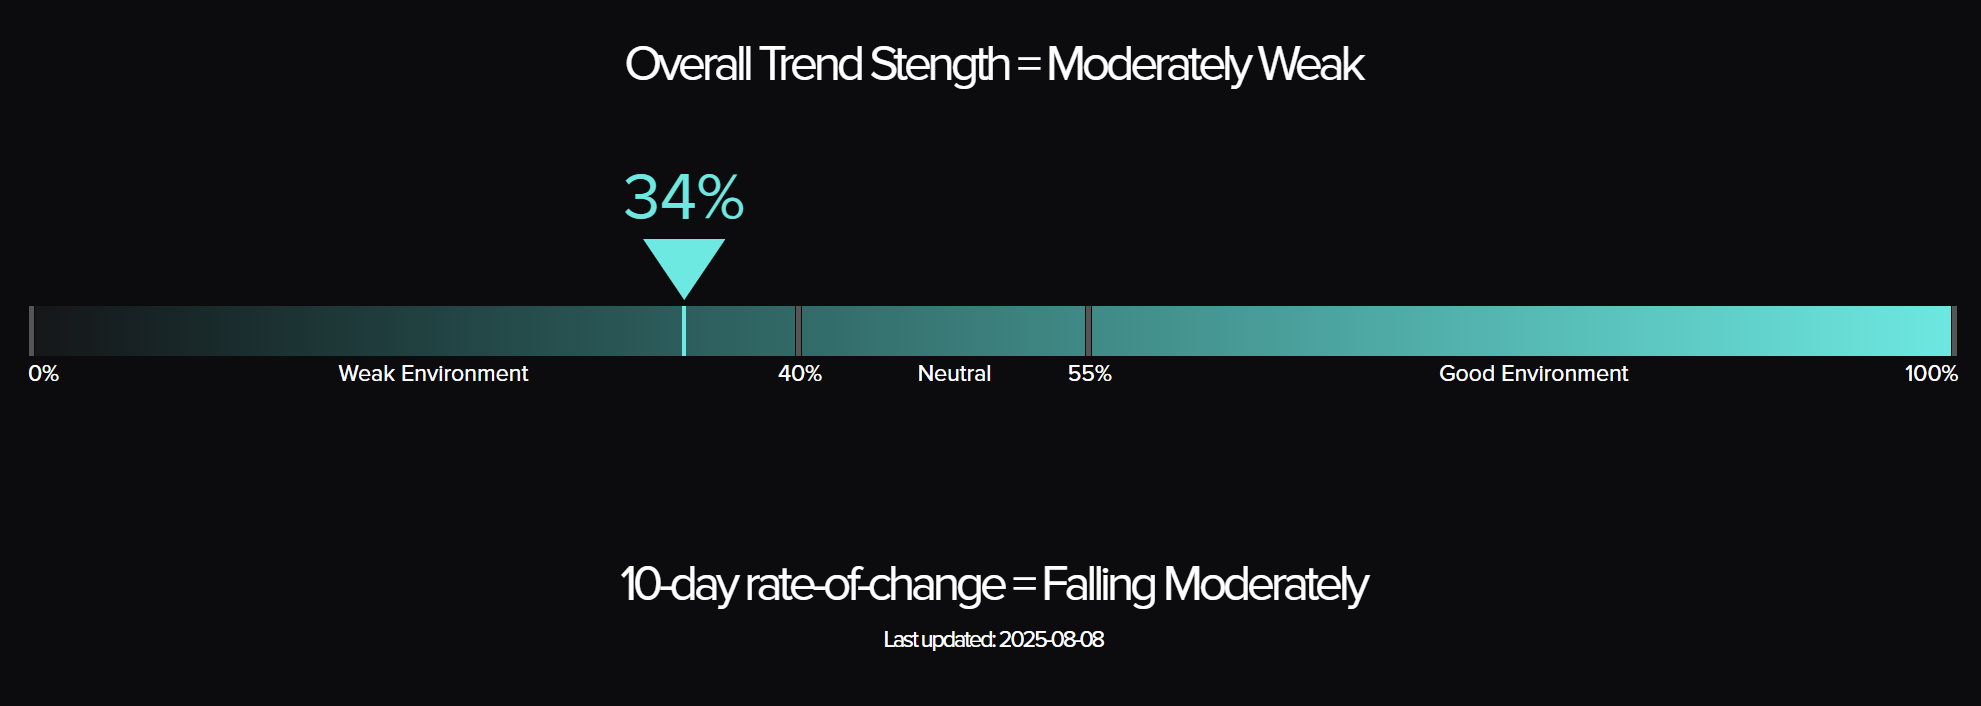
TTU Trend Barometer
- Current reading: 48 percent – Neutral
- Previous reading: 43 percent
- 10-day rate of change: Rising weakly
Trend conditions improved slightly into mid-week, with the barometer pushing closer to the “good environment” threshold. Friday’s event may shave some momentum into next week but the trend environment remains balanced—neither hot nor cold.
“A neutral barometer in a storm still measures motion—it just hides its direction.”
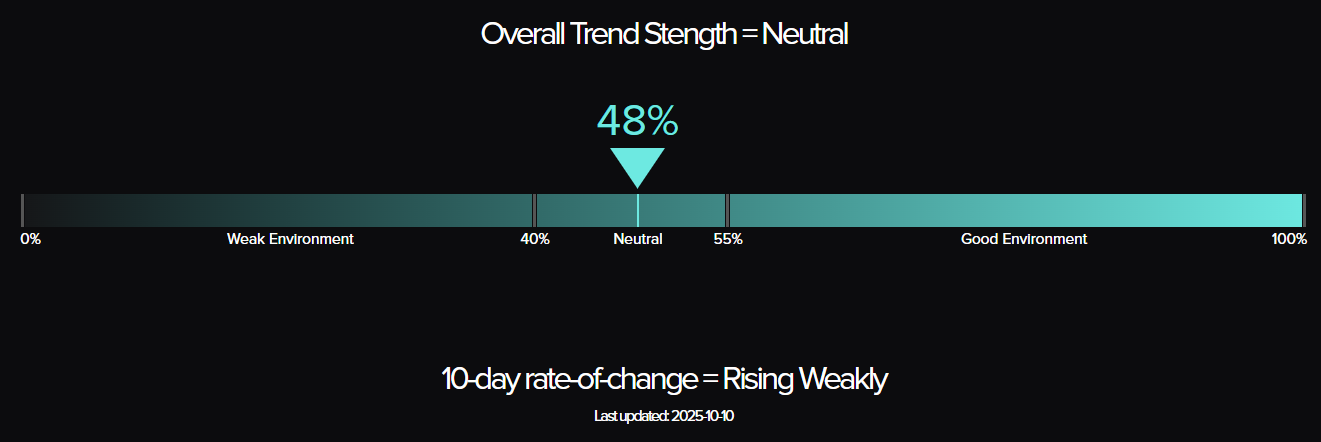
The Top Traders Unplugged (TTU) Trend Barometer is a proprietary tool that measures the percentage of markets with medium to strong trends. Similar to a thermometer, where 0 degrees Celsius equates to freezing, a TTU Trend Barometer reading below 40% indicates a “cold” environment for trend-following, while readings above 55% signal a “hotter,” more favourable trend environment.
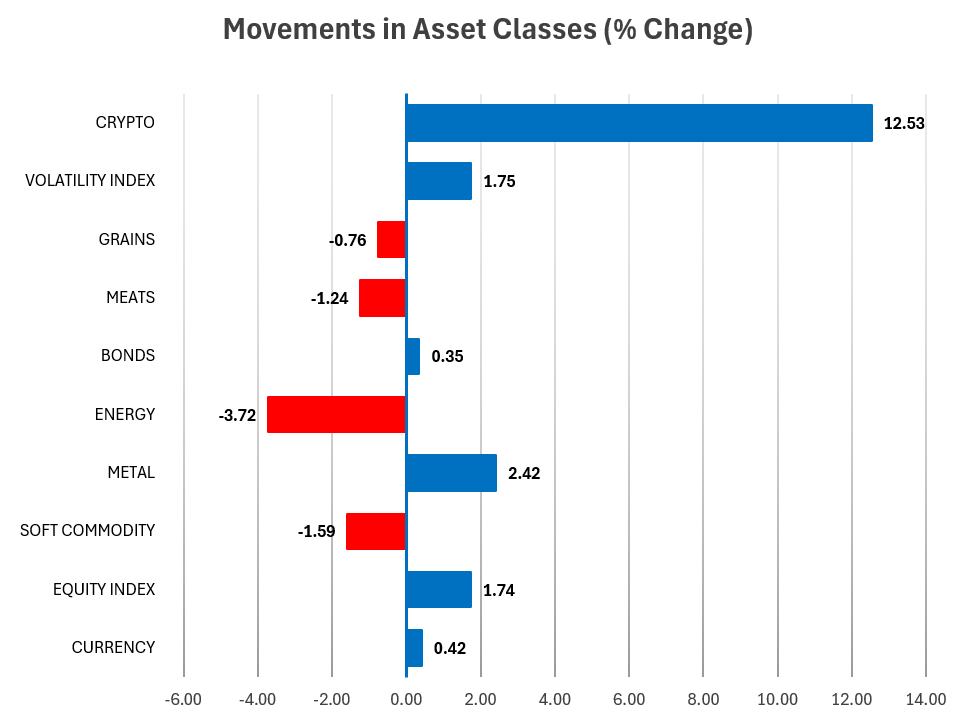
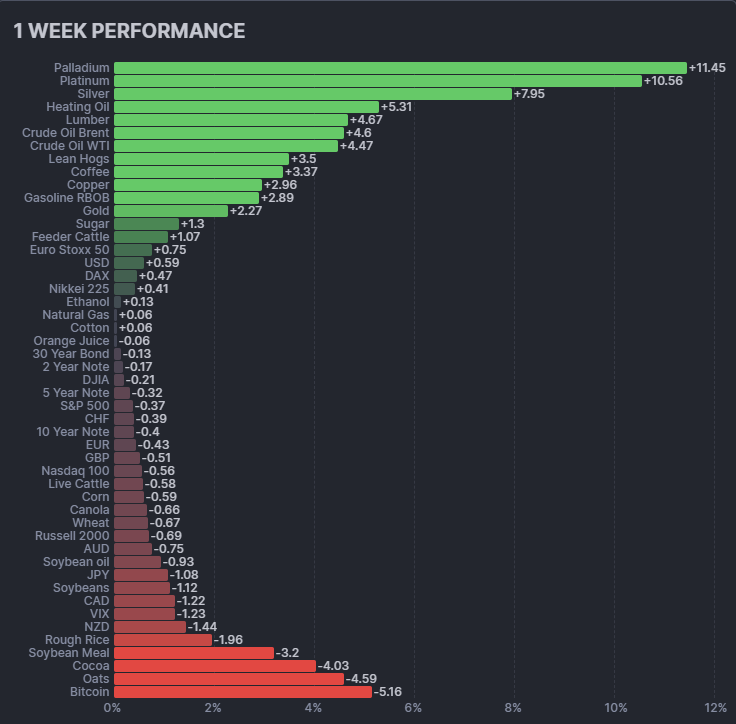
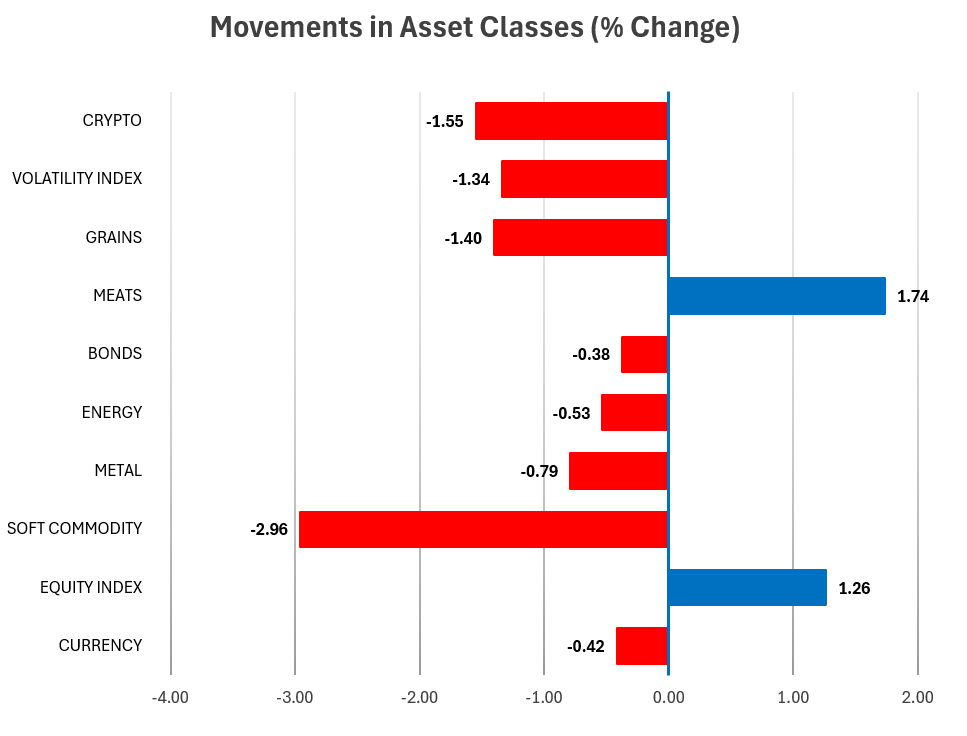
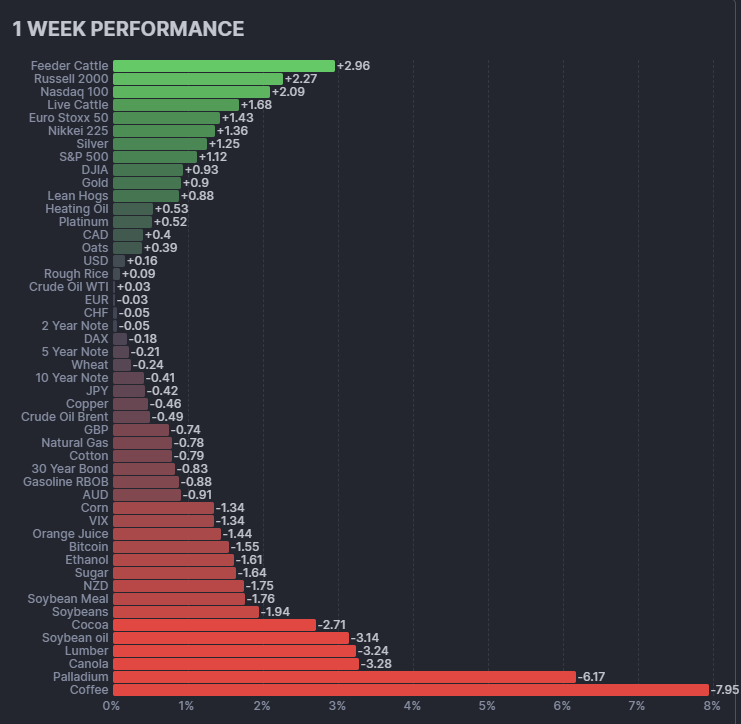
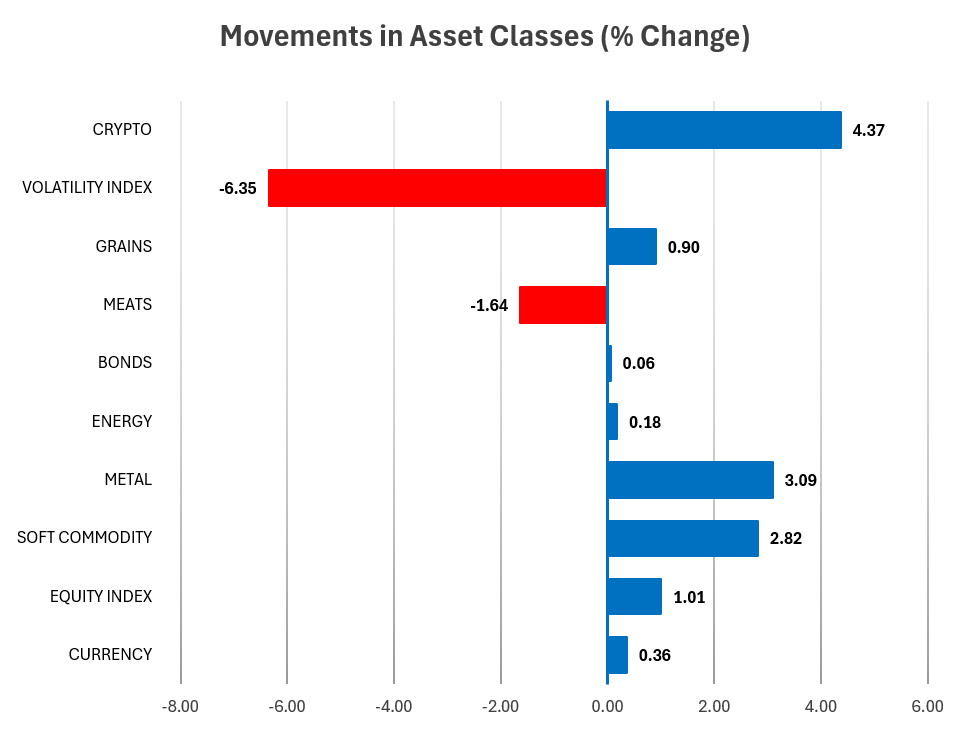
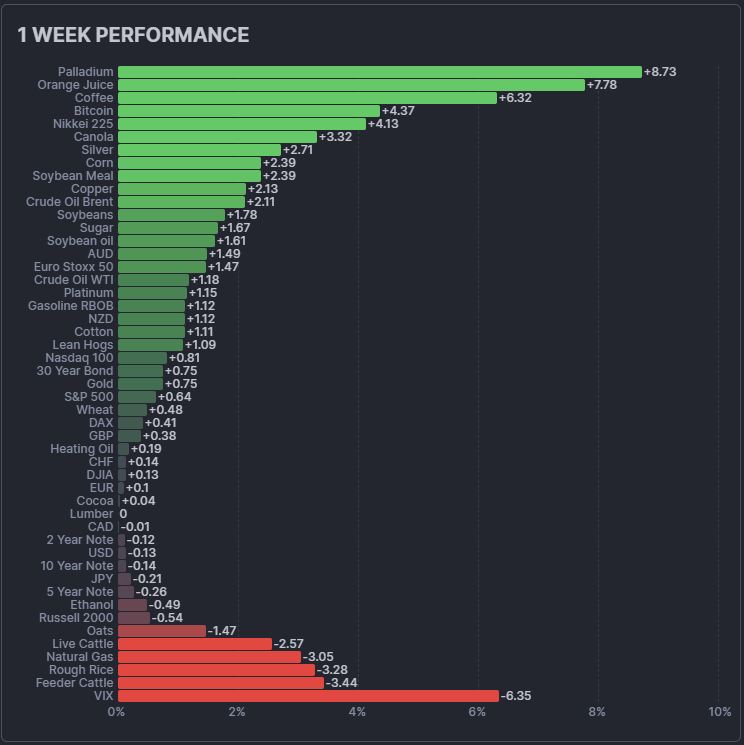
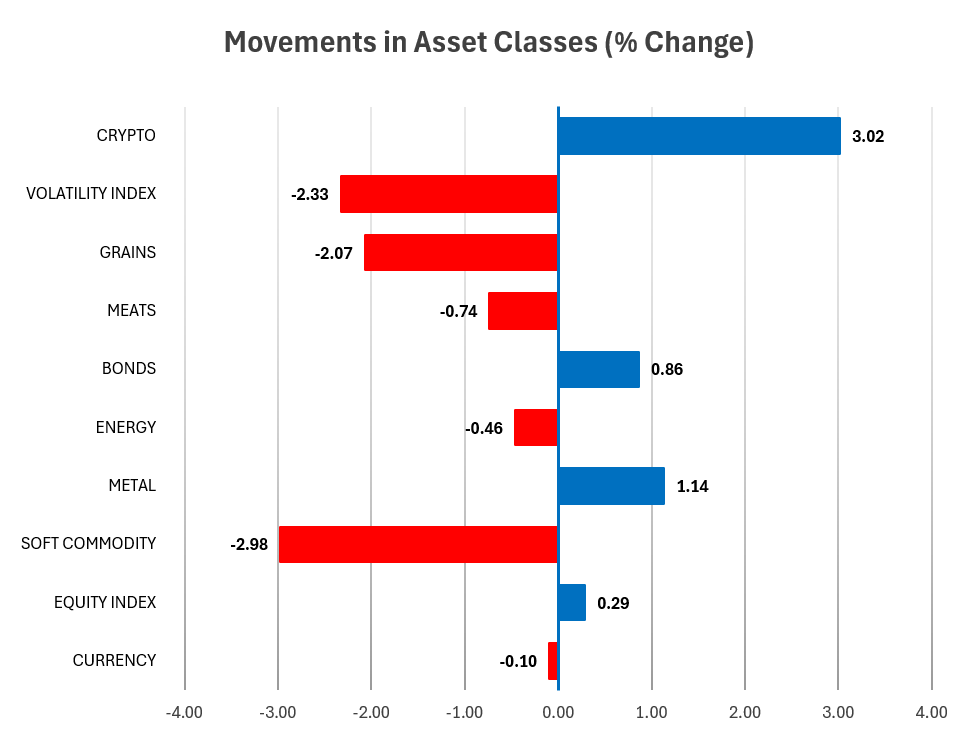
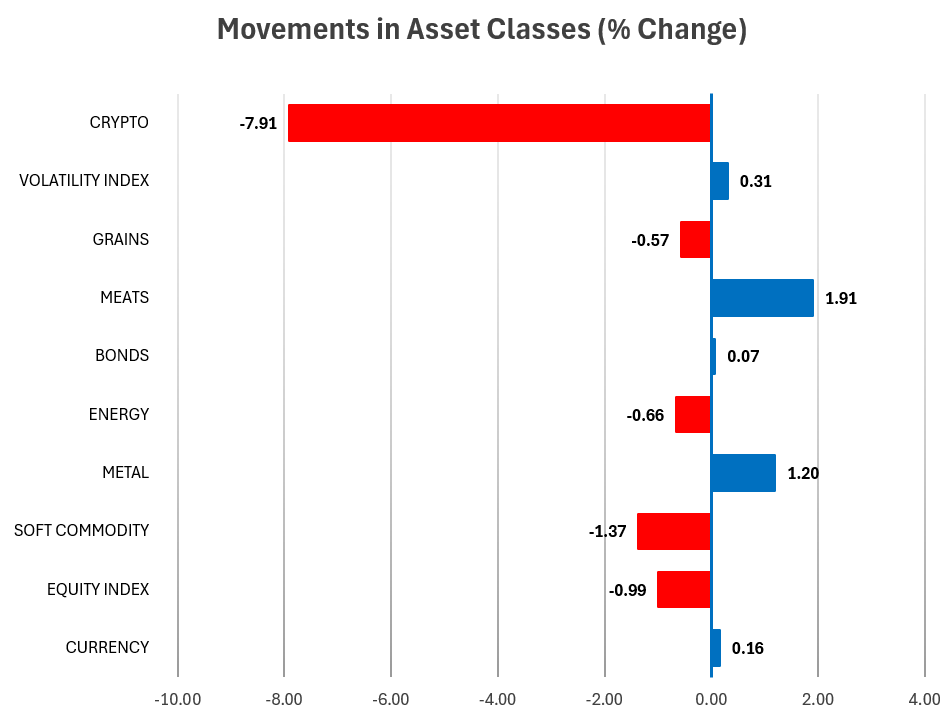
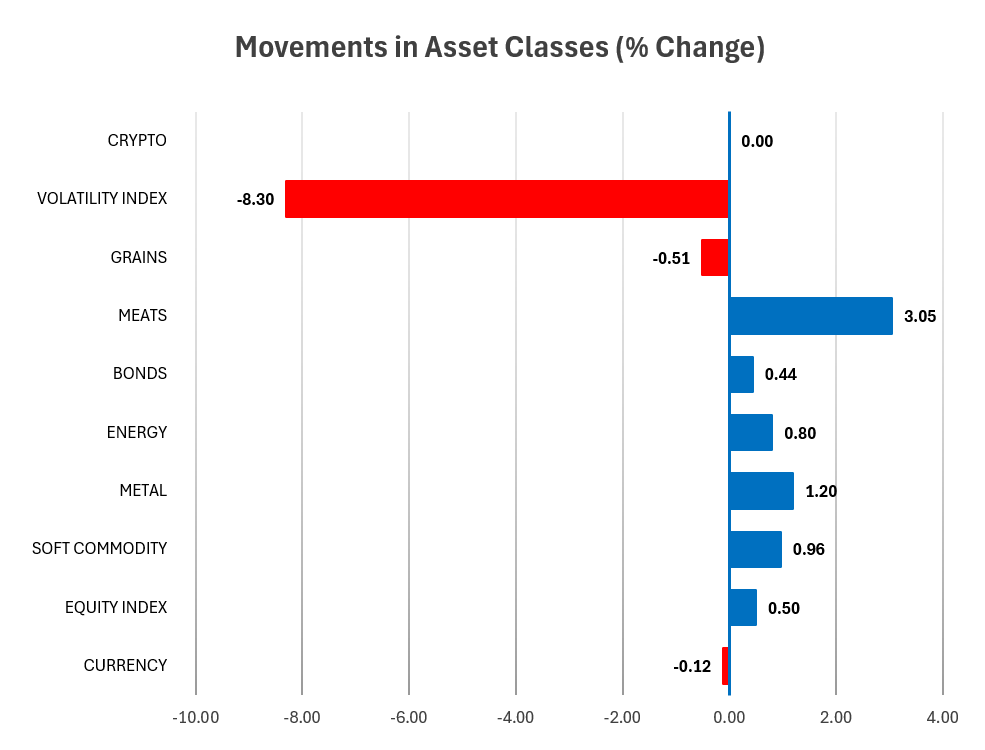
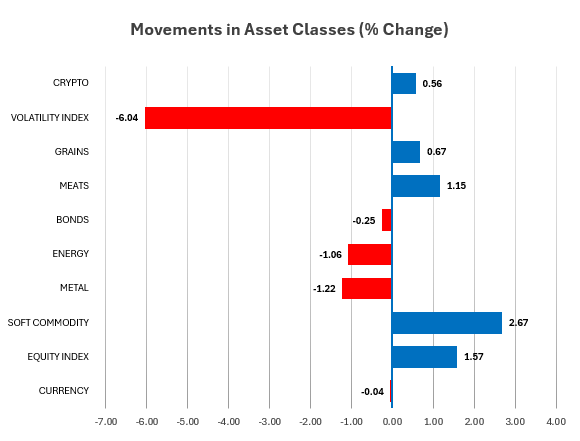
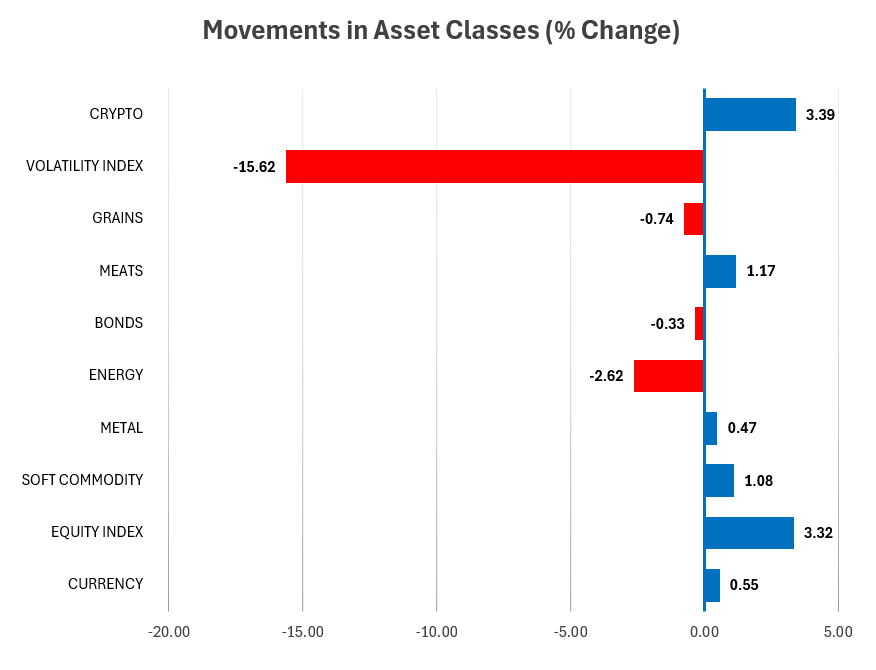
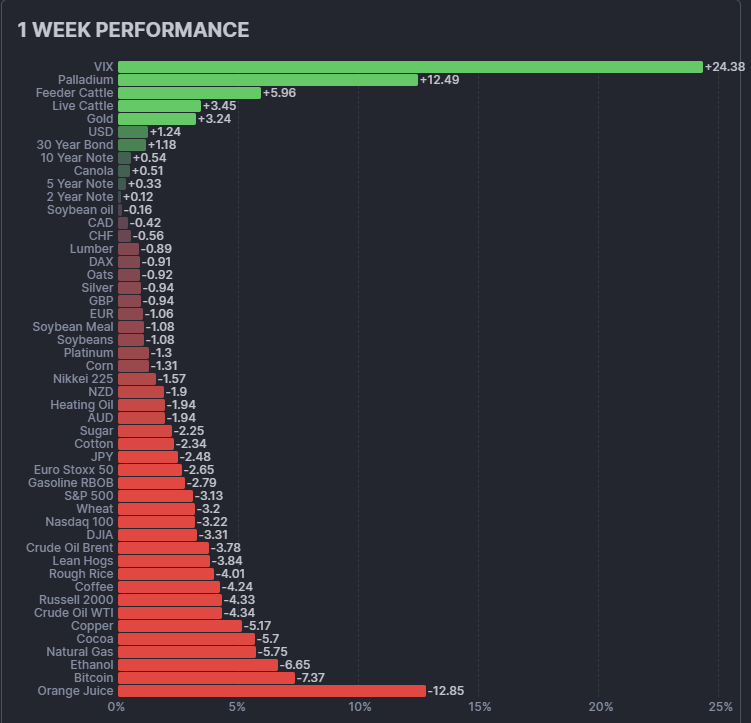
Weekly Asset Class Snapshot
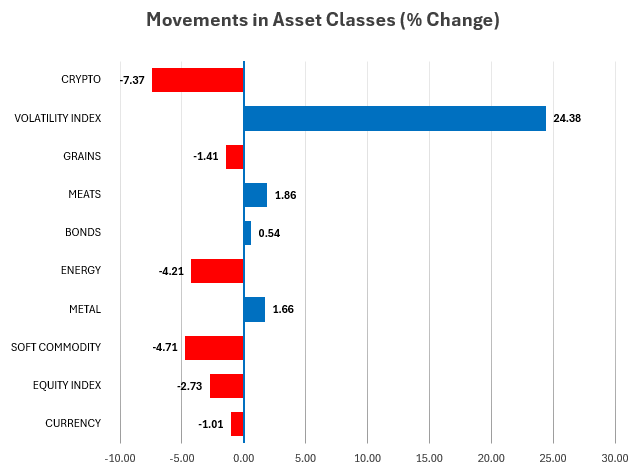
Source: Finwiz.com
- Volatility Index (+24.4% | prev +1.8%) – From calm to chaos. Friday’s tariff shock reignited volatility, reversing the prior week’s mild uptick and compressing a month’s complacency into a single day.
- Crypto (−7.4% | prev +12.5%) – From best to worst. Bitcoin’s 12.9% collapse erased last week’s surge, underscoring crypto’s high beta to global equity sentiment.
- Metals (+1.7% | prev +2.4%) – Modest gain, masking deep divergence. Gold and palladium climbed, while copper fell over 5%, a clear expression of growth anxiety.
- Energy (−4.2% | prev −3.7%) – Continued weakness. Oil and refined products extended losses for a second week, with natural gas joining the downside reversal.
- Softs (−4.7% | prev −1.6%) – Selling pressure intensified. Orange juice broke sharply, and cocoa’s correction steepened as speculative longs unwound.
- Equities (−2.7% | prev +1.7%) – Global equity reversal. The S&P 500 and Nasdaq logged their largest one-day falls since April, wiping out recent gains.
- Grains (−1.4% | prev −0.8%) – Still soft. Wheat and corn extended lower, but the pace of decline slowed relative to the prior week.
- Meats (+1.9% | prev −1.2%) – Turned higher. Cattle extended their long-running uptrend, one of few bright spots in an otherwise risk-off week.
- Bonds (+0.5% | prev +0.35%) – Supportive again. Long-duration exposure benefited from the flight to quality as yields fell across the curve.
- Currencies (−1.0% | prev +0.42%) – USD firmed sharply on risk aversion, reversing the prior week’s mild softness. AUD and NZD bore the brunt of commodity-linked selling.
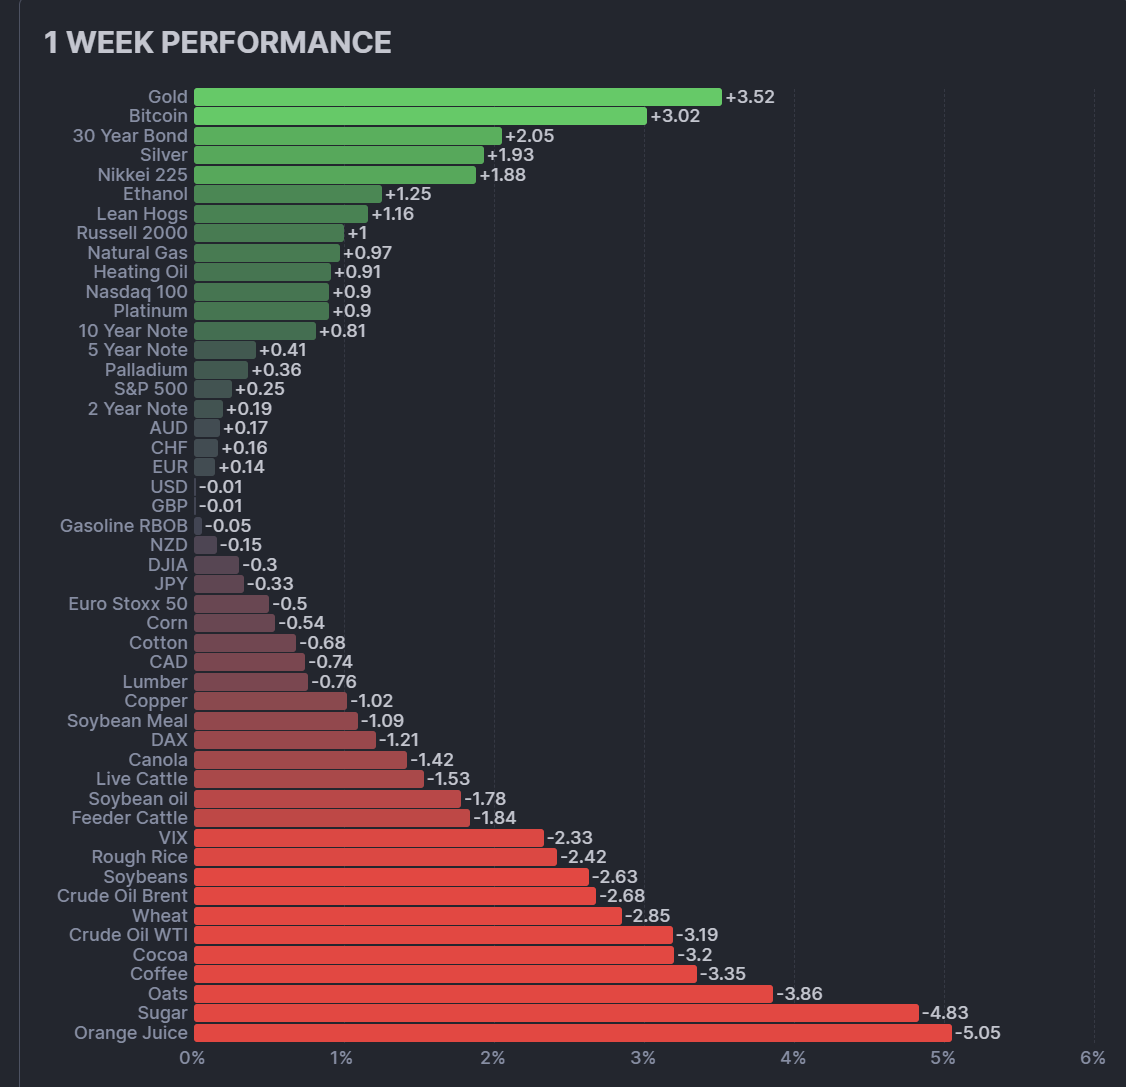
Volatility defined the week, but dispersion across asset classes remained wide. Here’s how leaders and laggards lined up.
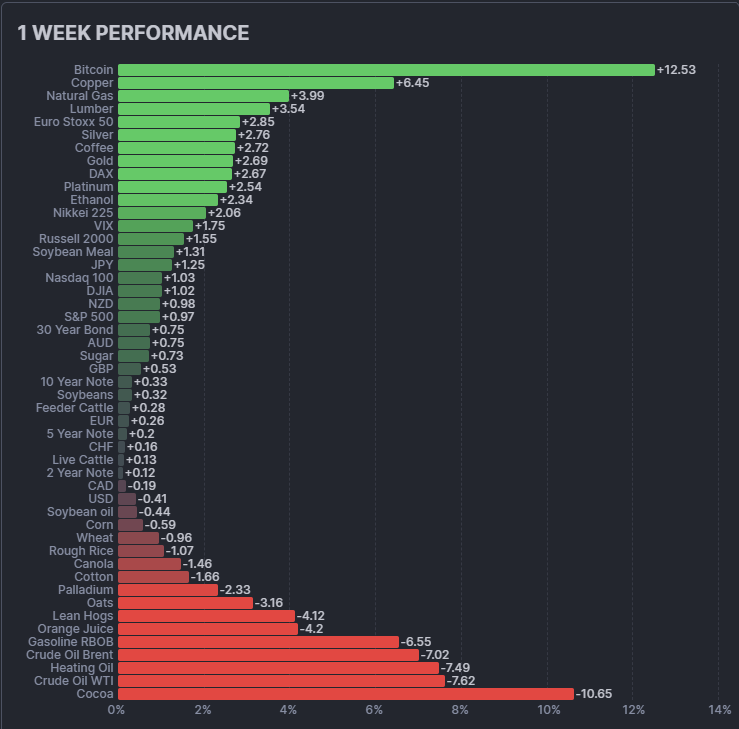
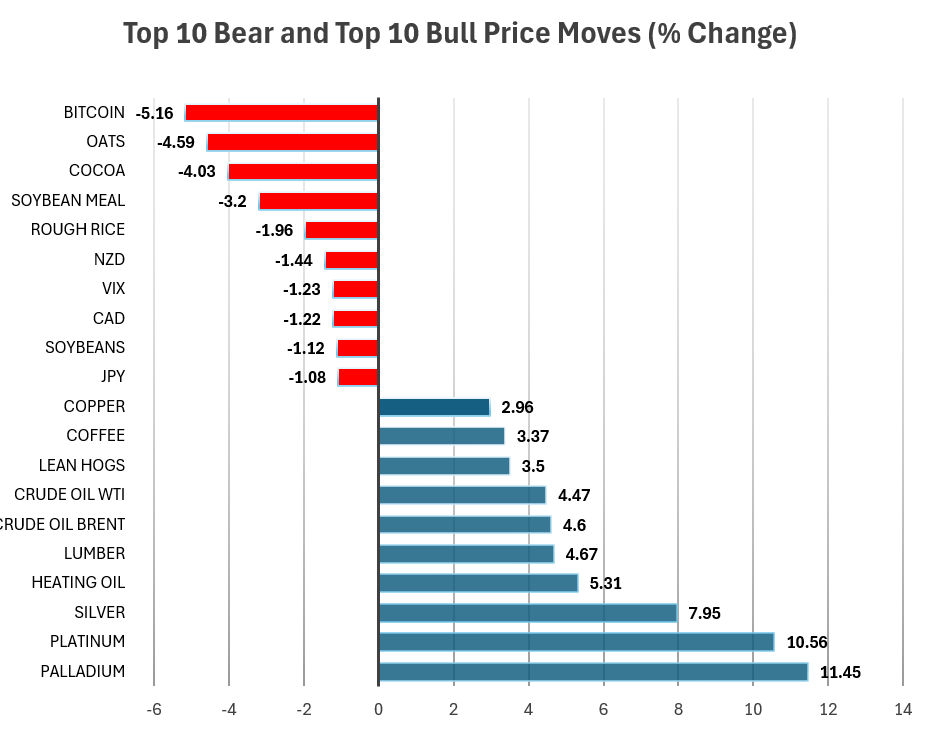
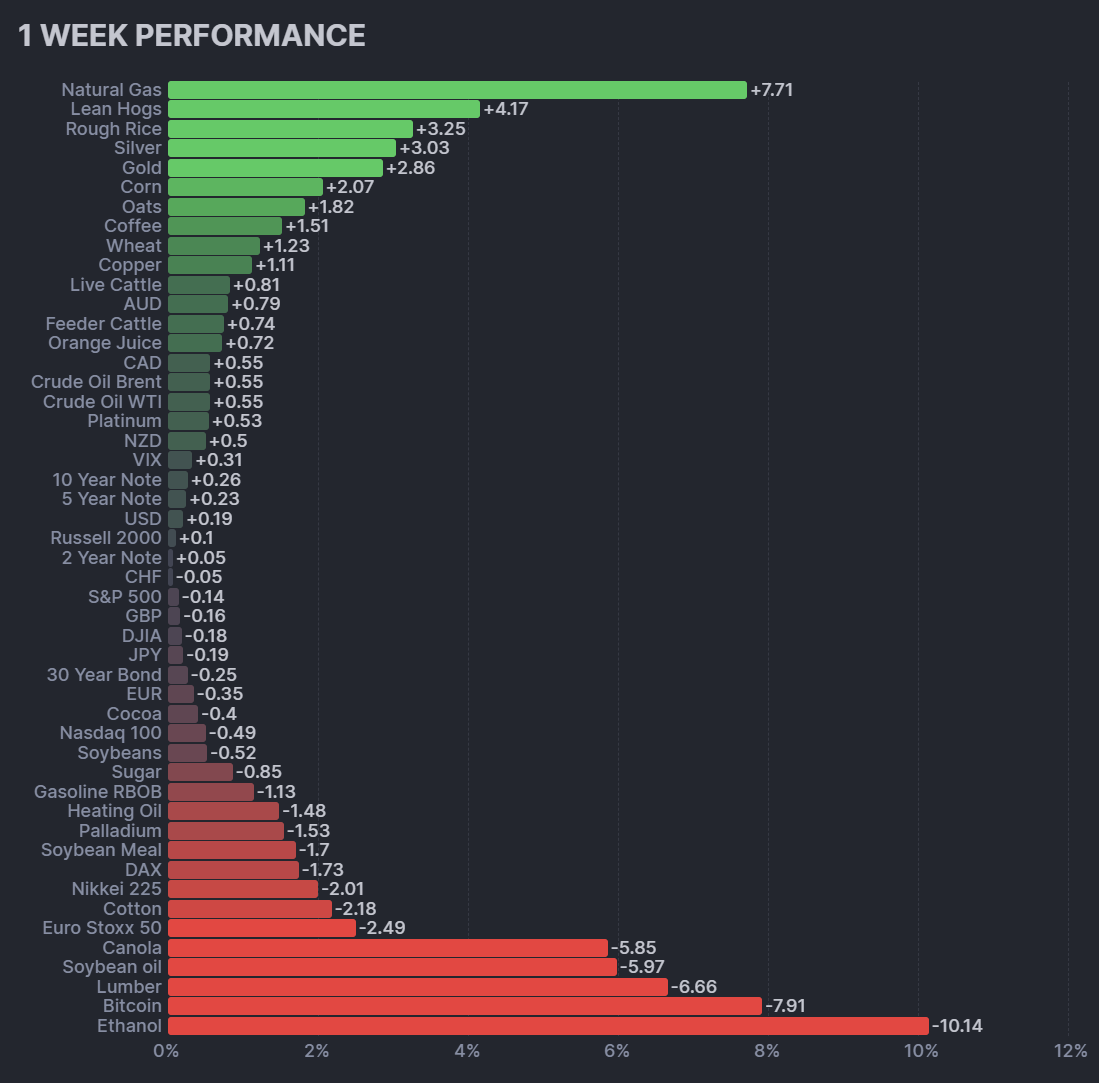
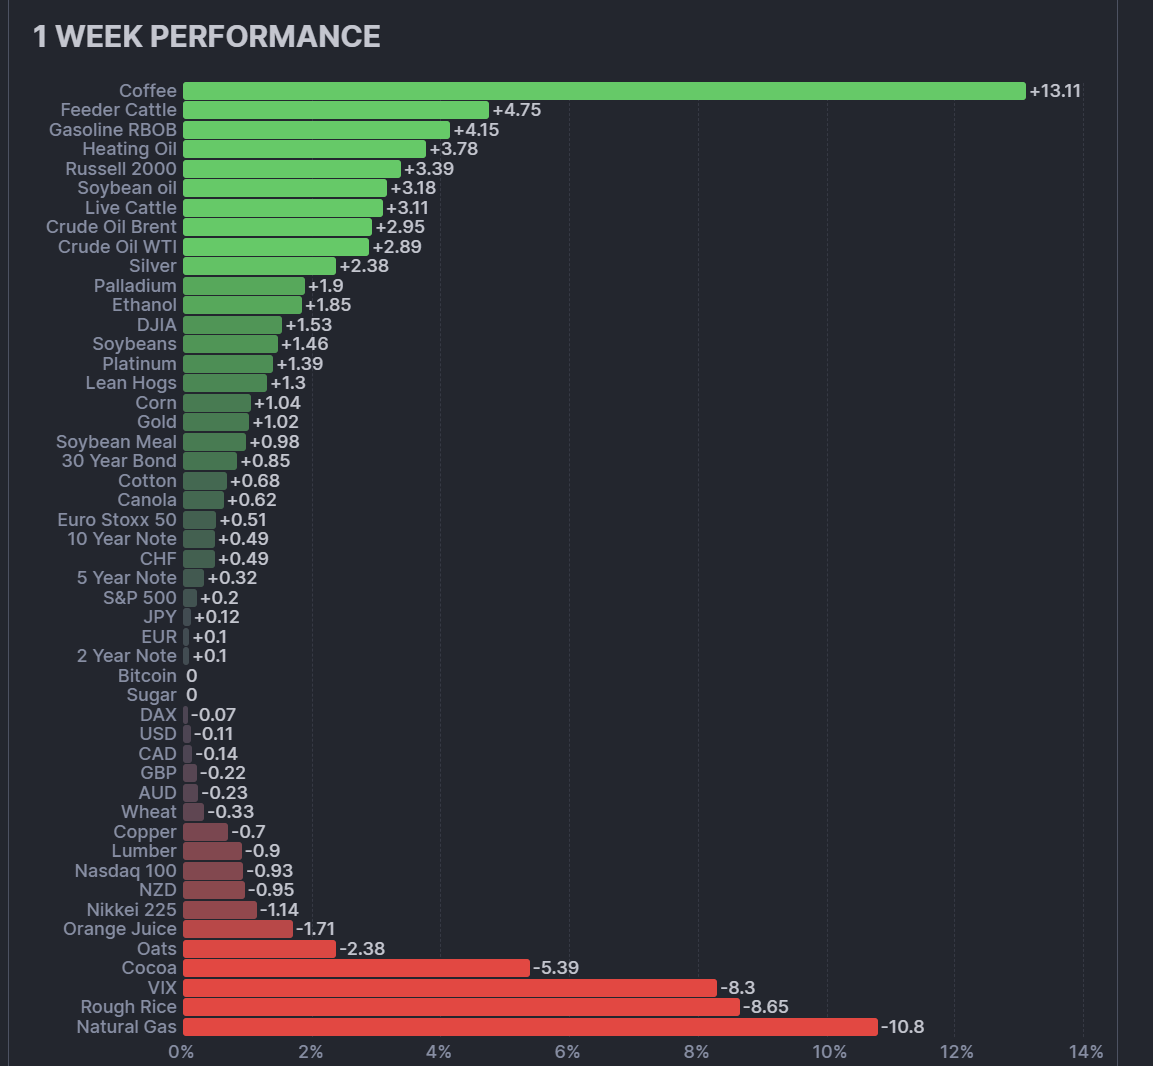
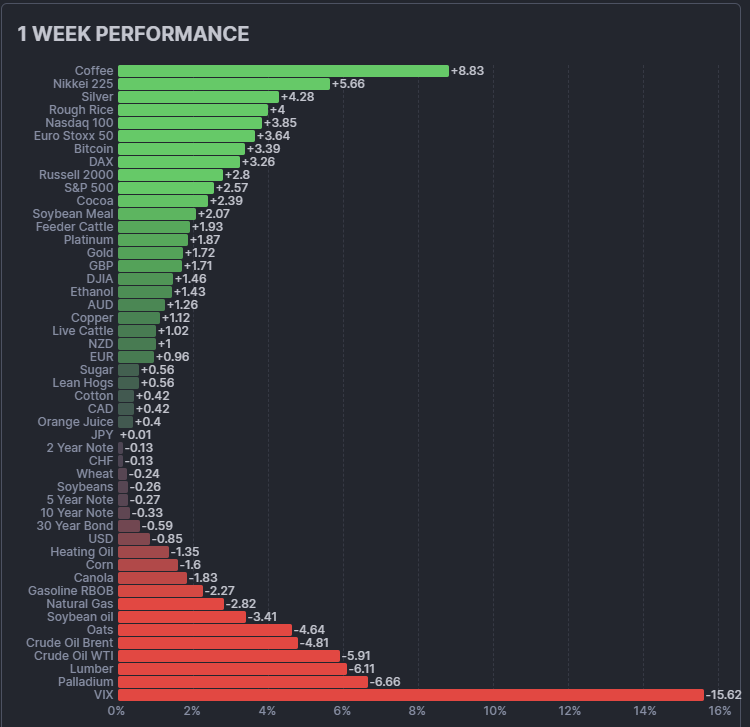
Performance Highlights – This Week’s Market Leaders & Laggards
Top Market Movers
Top Gainers
Palladium +12.5% – Safe haven with industrial teeth
Palladium soared on short-covering and renewed defensive rotation. The metal’s dual nature – precious yet industrial – made it an unlikely beneficiary of the tariff turmoil. As copper and equities sank, capital sought refuge in metals with constrained supply and lower correlation. The rally reinforced palladium’s status as one of the most volatile yet resilient trend assets in the current regime.
Gold +1.6% – The old refuge reasserts itself
Gold extended its steady climb, attracting inflows from equity and crypto liquidations. The tariff shock reignited safe-haven demand, pushing prices toward three-month highs. Systematic long positions in gold continued to provide valuable portfolio ballast, offsetting losses elsewhere.
U.S. 30-Year Treasury +1.45% – Convexity delivered
Long-duration bonds rallied sharply as investors rotated into safety. The move completed a clean inverse correlation with equities and validated their risk-buffer role in diversified trend portfolios. Duration remains one of the few consistent trend engines amid macro uncertainty.
Live Cattle +1.1% – Quiet strength amid chaos
Cattle prices extended their smooth uptrend, a study in persistence during market disorder. Uncorrelated demand dynamics and disciplined supply management continue to provide one of the few steady positive trends across the commodity complex.
Japanese Yen +1.3% – Classic risk-off response
The yen strengthened against the dollar as traders unwound carry exposure and rotated into traditional safe havens. While currencies overall remain low-volatility, the JPY’s role as a crisis barometer remains intact.
Top Losers
Bitcoin −12.9% – From darling to drag
Bitcoin’s collapse epitomized Friday’s panic. After weeks of optimism, the market reversed violently on liquidation flows, erasing nearly all October gains in one session. The selloff underscored crypto’s alignment with broader risk appetite and its failure to decouple during global shocks.
Copper −5.4% – Growth proxy turned casualty
Copper’s reversal was swift and brutal. Once supported by infrastructure optimism, the metal fell on renewed concerns about global trade disruption and industrial demand. The move highlights copper’s sensitivity to geopolitical shocks and its tendency to exaggerate equity weakness.
WTI −5.3% / Brent −4.8% / Nat Gas −4.1% – Energy’s synchronized collapse
The energy complex broke decisively lower, aligning with risk aversion across markets. OPEC+ production guidance and China’s slowdown fears compounded the pressure. For systematic traders, the week demonstrated how quickly energy leadership can reverse when macro tone shifts.
Orange Juice −12.8% – The parabola breaks
After months of vertical gains, orange juice finally snapped. Easing weather risks, improved harvest forecasts, and position liquidation sent prices tumbling. The move exemplifies the volatility inherent in thinly traded softs after extended one-way runs.
Cocoa −5.7% – Mean reversion deepens
Cocoa continued its drawdown from recent highs as supply normalization in West Africa and weaker global grindings drove liquidation. The correction, while painful, restores balance to what had become one of the most crowded trades in the softs complex.
Portfolio View – Positioning and Impact
Diversified trend portfolios likely ended the week modestly lower but structurally intact.
Equities
Friday’s tariff shock triggered widespread stop-outs across equity markets. U.S. indices reversed sharply, while Japan and Europe – previously leaders – succumbed to synchronized liquidation. For trend models, prior long exposure likely shrank as trailing stops engaged. Equity risk has now transitioned from growth participation to capital preservation mode, with managers waiting for post-shock stabilization before reloading.
Metals
The metals sleeve was divided. Gold and palladium extended higher, acting as classic volatility hedges, while copper’s 5% collapse reversed weeks of gradual accumulation. Systematic portfolios remain structurally overweight metals given their cross-asset resilience, but intra-sector dispersion – safe-haven vs. cyclical – remains elevated. Expect reduced position sizing until direction normalizes.
Energy
Energies flipped from contributor to detractor. The breakdown across crude, heating oil, and gasoline reversed previous long signals, forcing systems to trim or flip outright. Trend followers that had relied on energy as a core momentum anchor now face defensive positioning, awaiting cleaner breakouts before re-entry.
Crypto
Bitcoin’s 13% collapse erased prior gains and reminded managers that volatility in digital assets can mimic equities during macro stress. Systematic allocations were likely small and tightly risk-managed, but slippage risk would have been meaningful given the intraday nature of the reversal. Crypto’s long-term diversification case remains intact, but its short-term contribution was negative.
Softs & Meats
Cocoa, orange juice, and lean hogs delivered sharp drawdowns, pressuring commodity diversification sleeves. Meats – particularly cattle – offered stability, but softs’ volatility likely triggered partial liquidation or risk reduction. Managers will wait for clear price structure before rebuilding long exposure.
Rates & FX
Bonds provided essential ballast. The 10- and 30-year maturities rallied as yields fell, cushioning portfolio volatility. The USD strengthened broadly, amplifying profits in long-dollar systems and offsetting equity and commodity losses. Trend portfolios with balanced rate and FX exposure likely weathered the turbulence more effectively than those concentrated in risk assets.
Final Reflections – The Shock That Reversed Everything
This week compressed a month’s worth of volatility into a single session. Friday’s tariff shock exposed how quickly alignment can fracture and how fragile trend breadth remains beneath the surface.
What had been a steady environment midweek flipped violently by the close. Equities gave back weeks of gains. Copper and energy collapsed. Crypto lost its speculative glow in hours. Yet metals, bonds, and select livestock trends held firm, proving once again that diversification is not decoration, it’s survival.
For trend followers, three lessons stood out:
- Convexity is king – In high-correlation shocks, only convex assets like bonds and volatility positions deliver true defence.
- Correlation is conditional – Assets behave independently until they don’t. When risk events hit, everything moves as one.
- Process over prediction – The only reliable response to chaos is systematic discipline, small bets, wide nets, and reactive exits.
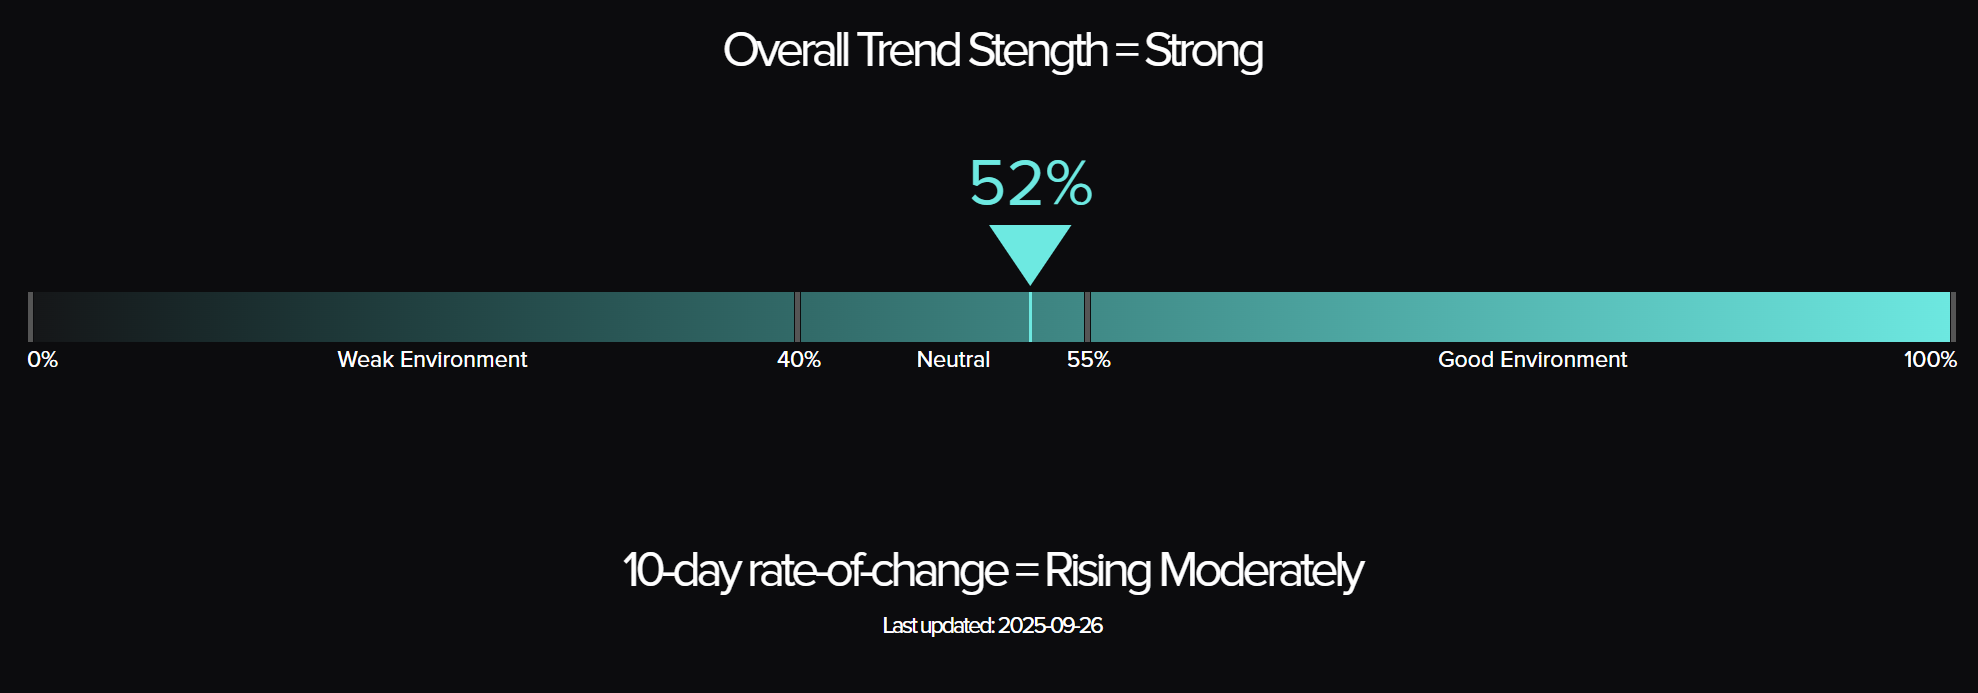
The TTU Barometer sits near neutral, rising weakly, while the SG Trend Index remains marginally positive for the month. The structure of momentum is bruised but intact.
As October unfolds, trend followers will be watching whether volatility burns itself out or ignites a broader regime shift. For now, the takeaway is clear: one shock can reverse everything, but it’s the process that ensures you survive it.

List of Resources used in the Week in Review
Important Disclaimers
This document is directly solely to Accredited Investors, Qualified Eligible Participants, Qualified Clients and Qualified Purchasers. No investment decision should be made until prospective investors have read the detailed information in the fund offering documents of any manager mentioned in this document. This document is furnished on a confidential basis only for the use of the recipient and only for discussion purposes and is subject to amendment This document is neither advice nor a recommendation to enter into any transaction. This document is not an offer to buy or sell, nor a solicitation of an offer to buy or sell, any security or other financial instrument. This presentation is based on information obtained from sources that TopTradersUnplugged (“TTU”) (“considers to be reliable however, TTU makes no representation as to, and accepts no responsibility or liability for, the accuracy or completeness of the information. TTU has not independently verified third party manager or benchmark information, does not represent it as accurate, true or complete, makes no warranty, express or implied regarding it and shall not be liable for any losses, damages, costs or expenses relating to its adequacy, accuracy, truth, completeness or use.
All projections, valuations, and statistical analyses are provided to assist the recipient in the evaluation of the matters described herein. Such projections, valuations and analyses may be based on subjective assessments and assumptions and may use one among many alternative methodologies that produce different results accordingly, such projections, valuations and statistical analyses should not be viewed as facts and should not be relied upon as an accurate prediction of future events. There is no guarantee that any targeted performance will be achieved Commodity trading involves substantial risk of loss and may not be suitable for everyone
TTU is not and does not purport to be an advisor as to legal, taxation, accounting, financial or regulatory matters in any jurisdiction. The recipient should independently evaluate and judge the matters referred to herein. TTU does not provide advice or recommendations regarding an investor’s decision to allocate to funds or accounts managed by any manager (“or to maintain or sell investments in funds or accounts managed by any manager, and no fiduciary relationship under ERISA is created by the investor investing in funds or accounts managed by any manager, or through any communication between TTU and the investor
In reviewing this document, it should be understood that the past performance results of any asset class, or any investment or trading program set forth herein, are not necessarily indicative of any future results that may be achieved in connection with any transaction. Any persons subscribing for an investment must be able to bear the risks involved and must meet the suitability requirements relating to such investment. Some or all alternative investment programs discussed herein may not be suitable for certain investors This document is directed only to persons having professional experience in matters relating to investments. Any investment or investment activity to which this document relates is available only to such investment professionals. Persons who do not have professional experience in matters relating to investments should not rely upon this document.
This document and its contents are proprietary information of TTU and may not be reproduced or otherwise disseminated in whole or in part without TTU’s prior written consent.
This document contains simulated or hypothetical performance results that have certain inherent limitations AND SHOULD BE VIEWED FOR ILLUSTRATIVE PURPOSES. Unlike the results shown in an actual performance record, these results do not represent actual trading. HYPOTHETICAL PERFORMANCE RESULTS HAVE MANY INHERENT LIMITATIONS, SOME OF WHICH ARE DESCRIBED BELOW. NO REPRESENTATION IS BEING MADE THAT ANY ACCOUNT WILL OR IS LIKELY TO ACHIEVE PROFITS OR LOSSES SIMILAR TO THOSE SHOWN IN FACT, THERE ARE FREQUENTLY SHARP DIFFERENCES BETWEEN HYPOTHETICAL PERFORMANCE RESULTS AND THE ACTUAL RESULTS SUBSEQUENTLY ACHIEVED BY ANY PARTICULAR INVESTMENT ACCOUNT.
ONE OF THE LIMITATIONS OF HYPOTHETICAL PERFORMANCE RESULTS IS THAT THEY ARE GENERALLY PREPARED WITH THE BENEFIT OF HINDSIGHT IN ADDITION, HYPOTHETICAL TRADING DOES NOT INVOLVE FINANCIAL RISK, AND NO HYPOTHETICAL TRADING RECORD CAN COMPLETELY ACCOUNT FOR THE IMPACT OF FINANCIAL RISK IN ACTUAL TRADING FOR EXAMPLE, THE ABILITY TO WITHSTAND LOSSES OR TO ADHERE TO A PARTICULAR TRADING PROGRAM OR OTHER ASSET.
There are numerous other factors related to the markets in general or to the implementation of any specific trading program which cannot be fully accounted for in the preparation of hypothetical performance results and all of which can adversely affect actual trading results. No representation is being made that any investment will or is likely to achieve profits or losses similar to those being shown.