


Trend Following Performance Report — October, 2021

Overview
October produced a positive result for the TopTradersUnplugged Trend Following (“TTU TF”) Index lifting the Index to a new high watermark. A similar strong performance was observed for the SG Trend Index. The TTU TF Index lifted 3.19% and the SG Trend Index rose by 2.99% for the month. Trend following conditions have remained exceptionally strong over the past 12 months resulting in many Classic Trend Following Funds delivering their strongest performance since 2000.
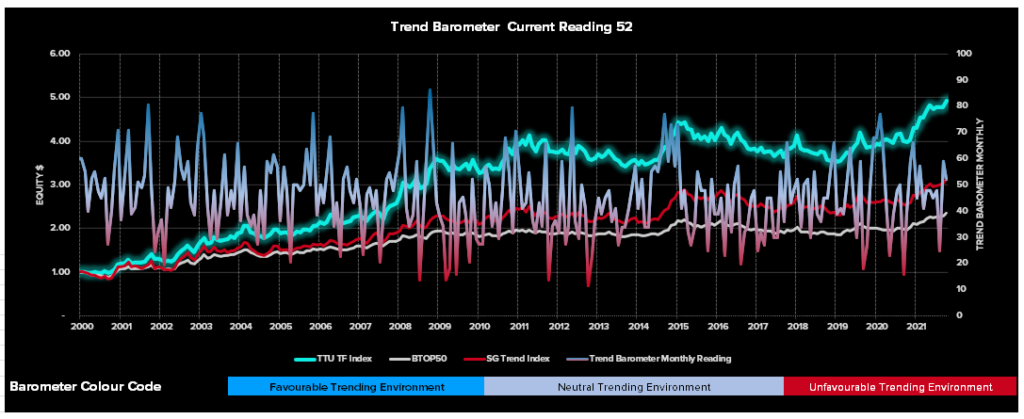
The TTU Trend Barometer provided a reading of 52 which is beginning to reflect more favourable trending conditions across a broad range of liquid markets.
The Trend Barometer is a proprietary tool we use at TTU to assess the trend strength of a diversified portfolio consisting of 44 markets across all sectors. We firstly subdivide the trend strength of each market of a hypothetical diverse portfolio into five ranges from strong up, medium up, neutral, medium down and strong down. We then aggregate these results into a single portfolio number which we use to describe the overall trend strength across a hypothetical Program portfolio.
We then arbitrarily divide this percentage range into 3 where a value of 0-30 is considered a very unfavourable market regime for trend following Programs, a range between 30 to 55 is a somewhat neutral environment for Trend Following Programs (but not an environment where you could expect consistent performance) and values more than 55 are considered to be a favourable regime towards Trend Following Programs, where they should see good performance.
This method is surprisingly powerful in describing CTA monthly performance and can be used to connect market trading environments to resultant Manager performance.
The month commenced with a roller-coaster in many markets. Chairman Powell failed to indicate an official start to tapering but the rhetoric continued to suggest that it certainly is on the agenda in the immediate horizon perhaps with an announcement at the November meeting. Bond investors didn’t like the news and drove the yields higher, and it was announced that reverse repos would be doubled with counterparties. A record for the program.
The second week saw trends continue providing a great start to the fourth quarter with the grains particularly Oats and Energies providing significant trending moves.
Week 3 saw inflation coming in higher than expected with the yield curve flattening. The fourth Quarter continues to offer excellent trending conditions.
Investors appear to be positioning for a near term interest rate hike. Eurodollar futures experienced a big move this month and two-year Notes have become much cheaper. The minutes of the September FOMC were released providing some details of plans for tapering perhaps as early as November. CPI readings are clearly indicating a move towards` higher prices with ensuing higher inflation and a possible move towards higher interest rates.
Energies continued to provide strong trends with Equities also showing positive trending conditions. Short term interest rate contracts offered trends with longer term interest rates remaining flat. The week also saw strong moves in Copper with Gold and Silver remaining flat. Currencies also had a positive week.
Week four saw the Fed Chairman Powell provide an overview of the US economy avoiding the use of the term ‘transitory’ to describe the rising prices that have US consumers loudly complaining. He characterised inflation as being elevated and will likely stay that way longer. The Bank of England shocked investors announcing that they will be raising the overnight rates perhaps in November. The market reaction was an immediate move higher in interest rates with the anticipation that more rate hikes are coming. You would assume that UK stocks would retreat on this announcement…. but once again you would be mistaken as the FTSE flirted with all-time highs during the week.
The week was led by the fixed income sector with short positions doing very well. Equities came back towards the end of the week and currencies, metals and soft commodities were quite subdued.
The final week of the month saw the month of October not disappoint. The appetite for risk returned and we saw short covering of bonds. The Bank of Canada followed suit with the Bank of England and announced they will be raising rates shortly. Cotton, Wheat and Oats continued to trend strongly. Equities provided solid returns to end the week. Energies also continued to offer great trending opportunities and Bitcoin reached new highs.
For a blow-by-blow description of what was moving for the month, then you can always listen to our weekly systematic investor series by clicking on the links below. It is worthwhile listening to our past catalogue as it provides you with an understanding of how these markets can shape the emotions of a Trader and why it is therefore essential that Trend Followers adopt systematic rules-based processes to keep these emotions in check.
- 160 Systematic Investor Series ft Rob Carver – October 3rd, 2021
- 161 Systematic Investor Series ft Jerry Parker – October 10th, 2021
- 162 Systematic Investor Series ft Moritz Seibert – October 17th, 2021
- 163 Systematic Investor Series ft Mark Rzepczynski – October 24th, 2021 and
- 164 Systematic Investor Series ft Richard Brennan – November 1st, 2021
Top Traders Unplugged Trend Following Index (TTU TF Index) Performance
Using the excellent and free public sources of Fund Manager return data provided by Nilsson Hedge we create a Trend Following Index comprising those Programs which meet our definition of Globally Diversified Systematic Trend Following Programs. To meet this definition a Program must be:
- Geographically diversified across a broad array of asset classes that include soft commodities, energies, metals, bonds, fixed income, foreign exchange, and equities;
- Fully systematic in nature using quantitative rules-based processes for entry and exit decisions; and
- Adopt Trend Following trading techniques as the dominant investment strategy within the Program.
Having identified those Programs that meet this definition, we then create an Index by monthly rebalancing with equal weighting and cheekily refer to it as the TTU TF Index. Our Index comprises a total of 152 Programs over the Performance monitoring period from 1 January 2000 to the current month of 31st October 2021, we have a total of 38 Programs reporting.
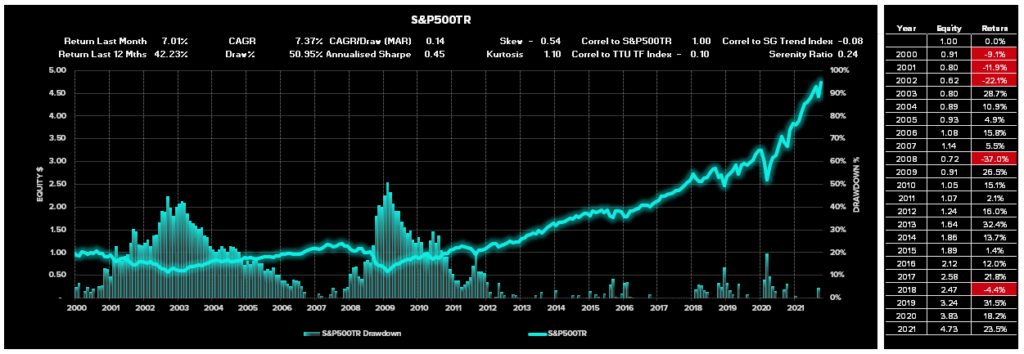
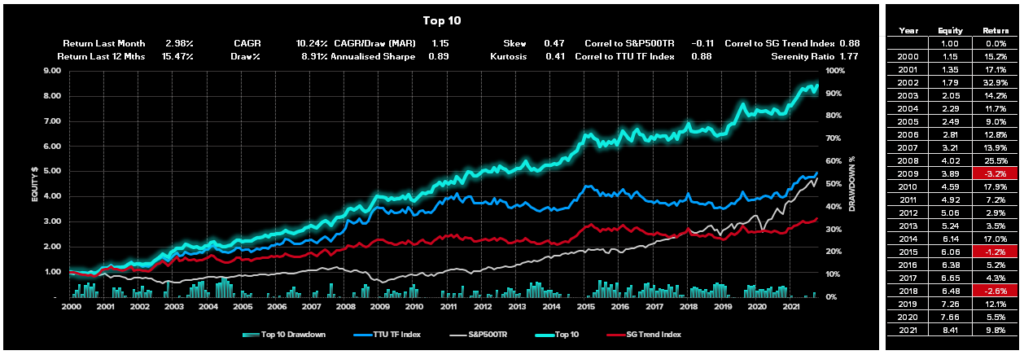
For the period from 1st January 2000 to 31st October 2021, the TTU TF Index has produced a Compound Annual Growth Rate of 7.58% with a Maximum Drawdown of 20.60% (Refer to Chart 1). This compares very favourably against the performance of the S&P500 Total Return Index (includes dividends) which has produced a Compound Average Growth Rate of 7.37% with a Maximum Drawdown of 50.95% over the same period (Refer to Chart 2).
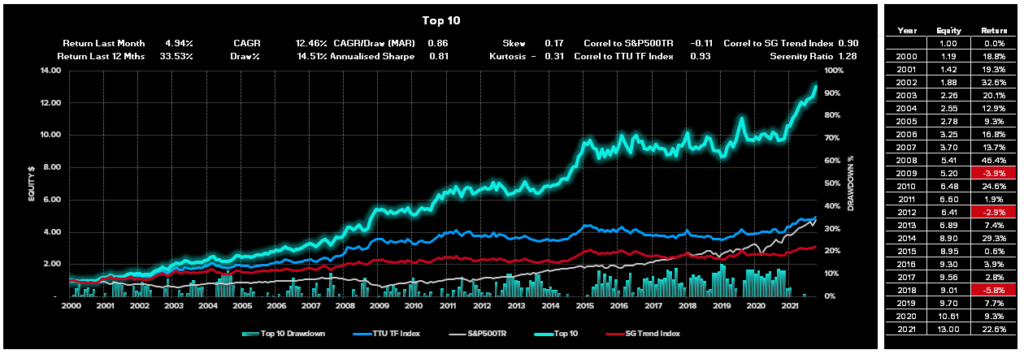
For the month of October 2021, The TTU TF Index increased 3.19% reaching a new high watermark previously set in May 2021. Alternative Trend Following Indexes (Refer to Chart 1) such as the Barclays Top 50 Index (BTOP50) and the Société Générale Trend Index (SG Trend Index) experienced gains of 2.84% and 2.99% respectively for the month.
Chart 1 – TTU TF Index Performance
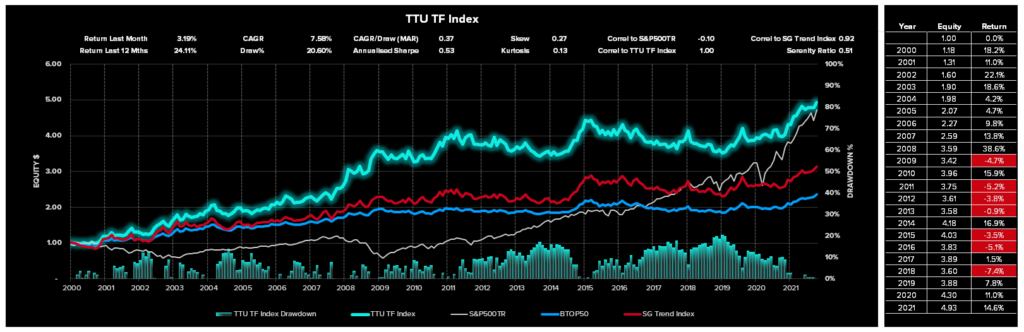
Chart 2– S&P500TR Index Performance
Top Traders Unplugged Trend Following Program (TTU TF Program)
You may have noticed that recently in the Systematic Investor Series I have been showcasing my proprietary system which I traded before my involvement with DUNN. I have taken my listeners under the hood to better understand the thinking behind the design process of this trend following model in the following episodes:
- 120 Systematic Investor Series – January 2nd, 2021; and
- 121 Systematic Investor Series – January 6th, 2021.
We have continued to track the performance of this trend following model on an ‘after fee’ NAV basis simply to provide a context for my listeners to understand how the performance of this classic trend following model performs against other, perhaps more recent Trend Following Programs whose methods have ‘drifted’ away from the traditional Trend Following roots.
Despite a difficult drawdown period between May 2015 to Feb 2019, the TTU Trend Following model continues to perform strongly during market regimes that are more volatile and uncertain.
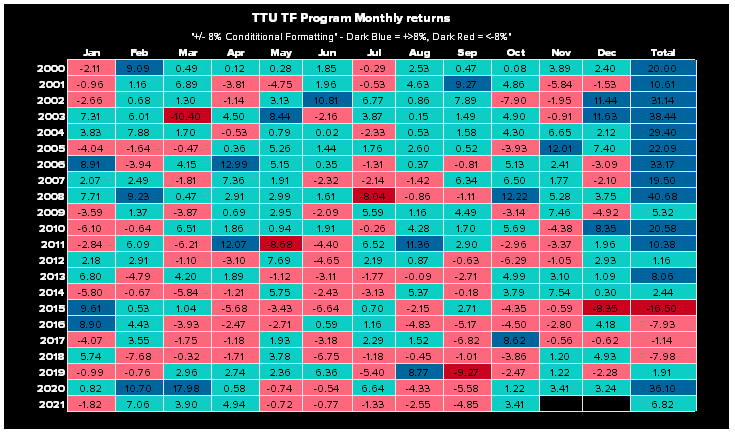
October saw a gain of 3.41% bringing the YTD return from January 2021 to a modest 6.80%. Despite the strong start to the year, the preceding 5 months have chipped away at this initial strong growth performance. The October positive result was welcomed.
Chart 3 – TTU TF Program Performance
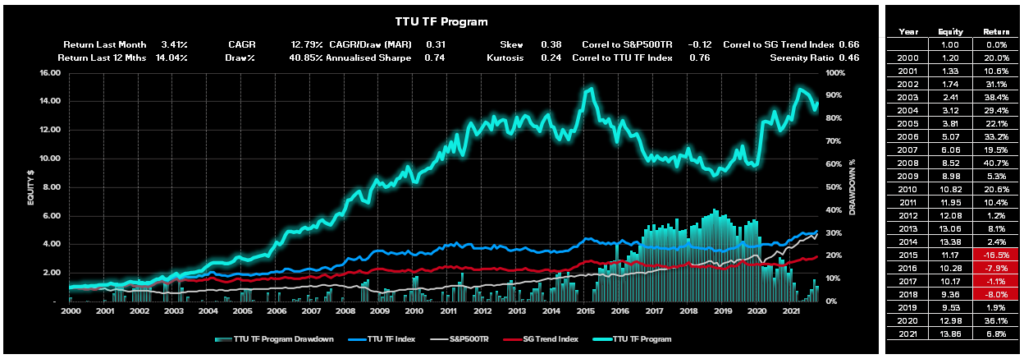
Table 1 – TTU TF Program Monthly Returns
Top 10 Lists
We have prepared the following Top 10 lists for various performance categories based on monthly performance returns for the reporting period 1st January 2000 to 31st October 2021.
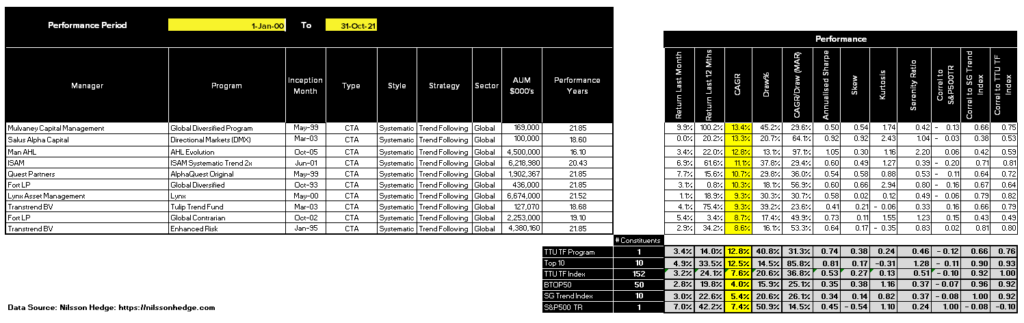
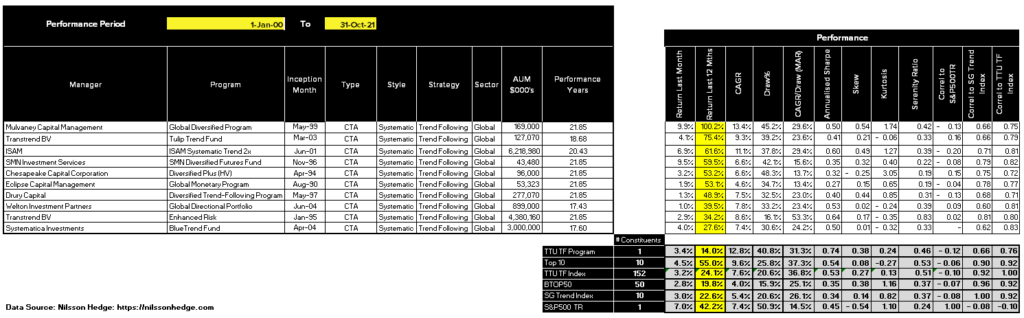
1. Top 10 Listing – by Compound Annual Growth Rate
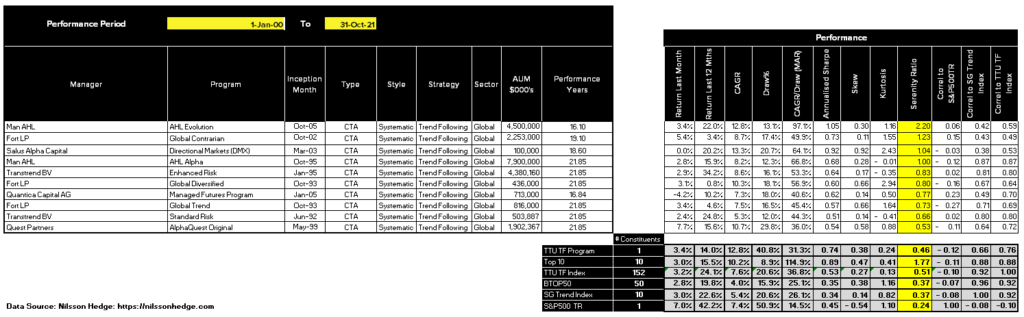
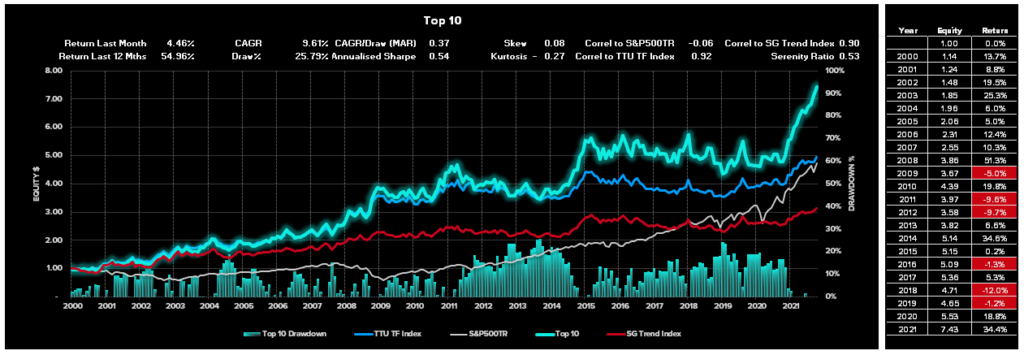
2. Top 10 Listing – by Risk Adjusted Return (Serenity Ratio)
3. Top 10 Listing – by Last 12 months Performance
Performance Results for the TTU Top 5 by Serenity Ratio
In a recent research project, we undertook at TTU, we examined three different allocation methods that could be deployed by an investor seeking to optimally allocate investment funds towards 5 of the Top ranked Globally Diversified Systematic Trend Following Programs with a long-term track record.
These three methods adopted 3 different forms of performance metric, namely:
- Top 5 Performers by Compound Annual Growth Rate (CAGR) using a rolling lookback of 15 years.
- Top 5 Performers by MAR ratio (CAGR/Max Draw%) using a rolling lookback of 15 years.
- Top 5 Performers by Serenity Ratio using a rolling lookback of 15 years.
The findings of our project can be obtained by clicking on this link.
Our research determined that the optimal selection method was the Serenity Ratio method.
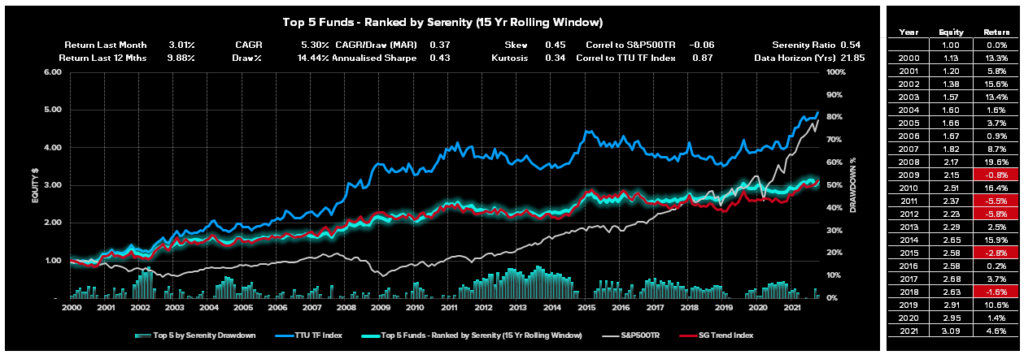
The Performance for the month of October 2021 of our Top 5 Selection Method using the Serenity Ratio was an increase of 3.01% bringing the prior 12 months return to a result of 9.88% (Refer to Chart 4). The ‘Serenity’ selection method continues to perform exceptionally well from a risk-adjusted perspective. For the entire reporting period, this selection method boasts a CAGR of 5.30% with a Maximum Drawdown of only 14.44% and effectively a “zero” correlation to the SRP500TR Index (-0.06).
Chart 4 – Performance Results of the Top 5 Allocation Method (Serenity Ratio)
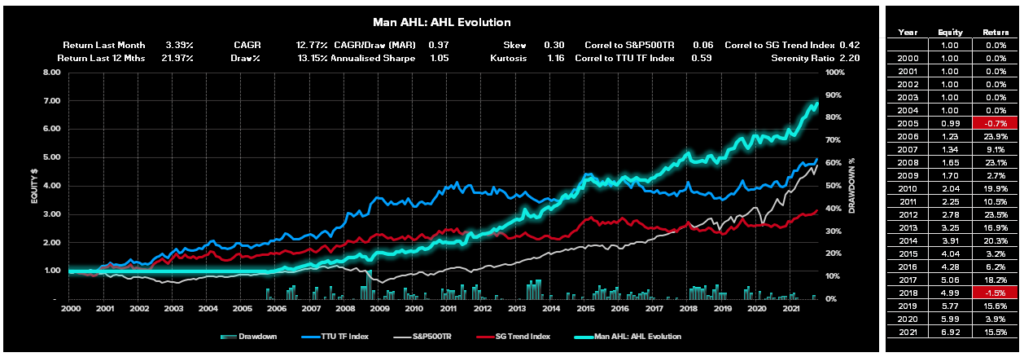
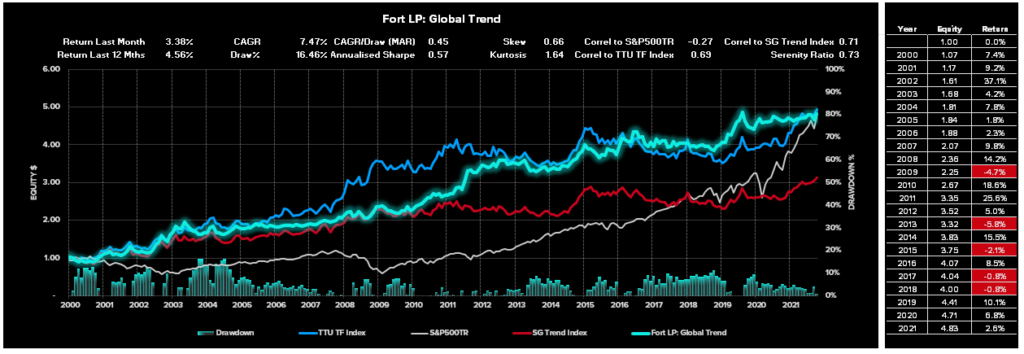
The current selection of Top 5 Funds that have been recommended by this research for the investment period between 1st January 2021 and 31st December 2021 are as follows:
- Man AHL: AHL Evolution
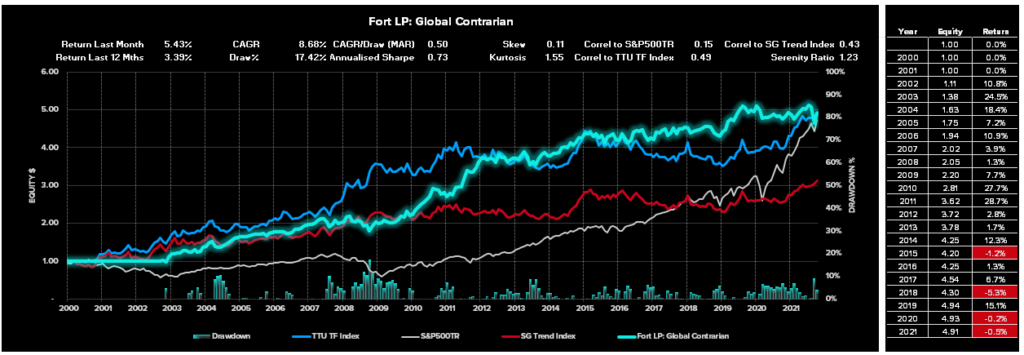
- Fort LP: Global Contrarian
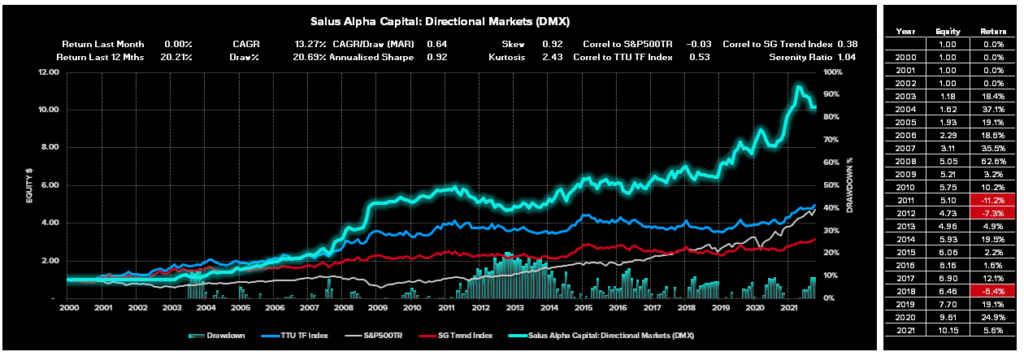
- Salus Alpha Capital: Directional Markets (DMX)
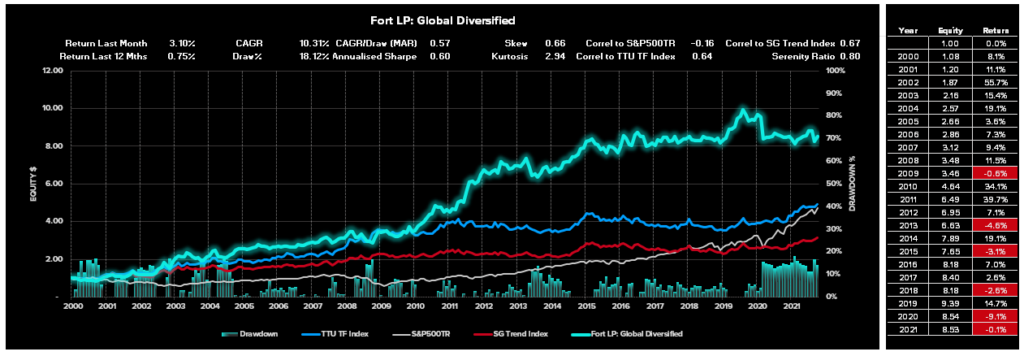
- Fort LP: Global Diversified and
- Fort LP: Global Trend
Performance Results for these 5 current top performers that comprise the current 12-month Top 5 selection list are as follows:
Performance Results for the Alternative 60/40 portfolio using the TTU Top 5 by Serenity Ratio
In our “How to Invest with the Best” blog post, we also highlighted the significant improved risk-adjusted performance results that could be achieved by replacing the 40% allocation to Bonds in the traditional 60/40 portfolio with an allocation of 40% towards the TTU Top 5 by Serenity ratio.
The evaluation compared the performance of a traditional 60% Equity/40% Bond portfolio against a 60% Equity/40% Serenity portfolio to highlight the uncorrelated historical nature of this Alternative 60/40 portfolio and demonstrate the benefits that a sizeable allocation towards the Serenity portfolio would bring to an investor if equity and bond markets go back to their historic relationship and become more positively correlated in the future. There is no guarantee that correlations remain static over time and it is possible that bond markets and equity markets may lose their uncorrelated relationship that has existed in the last 20 years or so. It is far less likely that the TF managers within the Serenity Grouping will ever be strongly positively correlated to the Equities market, over the long run, given the extensive global diversification and ability to go long and short, that is present within the constituents of the Serenity Grouping.
Chart 5 below showcases the comparative performance results for the period 1st January 2000 to 31st October 2021 of:
- A 100% investment in the S&P500TR portfolio
- A 100% investment in the VBIAX which is a suitable proxy for the classic 60% Equity/40% Bond portfolio
- A 100% investment in a 60% S&P500TR 40% Serenity portfolio and
- A 100% investment in the Serenity Portfolio
Chart 5 – Comparative Performance Results of Various Portfolio Allocations
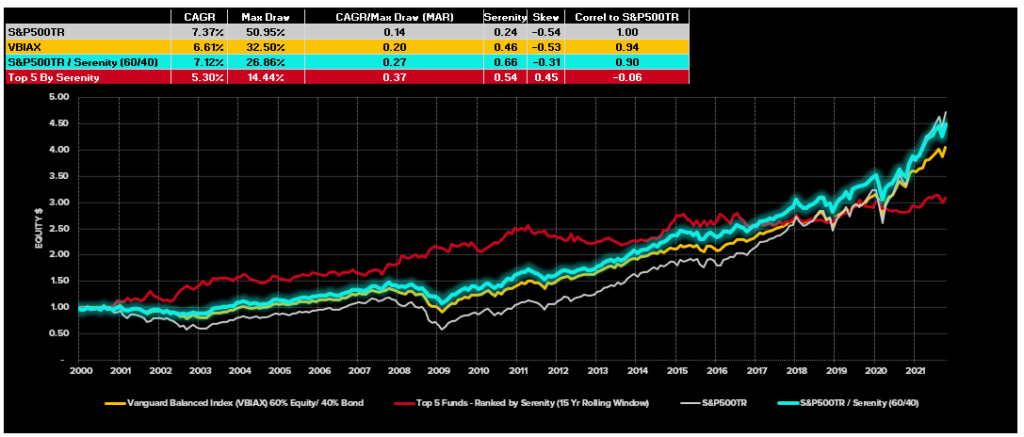
The comparison of alternative portfolio allocations above highlights the strong historic risk adjusted returns that have been enjoyed by 60% S&P500TR / 40% Serenity Composite Portfolio.
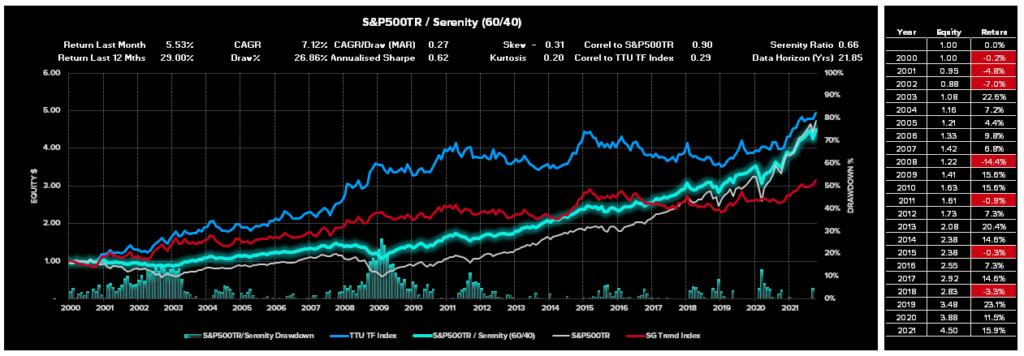
A more detailed assessment of this powerful 60/40 investment option is reflected in Chart 6 below.
Chart 6 – Performance Results for the 60% S&P500TR/ 40% Serenity Composite
Important Disclaimers
This document is directly solely to Accredited Investors, Qualified Eligible Participants, Qualified Clients and Qualified Purchasers. No investment decision should be made until prospective investors have read the detailed information in the fund offering documents of any manager mentioned in this document. This document is furnished on a confidential basis only for the use of the recipient and only for discussion purposes and is subject to amendment This document is neither advice nor a recommendation to enter into any transaction. This document is not an offer to buy or sell, nor a solicitation of an offer to buy or sell, any security or other financial instrument. This presentation is based on information obtained from sources that TopTradersUnplugged (“TTU”) (“considers to be reliable however, TTU makes no representation as to, and accepts no responsibility or liability for, the accuracy or completeness of the information. TTU has not independently verified third party manager or benchmark information, does not represent it as accurate, true or complete, makes no warranty, express or implied regarding it and shall not be liable for any losses, damages, costs or expenses relating to its adequacy, accuracy, truth, completeness or use.
All projections, valuations, and statistical analyses are provided to assist the recipient in the evaluation of the matters described herein. Such projections, valuations and analyses may be based on subjective assessments and assumptions and may use one among many alternative methodologies that produce different results accordingly, such projections, valuations and statistical analyses should not be viewed as facts and should not be relied upon as an accurate prediction of future events. There is no guarantee that any targeted performance will be achieved Commodity trading involves substantial risk of loss and may not be suitable for everyone
TTU is not and does not purport to be an advisor as to legal, taxation, accounting, financial or regulatory matters in any jurisdiction. The recipient should independently evaluate and judge the matters referred to herein. TTU does not provide advice or recommendations regarding an investor’s decision to allocate to funds or accounts managed by any manager (“or to maintain or sell investments in funds or accounts managed by any manager, and no fiduciary relationship under ERISA is created by the investor investing in funds or accounts managed by any manager, or through any communication between TTU and the investor
In reviewing this document, it should be understood that the past performance results of any asset class, or any investment or trading program set forth herein, are not necessarily indicative of any future results that may be achieved in connection with any transaction. Any persons subscribing for an investment must be able to bear the risks involved and must meet the suitability requirements relating to such investment. Some or all alternative investment programs discussed herein may not be suitable for certain investors This document is directed only to persons having professional experience in matters relating to investments. Any investment or investment activity to which this document relates is available only to such investment professionals. Persons who do not have professional experience in matters relating to investments should not rely upon this document.
This document and its contents are proprietary information of TTU and may not be reproduced or otherwise disseminated in whole or in part without TTU’s prior written consent.
This document contains simulated or hypothetical performance results that have certain inherent limitations AND SHOULD BE VIEWED FOR ILLUSTRATIVE PURPOSES. Unlike the results shown in an actual performance record, these results do not represent actual trading. HYPOTHETICAL PERFORMANCE RESULTS HAVE MANY INHERENT LIMITATIONS, SOME OF WHICH ARE DESCRIBED BELOW. NO REPRESENTATION IS BEING MADE THAT ANY ACCOUNT WILL OR IS LIKELY TO ACHIEVE PROFITS OR LOSSES SIMILAR TO THOSE SHOWN IN FACT, THERE ARE FREQUENTLY SHARP DIFFERENCES BETWEEN HYPOTHETICAL PERFORMANCE RESULTS AND THE ACTUAL RESULTS SUBSEQUENTLY ACHIEVED BY ANY PARTICULAR INVESTMENT ACCOUNT.
ONE OF THE LIMITATIONS OF HYPOTHETICAL PERFORMANCE RESULTS IS THAT THEY ARE GENERALLY PREPARED WITH THE BENEFIT OF HINDSIGHT IN ADDITION, HYPOTHETICAL TRADING DOES NOT INVOLVE FINANCIAL RISK, AND NO HYPOTHETICAL TRADING RECORD CAN COMPLETELY ACCOUNT FOR THE IMPACT OF FINANCIAL RISK IN ACTUAL TRADING FOR EXAMPLE, THE ABILITY TO WITHSTAND LOSSES OR TO ADHERE TO A PARTICULAR TRADING PROGRAM OR OTHER ASSET.
There are numerous other factors related to the markets in general or to the implementation of any specific trading program which cannot be fully accounted for in the preparation of hypothetical performance results and all of which can adversely affect actual trading results. No representation is being made that any investment will or is likely to achieve profits or losses similar to those being shown.
Most Comprehensive Guide to the Best Investment Books of All Time

Most Comprehensive Guide to the Best Investment Books of All Time
Get the most comprehensive guide to over 600 of the BEST investment books, with insights, and learn from some of the wisest and most accomplished investors in the world. A collection of MUST READ books carefully selected for you. Get it now absolutely FREE!
Get Your FREE Guide HERE!