


Trend Following Performance Report — February, 2023

Overview
Here we are mid-March 2023 writing about the performance of the Trend Followers up to 28th February 2023. All seems quite peaceful. But somewhere deep in the Silicon Valley, an event is unwinding suggesting that things are far from normal. The Silicon Valley Bank is experiencing a bank run.
Of course, this is in March and here we are reporting on February’s results where many pundits have assumed the worst is behind us with a return to continuously rising equity markets. But the Trend Follower refuses to engage in crystal ball gazing.
For the Trend Follower, our process is free from making decisions about what the markets will do next. We simply apply a reactive process that follows price across a globally diversified portfolio, in recognition of the fact that the majority of our alpha will be derived in those times when predictors get it so wrong.
But if you want to understand the philosophy surrounding Trend Following and understand why we avoid predictive narrative, then you should take the time to hear this philosophy on Top Traders Unplugged. In particular the interviews held by Alan and Niels where they interview many of the Managers heading up the SG CTA Index. All of the conversations can be found right here.
While we don’t specifically cover some of the Programs featured in this series in our monthly report, some of whom would be considered multi-strategy, common to all Managers featured in this excellent series is their recognition of how Trend Following offers considerable benefits to a traditional portfolio by virtue of its diversification properties.
We thought we would undertake a quick research project to demonstrate Trend Following’s diversification properties and post the results in this monthly edition.
So, we investigated the results of allocating 20% of a traditional 60/40 portfolio towards any of the Managers featured in the CTA Index, and here is what we found (refer to Figure 1). In nearly every case (except PIMCO where Portfolio Sharpe remained constant), an allocation of 20% to any of the Programs listed below (excluding those where we lacked monthly data) significantly enhanced the Portfolio Sharpe. For those with a longer-term track record of 20 years or more, the beneficial impacts to Portfolio Sharpe were even more material.
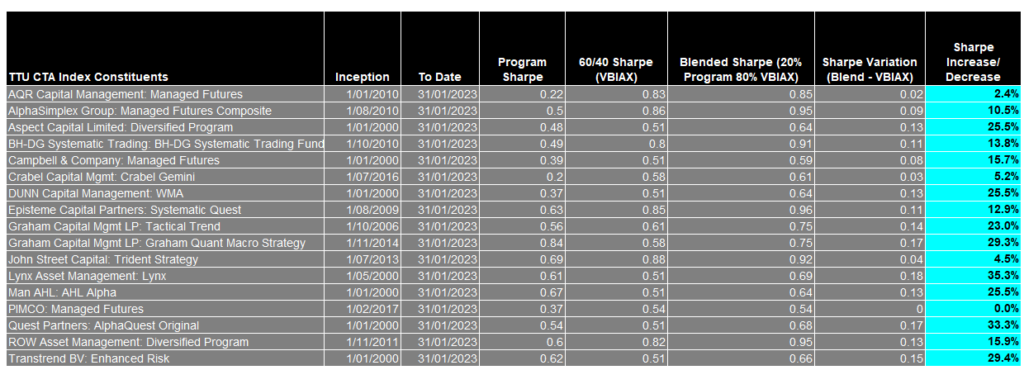
This is quite an extraordinary finding. It is not just that a few of them add diversification benefits to a 60/40 portfolio over different time horizons. But with a sufficient track record, all of them do.
Clearly Trend Following has some powerful diversification benefits.
To dig into the weeds a bit it is helpful to visualise the return streams of the various options. Below in Chart 2 we have applied a 20% allocation of DUNN’s WMA Program to the 60/40 portfolio to demonstrate how a blend benefits from the properties of the unblended return streams.
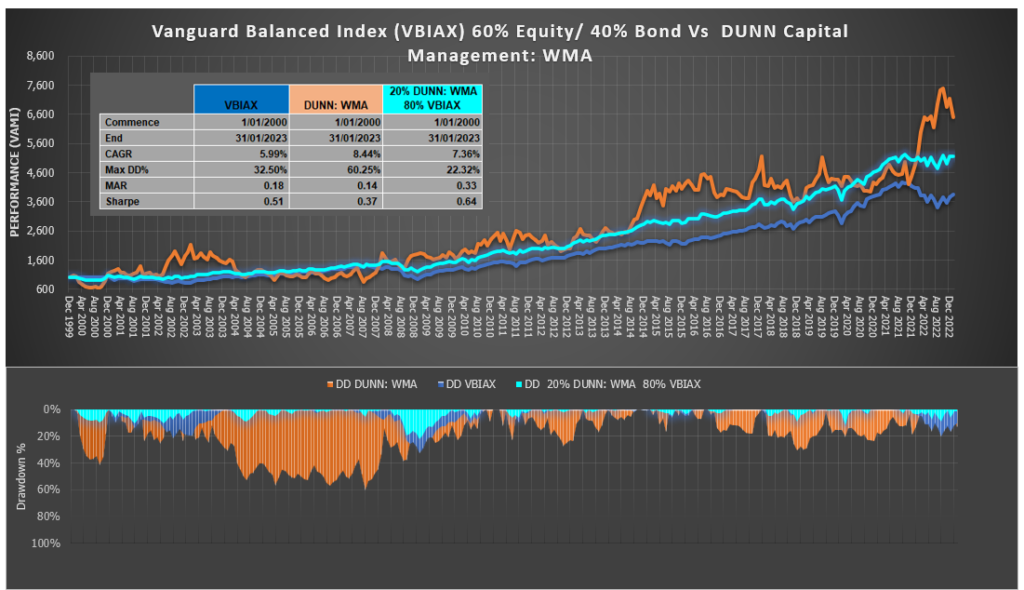
A 20% allocation towards DUNN smooths the Sharpe of the Blended Portfolio from 0.51 to 0.64 and the lifts the MAR ratio from 0.18 to 0.33. The Sharpe ratio demonstrates how the blend translates into a smoother ride, but the MAR ratio (CAGR/Max DD) goes one step further and demonstrates the blend’s lifting power by looking at the Compound Average Growth Rate (CAGR) of the Portfolio against its maximum drawdown (Max DD).
You see, we already understand how a blend of uncorrelated return streams help to smooth an equity curve, but we mustn’t lose sight of the important feature that Trend Following also brings to a traditional portfolio. Namely lifting power.
The 60/40 solution became popular as a simple method to smooth a traditional equity portfolio, but it lacked the ability to offer any significant lifting power to a blend. Trend Following however offers not only the ability to further smooth the blend, but more importantly, provides enhanced returns that lift the long term returns of the blend.
Why go for smoothness when you can have both smoothness AND lifting power?
Anyway, back to the monthly report for the Diversified Systematic Trend Followers for February 2023 as there is much more to talk about.
February 2023 Trend Index Performance
February saw a reversal “and then some” of January’s declines.
The TTU TF Index posted a gain of 1.20% bringing the YTD result to 0.30%, the BTOP 50 Index increased by 1.34% bringing the YTD result to 1.31% and the SG Trend Index increased by 1.85% bringing thee YTD result to 0.45%.
To understand the slight differences between the performance results of these indexes we need to take a quick detour to understand how they are constructed.
SG Trend Index
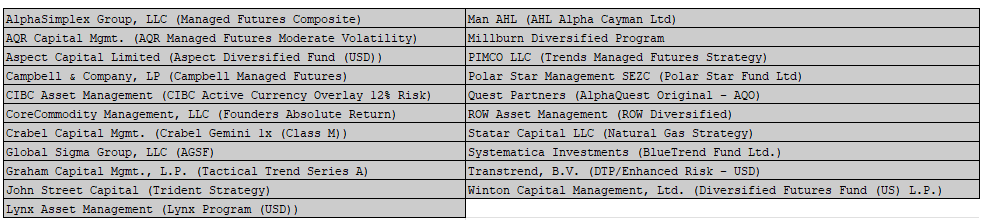
The SG Trend Index is designed to track the 10 largest trend following CTA’s of the managed futures space.
Criteria for inclusion in the Index as determined by Society Generale is as follows:
• Must trade primarily futures (including FX forwards);
• Must be broadly diversified across asset classes;
• Must be an industry recognized trend follower;
• Must exhibit significant correlation to trend following peers;
• Must be open the new investment; and
• Must report returns on a daily basis (net of fees).
The index currently is:
• Equally weighted;
• Calculated in base currency;
• Has an inception date of 1st January 2000;
• Rebalanced annually on 1st January; and
• Reconstituted annually on 1st January based on eligibility criteria.
There was a slight modification to the Index from January 2013 to present. Previously the Programs needed to be a constituent of the SG CTA Index and the 10 largest Managers was not a requirement.
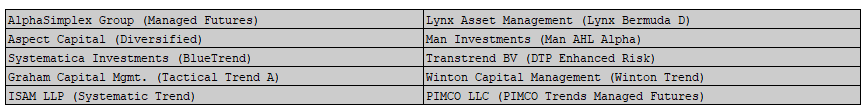
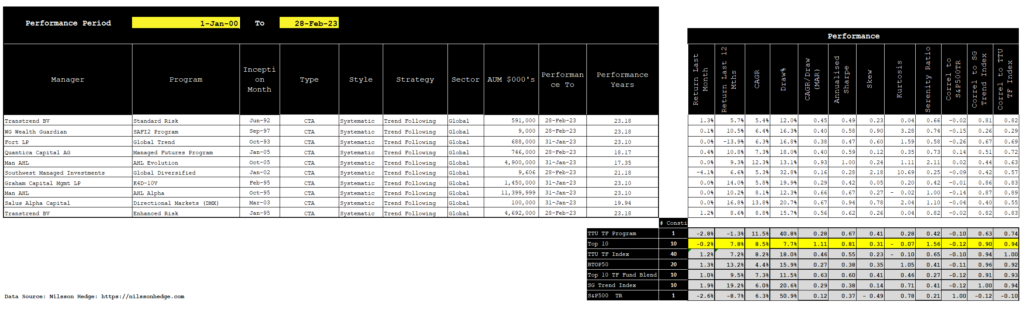
The listing of the 10 eligible programs in the Index for 2023 were as follows:
The performance of the SG Trend Index since 1st January 2000 to the end of last month is seen in Chart 3 below:
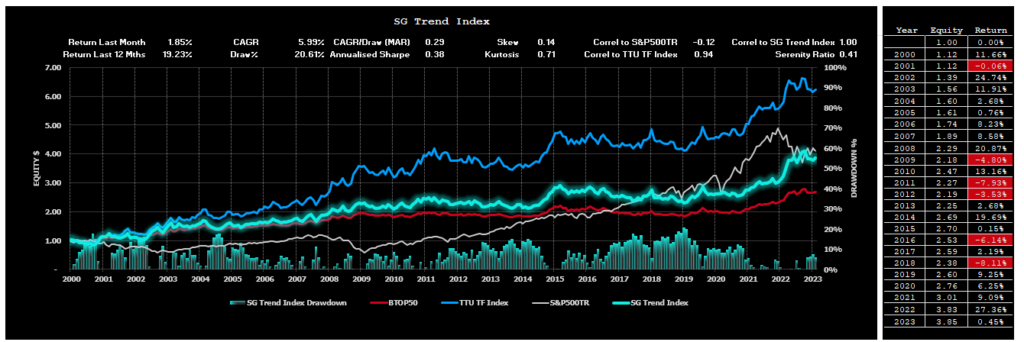
You will notice how the SG Trend Index is highly correlated with the BTOP50 Index and the TTU TF Index and uncorrelated with the S&P500TR Index.
Despite the high correlation between the various trend following Indexes, the long-term performance of these three Trend Following Indexes in terms of CAGR is different. The SG Trend Index plots between the BTOP50 Index and the TTU TF Index.
BTOP 50 Index
The BTOP50 Index seeks to replicate the overall composition of the managed futures industry with regards to trading style and overall market exposure. Unlike the SG Trend Index and the TTU TF Index, the BTOP50 is not strictly a trend following Index and is more broadly representative of the entire managed futures segment of which a dominant style is trend following. We like to think of the BTOP 50 as a ‘quasi trend following Index’ as opposed to a pure trend following Index.
Like the SG Trend Index, the BTOP50 Index is designed to track the performance of the largest Programs by AUM, however the Programs included may not be all Trend Following Programs. Criteria for inclusion in the Index as determined by Barclay Hedge is as follows:
Criteria for inclusion in the Index as determined by BarclayHedge is as follows:
• Must be a Program represented in the Barclay CTA Universe;
• In each Calendar year, the Programs selected must in aggregate be no less than 50% of the investable assets of the Barclay CTA Universe;
• The Programs must be open for investment;
• The Manager must be willing to provide Barclay Hedge with daily return performance;
• The Program must have at least two years of trading activity; and
• The Program’s advisor must have at least three years of operating history.
The index currently is:
• Equally weighted;
• Rebalanced annually on 1st January; and
• Reconstituted annually on 1st January based on eligibility criteria.
Despite the ’50’ tag in the BTOP 50 description, for 2022 there were 20 constituents and for 2023 there are now 21 funds in the Index.
For 2023 the listing was as follows.
The performance of the BTOP 50 Index since 1st January 2000 to to the end of last month is seen in Chart 4 below:
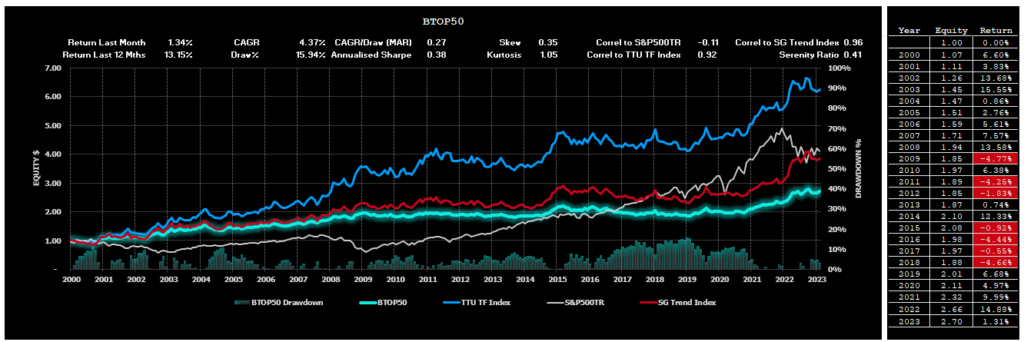
The BTOP 50 Index is highly correlated with the trend following Indexes of the SG Trend Index and the TTU TF Index, however its long-term performance is the lowest of the 3 Trend Following Indexes. While there is a significant representation of Trend Following Programs within the Index, the non-trend following Programs contribute to this diluted long-term performance.
TTU TF Index
The TTU TF Index has been developed by Top Traders Unplugged to provide a performance measure of the trend following programs with a long-term track record.
At TTU, we recognise the importance of a robust trading approach to these uncertain markets and feel that AUM is not a good robustness measure when it comes to assessing performance of the Trend Following industry. It is our strong opinion that the ultimate selection measure to apply in constituting a Trend Following Index is not AUM or a proxy risk metric such as the Sharpe, Sortino, MAR ratio, Ulcer Index or Serenity ratio. The superior metric to assess long-term performance is the long-term validated track record itself.
We have therefore developed a different method for constructing our TTU TF Index. The criteria for inclusion into our Index is as follows:
The criteria for inclusion into the TTU TF Index is as follows:
• Monthly performance results need to be captured in the Nilsson Hedge CTA database;
• Must be geographically diversified across asset classes;
• Must be fully systematic in nature using quantitative rules for entry and exit;
• Must possess at least a 15-year unbroken track record to the current reporting month;
• Must adopt trend following as their dominant investment strategy;
• Are currently active programs; and
• Must report performance monthly (net of fees).
The Index:
• Is Equally weighted;
• Is Rebalanced monthly;
• Is Reconstituted monthly;
• Has an inception date of 1st January 2000
As of 28th February 2023, the TTU TF Index at the date of writing this report included the results of 40 Programs. The monthly return for the Index is calculated using the average return produced from those Programs who have reported for the month.
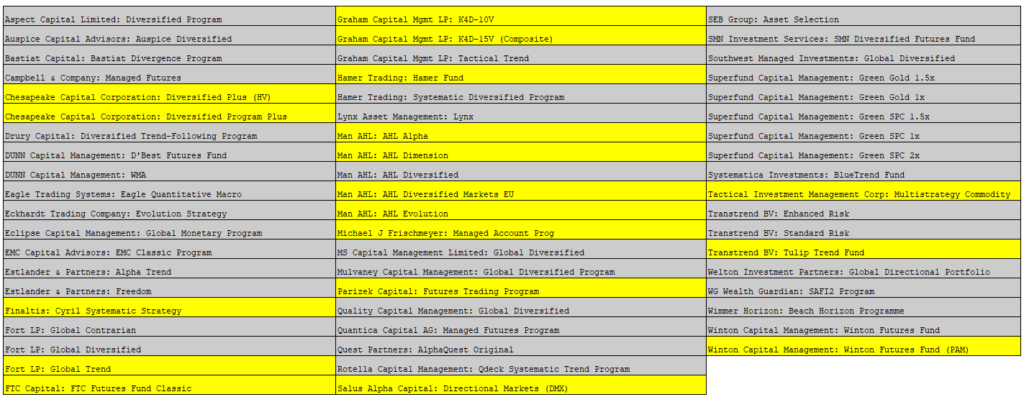
The total active listing is now 58 active Programs for which 40 have reported for the month.
The 18 Programs which have not reported for the month at the date of this report are highlighted in the Table below.
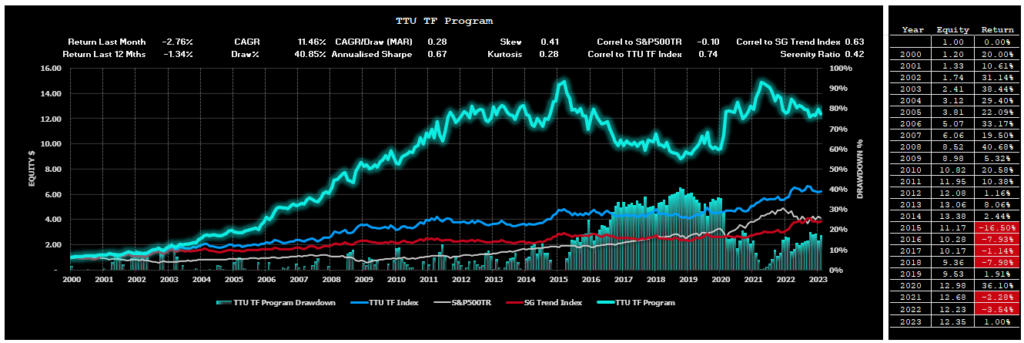
The performance of the TTU TF Index since 1st January 2000 to to to the end of last month is as follows:
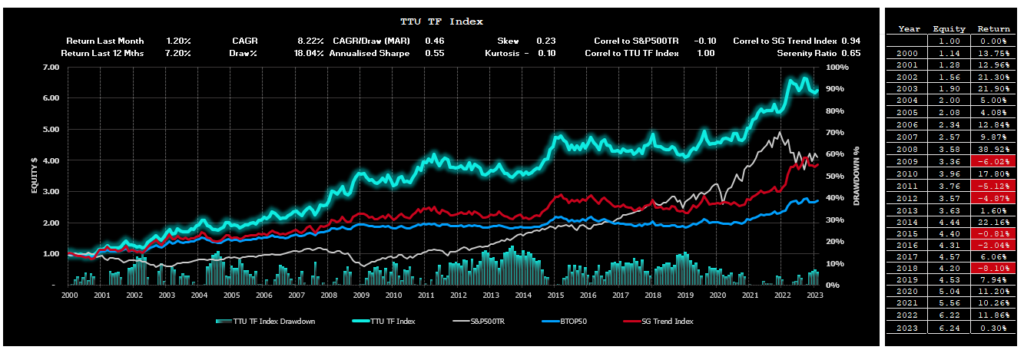
Now you might be intrigued by the performance result of the TTU TF Index. While it is highly correlated with the BTOP 50 Index and the SG Trend Index, we can see that long term performance of the TTU TF Index clearly outstrips alternative Index measures.
The dominant contributor of this outperformance is the requirement for any participating Program in the Index to have a long-term track record. You see, using AUM as a criterion for inclusion is not necessarily a useful selection criteria. While AUM reflects ‘market appeal’, it does not imply that this ‘market appeal’ is strongly correlated with ‘long term performance’.
Our process of Index construction gives us an insight into how any diversified ensemble of trend following Programs with a long-term track record approaches an optimal portfolio as we increase the number of Programs in the Index. Simply by diversifying into a large ensemble of Trend Following Programs with a long-term track record, we magically improve the Index result. CAGR is increased and our drawdowns are reduced.
Of course, we already know this ‘diversification’ principle of Trend Following. As we increase our diversification efforts, we obtain improvement both in terms of the maximum drawdown and in the CAGR generated by the ensemble. This is why we seek to strive for maximum market and system diversification within our individual programs. The TTU TF Index just takes this diversification one step further and diversifies across many different TF Programs to deliver a superior risk-adjusted result.
TTU TF Index Performance
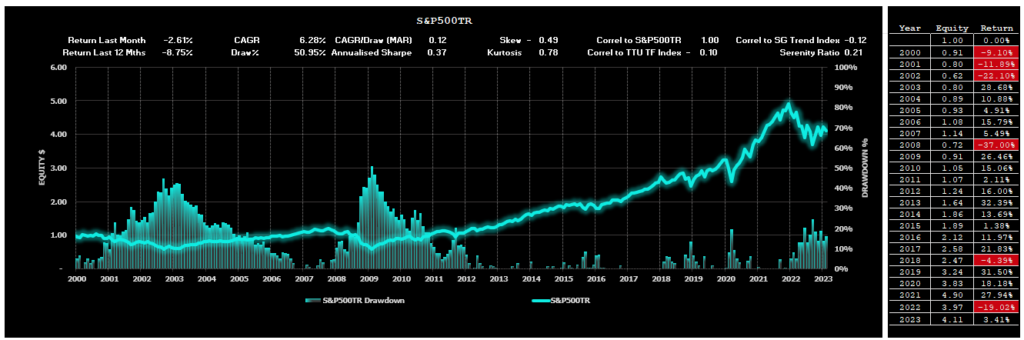
For the period from 1st January 2000 to 28th February 2023, the TTU TF Index has produced a Compound Annual Growth Rate of 8.27% with a Maximum Drawdown of 18.04% (Refer to Figure 6 above). This compares very favourably against the performance of the S&P500 Total Return Index (includes dividends) which has produced a Compound Average Growth Rate of 6.28% with a Maximum Drawdown of 50.95% over the same period (Refer to Figure 7 below).
TTU Trend Barometer
The TTU Trend Barometer is currently reading 41 and has improved from its more subdued trend reading of 34 last month. This is also reflected by the improved performance of the Trend Following Indexes for the month.
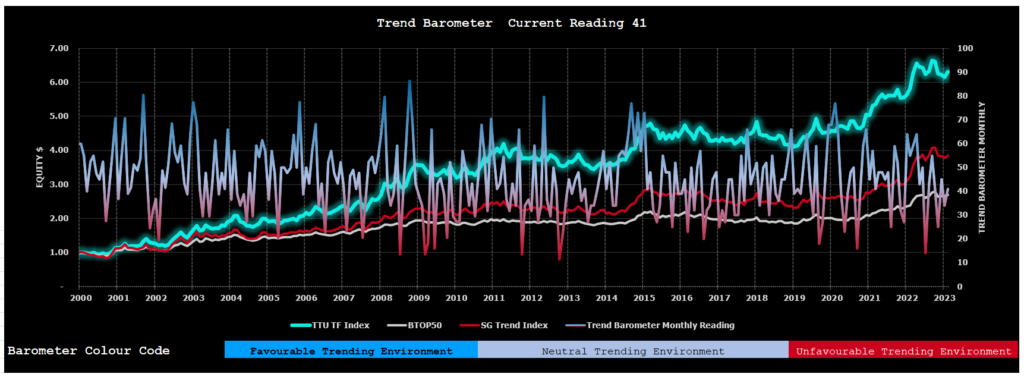
The Trend Barometer is a proprietary tool we use at TTU to assess the trend strength of a diversified portfolio consisting of 44 markets across all sectors. We firstly subdivide the trend strength of each market of a hypothetical diverse portfolio into five ranges from strong up, medium up, neutral, medium down and strong down. We then aggregate these results into a single portfolio number which we use to describe the overall trend strength across a hypothetical Program portfolio.
We then arbitrarily divide this percentage range into 3 where a value of 0-30 is considered a very unfavourable market regime for trend following Programs, a range between 30 to 55 is a somewhat neutral environment for Trend Following Programs (but not an environment where you could expect consistent performance) and values more than 55 are considered to be a favourable regime towards Trend Following Programs, where they should see good performance.
This method is surprisingly powerful in describing CTA monthly performance and can be used to connect market trading environments to resultant Manager performance.
February 2023 Macro Environment
For a blow-by-blow macro wrap for the month, we recommend you listen to our weekly systematic investor series by clicking on the links below. It is also worthwhile listening to our past catalogue as it provides you with an understanding of how these markets can shape the emotions of a Trader and why it is therefore essential that Trend Followers adopt systematic rules-based processes to keep these emotions in check.
You can find all of our weekly conversations by clicking this link.
Top Traders Unplugged Trend Following Program (TTU TF Program)
You may have noticed that in the Systematic Investor Series I have have in the past mentioned my proprietary system which I traded before my involvement with DUNN. I have taken my listeners under the hood to better understand the thinking behind the design process of this trend following model in the following episodes:
- 120 Systematic Investor Series – January 2nd, 2021; and
- 121 Systematic Investor Series – January 6th, 2021.
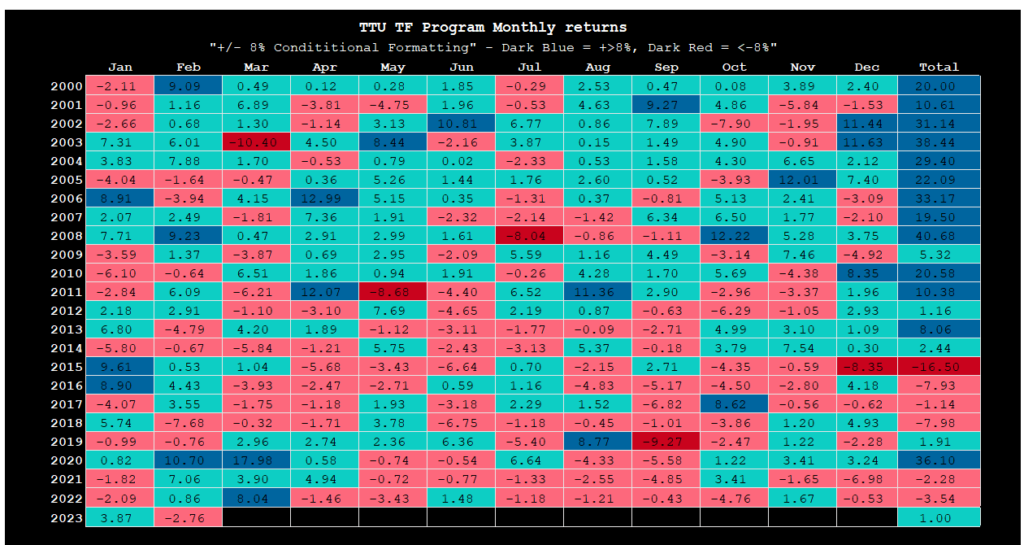
The TTU Trend Following Program is also a kind of experiment for me, as I decided not to make any changes to the design or parameters in the program since about 2013, to see how a medium-term trend following strategy would perform without any new research and improvements.
We have continued to track the performance of this trend following model on an ‘after fee’ NAV basis simply to provide a context for my listeners to understand how the performance of this classic trend following model (albeit not as long-term as others) performs against other, perhaps more recent Trend Following Programs whose methods have ‘drifted’ away from the traditional Trend Following roots.
Despite a difficult drawdown period between May 2015 to Feb 2019, the TTU Trend Following model continues to perform during market regimes that are more volatile and uncertain, although in 2022, its shorter-term models (Group 3), have had a difficult time.
February 2023 saw the TTU Trend Following Program post a decline of -2.76% bringing the YTD result to 1.00% increasing the current Drawdown to 17.04% (Refer to Figure 9 and Figure 10).
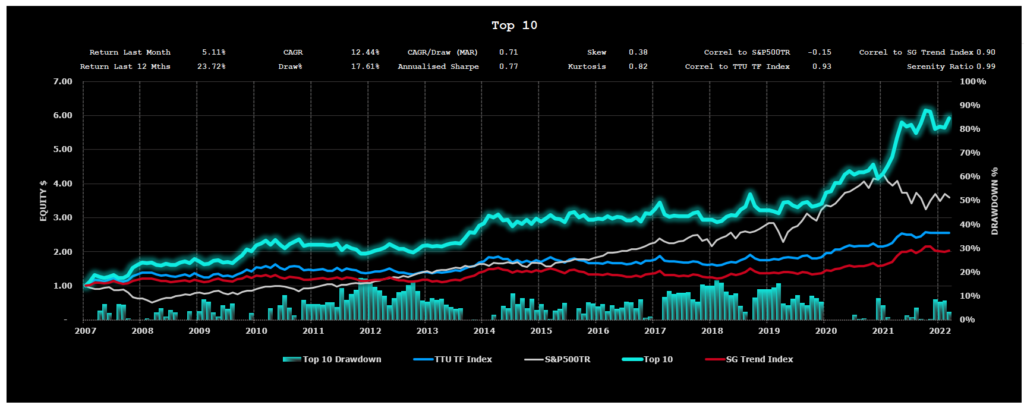
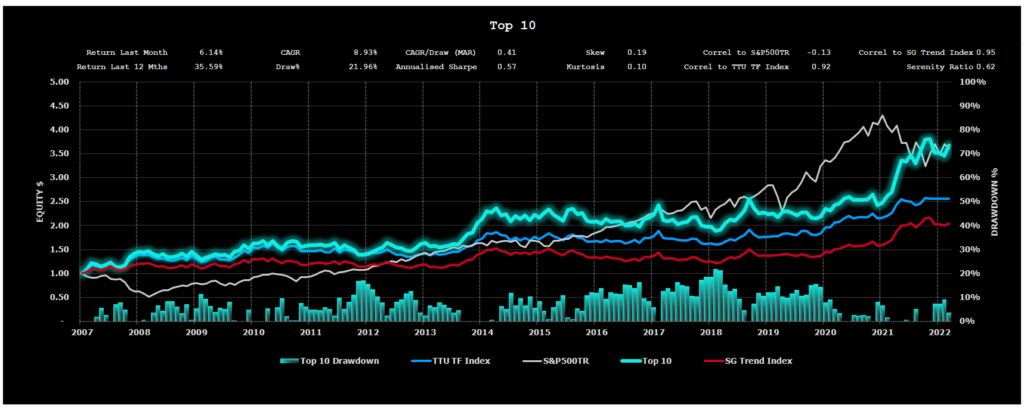
Blend of the Month (Top 10 Trend Following Ensemble) with Hind-Sight Bias
The ‘Blend of the Month’ showcases the optimal ensemble of 10 Trend Following Programs in terms of Risk Adjusted Return (using MAR) which is selected from our TTU TF Index using data from 1st January 2000 to the reporting month.
We use an algorithm to iterate through the monthly performance results of each Program in the Index over the long-term and collate the optimal blend.
Without further ado, the Blend of the Month for the period 1st January 2000 to 28th February 2023 is as follows.
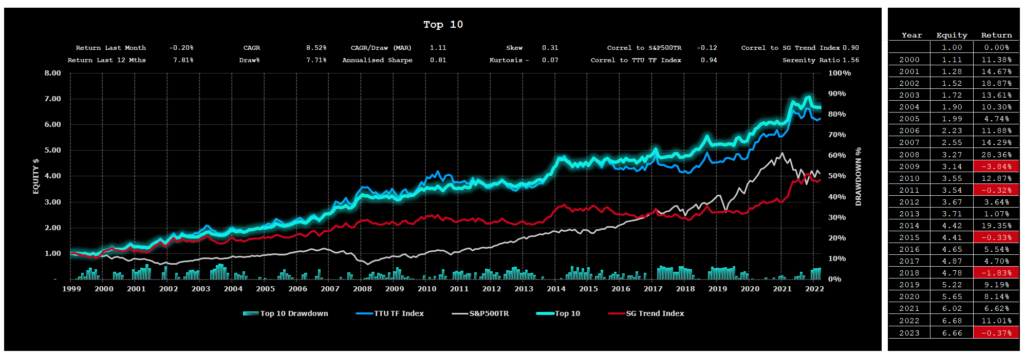
This Blend of the month is simply used to illustrate how an ensemble of 10 Trend Following Programs with a long-term track record could theoretically be chosen using the benefit of hindsight to produce stunning performance results with little volatility.
In practice however we do not have the benefit of hindsight when selecting the Programs we wish to compile for an uncertain future.
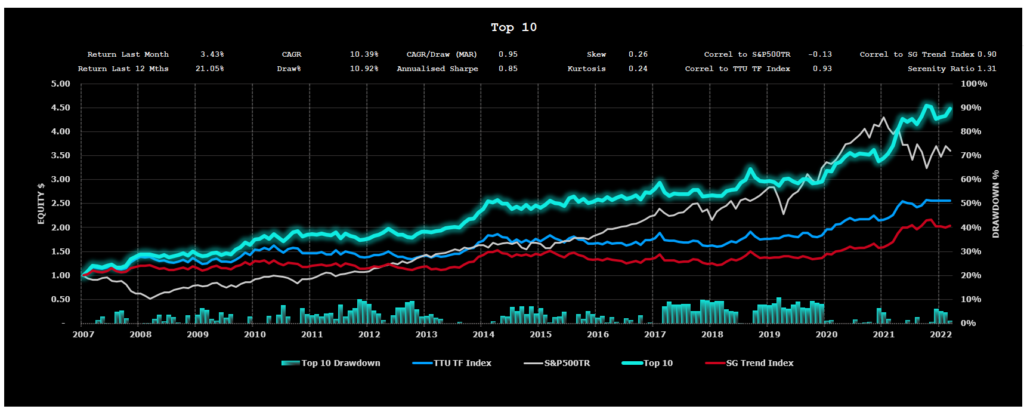
Blend of the Month (Top 10 Trend Following Ensemble) without Hind-Sight Bias
We do however have a process that can be adopted which converges towards the optimal solution with a 12-month lag that does not use hindsight bias.
The process does not use timing to select Programs for inclusion as timing methods can be problematic, but rather operates off the principle that Programs with a long-term track record of offering superior risk adjusted returns tend to do so going forward into the future. In other words, there is a degree of autocorrelation in the risk adjusted performance returns of those Programs with a long term validated track record.
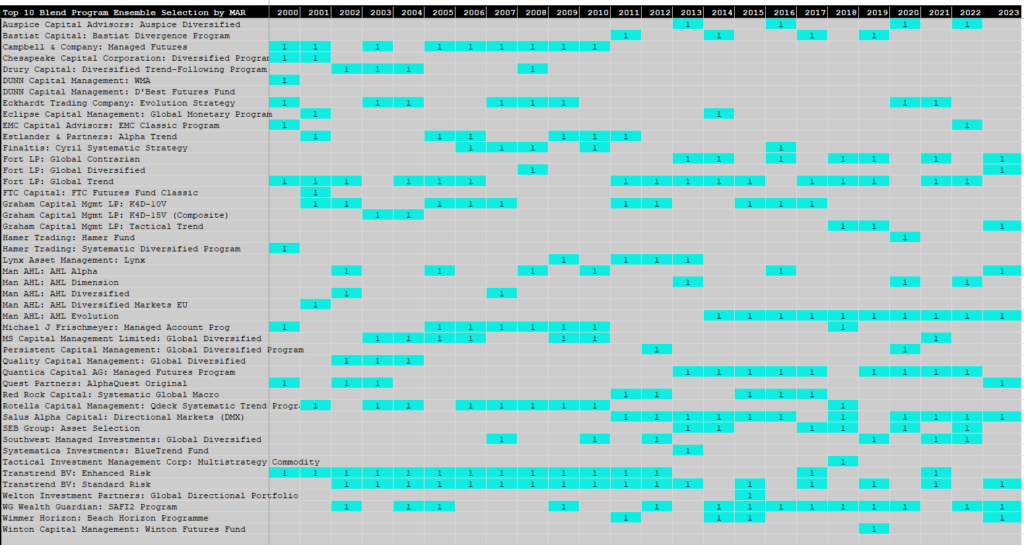
Our process uses Monthly Performance data for those Programs with at least a 15-year track record. Each year it then selects an optimal portfolio of 10 Programs from the available listing based on MAR of a composite of 10 possible Programs. We use an iteration process where we rank possible composites using 2,000,000 possible permutations of a 10 Programs drawn from the entire listing and then select the best performing composite in terms of MAR for the following unseen year.
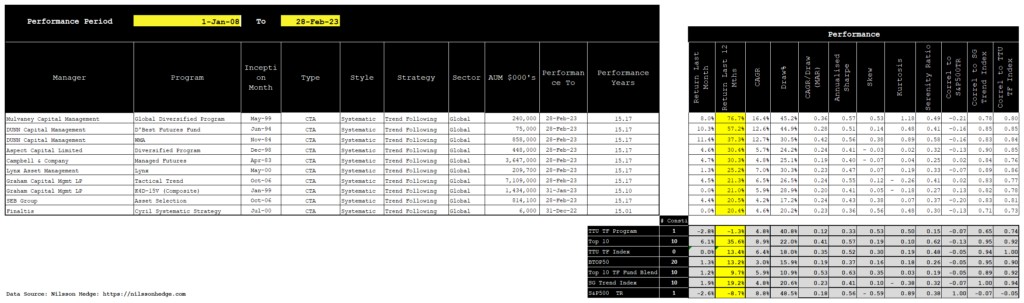
The Programs we have selected each year is described by the Table below. The listing of Programs we are using for the current unseen year are described in the 2023-year column of Figure 12 below. This Top 10 listing described in the 2023 column will remain in force until January 2024 when the selection process and rebalance will be undertaken for the 2024-year.
The consolidated performance results of this ‘optimal’ selection process undertaken each year is as follows:
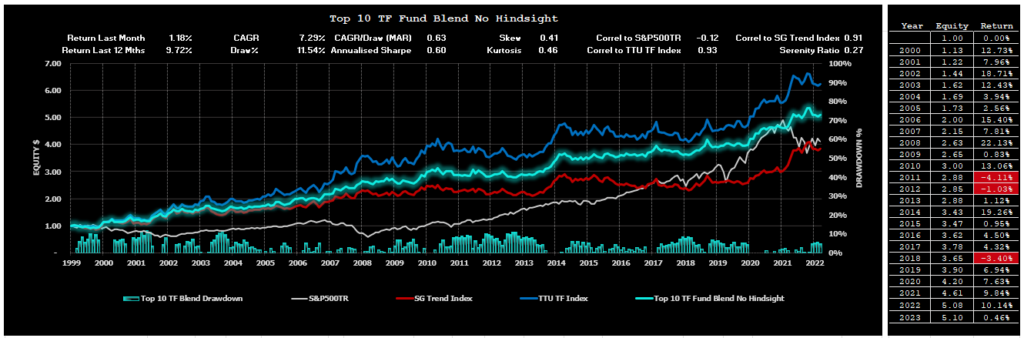
While overall performance results of Figure 13 are marginally inferior to the hypothetical ‘Blend of the Month’ (described in Figure 11) with slightly lower CAGR of 7.29% compared to 8.52% over the same reporting period and higher Drawdowns of 11.54% versus 7.71%, we can see how the overall performance metrics of the “non-cherry picked” blend converges towards (approaches) the ‘optimal’ portfolio solution in terms of risk adjusted performance.
Top 10 Lists
We have prepared the following Top 10 lists (excluding non-reporting Programs) for various performance categories based on monthly performance returns for a 15-year period commencing 1st January 2008 to the current month.
Top 10 Listing – by Compound Annual Growth Rate
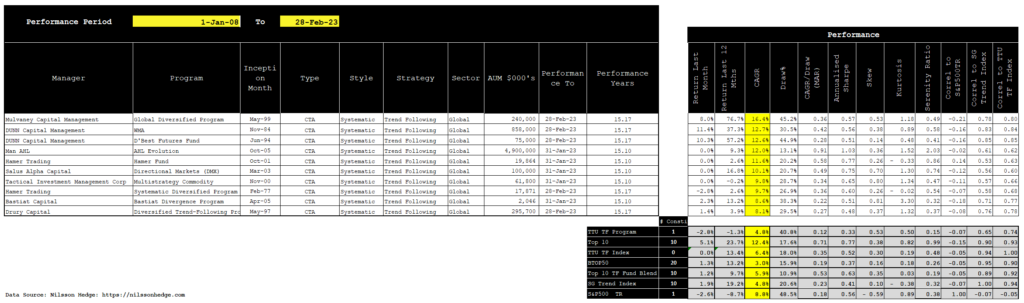
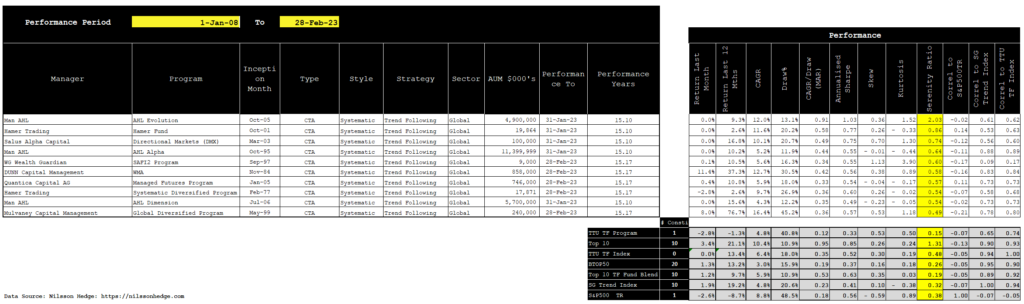
Top 10 Listing – by Risk Adjusted Return (Serenity Ratio)
Top 10 Listing – by Last 12 months Performance
Performance Results for the TTU Top 5 by Serenity Ratio
In a recent research project, we undertook at TTU, we examined three different allocation methods that could be deployed by an investor seeking to optimally allocate investment funds towards 5 of the Top ranked Globally Diversified Systematic Trend Following Programs with a long-term track record.
These three methods adopted 3 different forms of performance metric, namely:
- Top 5 Performers by Compound Annual Growth Rate (CAGR) using a rolling lookback of 15 years.
- Top 5 Performers by MAR ratio (CAGR/Max Draw%) using a rolling lookback of 15 years.
- Top 5 Performers by Serenity Ratio using a rolling lookback of 15 years.
The findings of our project can be obtained by clicking on this link.
Our research determined that the optimal selection method was the Serenity Ratio method.
The Performance for the month of February 2023 of our Top 5 Selection Method using the Serenity Ratio was an increase of 1.18% bring the YTD result to 0.46% (Refer to Figure 16).
For the entire reporting period, this selection method produces a CAGR of 4.98% with a Maximum Drawdown of only 14.44% and effectively a “zero” correlation to the S&P500TR Index (-0.07).
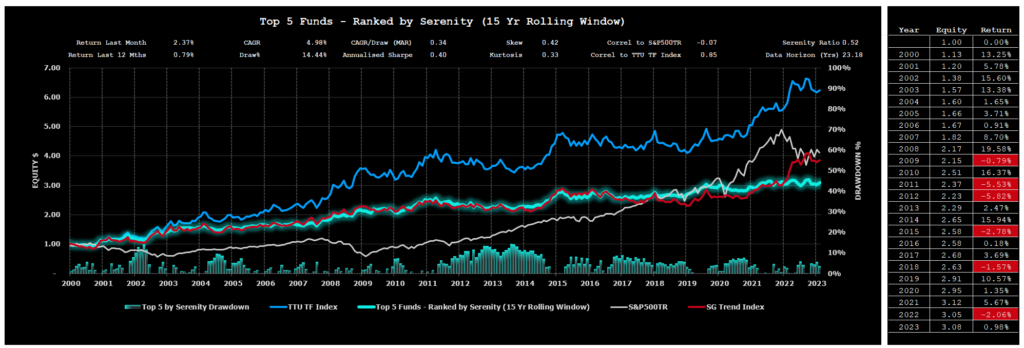
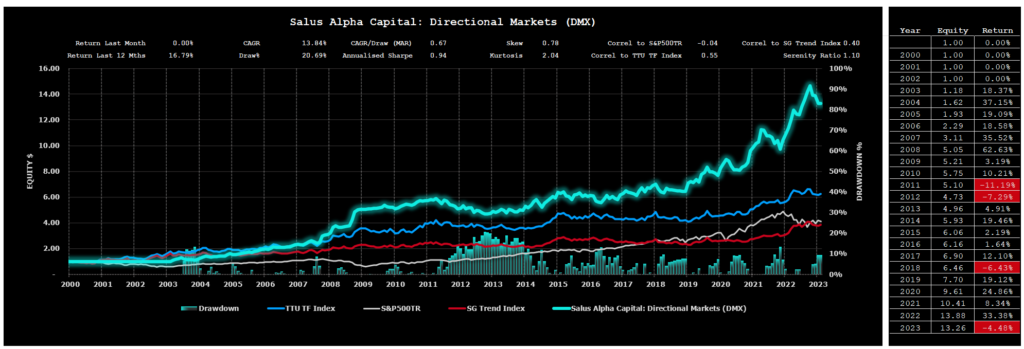
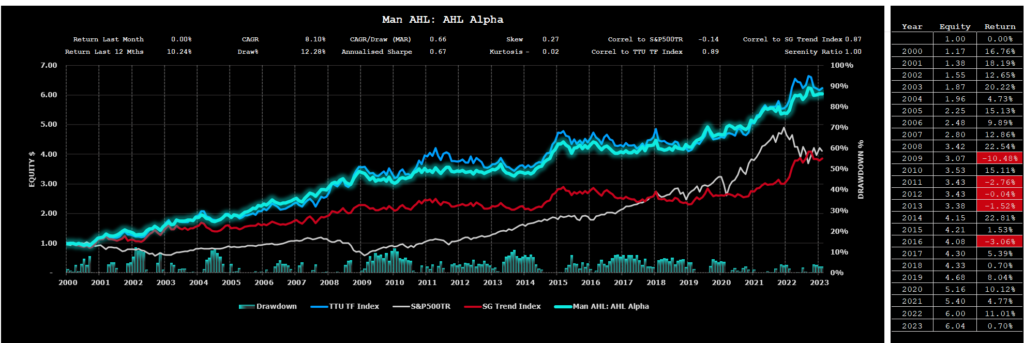
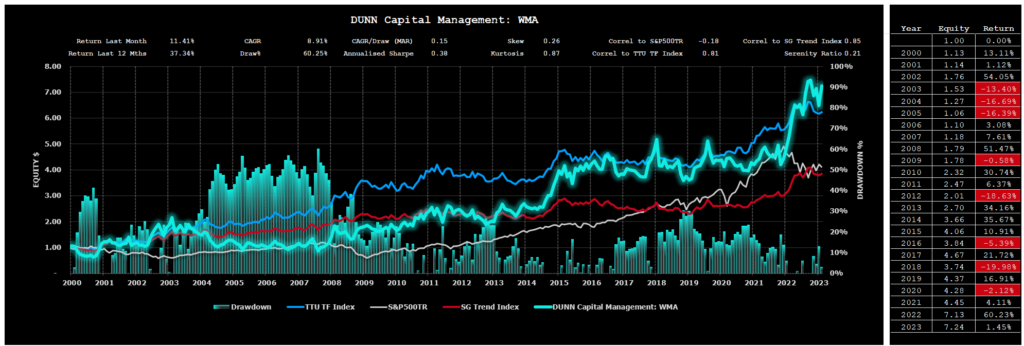
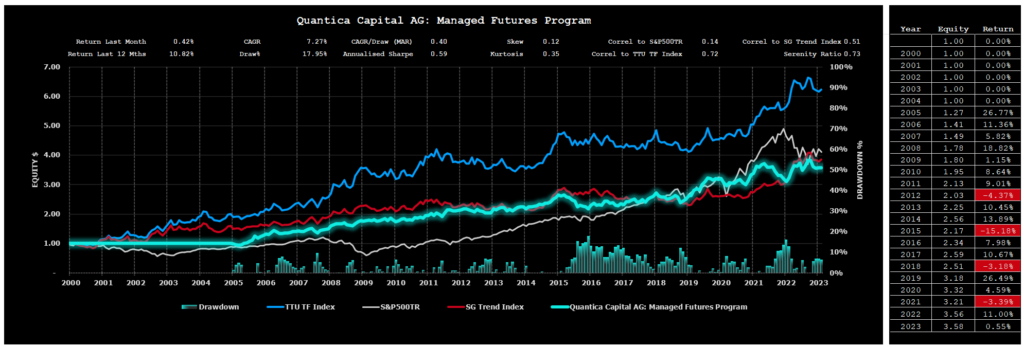
The current selection of Top 5 Funds that have been recommended by this research for the investment period between 1st February 2023 and 31st January 2024 are as follows:
- Man AHL: AHL Evolution;
- Salus Alpha Capital: Directional Markets (DMX);
- Man AHL: AHL Alpha;
- DUNN Capital Management: WMA Program; and
- Quantica Capital AG: Managed Futures Program.
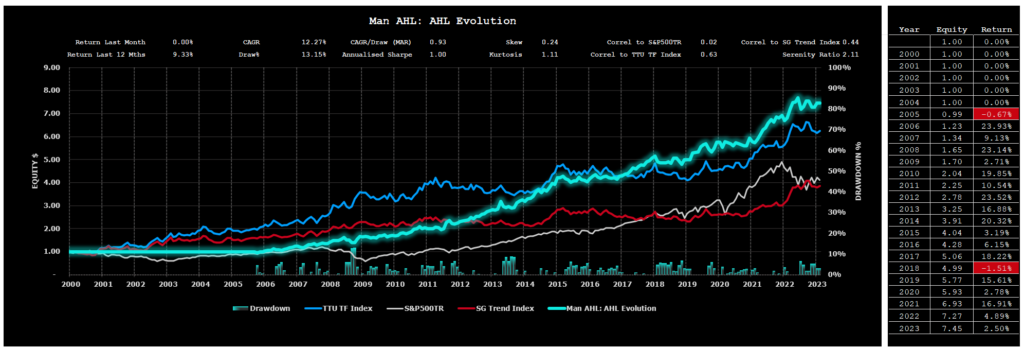
Individual Performance Results for these 5 Programs used for the Serenity allocation as of 28th February 2023 using the 2023 listing are as follows:
Performance Results for the Alternative 60/40 portfolio using the TTU Top 5 by Serenity Ratio
In our “How to Invest with the Best” blog post, we also highlighted the significant improved risk-adjusted performance results that could be achieved by replacing the 40% allocation to Bonds in the traditional 60/40 portfolio with an allocation of 40% towards the TTU Top 5 by Serenity ratio.
The evaluation compared the performance of a traditional 60% Equity/40% Bond portfolio against a 60% Equity/40% Serenity portfolio to highlight the uncorrelated historical nature of this Alternative 60/40 portfolio and demonstrate the benefits that a sizeable allocation towards the Serenity portfolio would bring to an investor if equity and bond markets go back to their historic relationship and become more positively correlated in the future. There is no guarantee that correlations remain static over time and it is possible that bond markets and equity markets may lose their uncorrelated relationship that has existed in the last 20 years or so. It is far less likely that the TF managers within the Serenity Grouping will ever be strongly positively correlated to the Equities market, over the long run, given the extensive global diversification and ability to go long and short, that is present within the constituents of the Serenity Grouping.
Chart 22 below showcases the comparative performance results for the period 1 January 2000 to the end of last month:
- A 100% investment in the S&P500TR portfolio;
- A 100% investment in the VBMFX which is a proxy for the bond market;
- A 100% investment in the VBIAX which is a suitable proxy for the classic 60% Equity/40% Bond portfolio;
- A 100% investment in a 60% S&P500TR 40% Serenity portfolio; and
- A 100% investment in the Serenity Portfolio.
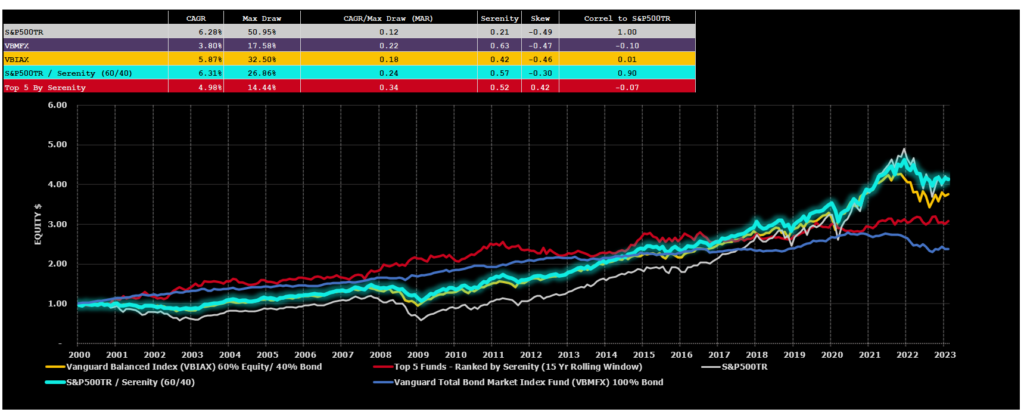
The comparison of alternative portfolio allocations above highlights the strong historic risk adjusted returns that have been enjoyed by 60% S&P500TR / 40% Serenity Composite Portfolio.
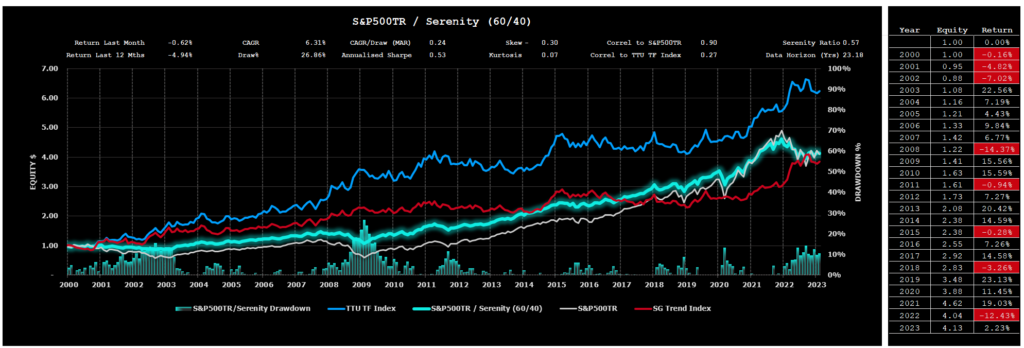
A more detailed assessment of this powerful 60/40 investment option is reflected in Chart 24 below.
Important Disclaimers
This document is directly solely to Accredited Investors, Qualified Eligible Participants, Qualified Clients and Qualified Purchasers. No investment decision should be made until prospective investors have read the detailed information in the fund offering documents of any manager mentioned in this document. This document is furnished on a confidential basis only for the use of the recipient and only for discussion purposes and is subject to amendment This document is neither advice nor a recommendation to enter into any transaction. This document is not an offer to buy or sell, nor a solicitation of an offer to buy or sell, any security or other financial instrument. This presentation is based on information obtained from sources that TopTradersUnplugged (“TTU”) (“considers to be reliable however, TTU makes no representation as to, and accepts no responsibility or liability for, the accuracy or completeness of the information. TTU has not independently verified third party manager or benchmark information, does not represent it as accurate, true or complete, makes no warranty, express or implied regarding it and shall not be liable for any losses, damages, costs or expenses relating to its adequacy, accuracy, truth, completeness or use.
All projections, valuations, and statistical analyses are provided to assist the recipient in the evaluation of the matters described herein. Such projections, valuations and analyses may be based on subjective assessments and assumptions and may use one among many alternative methodologies that produce different results accordingly, such projections, valuations and statistical analyses should not be viewed as facts and should not be relied upon as an accurate prediction of future events. There is no guarantee that any targeted performance will be achieved Commodity trading involves substantial risk of loss and may not be suitable for everyone
TTU is not and does not purport to be an advisor as to legal, taxation, accounting, financial or regulatory matters in any jurisdiction. The recipient should independently evaluate and judge the matters referred to herein. TTU does not provide advice or recommendations regarding an investor’s decision to allocate to funds or accounts managed by any manager (“or to maintain or sell investments in funds or accounts managed by any manager, and no fiduciary relationship under ERISA is created by the investor investing in funds or accounts managed by any manager, or through any communication between TTU and the investor
In reviewing this document, it should be understood that the past performance results of any asset class, or any investment or trading program set forth herein, are not necessarily indicative of any future results that may be achieved in connection with any transaction. Any persons subscribing for an investment must be able to bear the risks involved and must meet the suitability requirements relating to such investment. Some or all alternative investment programs discussed herein may not be suitable for certain investors This document is directed only to persons having professional experience in matters relating to investments. Any investment or investment activity to which this document relates is available only to such investment professionals. Persons who do not have professional experience in matters relating to investments should not rely upon this document.
This document and its contents are proprietary information of TTU and may not be reproduced or otherwise disseminated in whole or in part without TTU’s prior written consent.
This document contains simulated or hypothetical performance results that have certain inherent limitations AND SHOULD BE VIEWED FOR ILLUSTRATIVE PURPOSES. Unlike the results shown in an actual performance record, these results do not represent actual trading. HYPOTHETICAL PERFORMANCE RESULTS HAVE MANY INHERENT LIMITATIONS, SOME OF WHICH ARE DESCRIBED BELOW. NO REPRESENTATION IS BEING MADE THAT ANY ACCOUNT WILL OR IS LIKELY TO ACHIEVE PROFITS OR LOSSES SIMILAR TO THOSE SHOWN IN FACT, THERE ARE FREQUENTLY SHARP DIFFERENCES BETWEEN HYPOTHETICAL PERFORMANCE RESULTS AND THE ACTUAL RESULTS SUBSEQUENTLY ACHIEVED BY ANY PARTICULAR INVESTMENT ACCOUNT.
ONE OF THE LIMITATIONS OF HYPOTHETICAL PERFORMANCE RESULTS IS THAT THEY ARE GENERALLY PREPARED WITH THE BENEFIT OF HINDSIGHT IN ADDITION, HYPOTHETICAL TRADING DOES NOT INVOLVE FINANCIAL RISK, AND NO HYPOTHETICAL TRADING RECORD CAN COMPLETELY ACCOUNT FOR THE IMPACT OF FINANCIAL RISK IN ACTUAL TRADING FOR EXAMPLE, THE ABILITY TO WITHSTAND LOSSES OR TO ADHERE TO A PARTICULAR TRADING PROGRAM OR OTHER ASSET.
There are numerous other factors related to the markets in general or to the implementation of any specific trading program which cannot be fully accounted for in the preparation of hypothetical performance results and all of which can adversely affect actual trading results. No representation is being made that any investment will or is likely to achieve profits or losses similar to those being shown.
Most Comprehensive Guide to the Best Investment Books of All Time

Most Comprehensive Guide to the Best Investment Books of All Time
Get the most comprehensive guide to over 600 of the BEST investment books, with insights, and learn from some of the wisest and most accomplished investors in the world. A collection of MUST READ books carefully selected for you. Get it now absolutely FREE!
Get Your FREE Guide HERE!