


Trend Following Performance Report — January, 2022
Overview
Well, here we are now in 2022. The new year brings a different story to the familiar story of perpetually increasing US Equity Indexes which has hypnotized so many speculators. January brings a ‘shock to the system’ that reminds us all, that these financial markets have the ability to rock our intuition about how these markets can, at the turn off a pin, shatter our predictive tendencies.
But before we get to the monthly wrap there is a bit of housekeeping to do in our reporting process as the New Year brings in some changes.
In last year’s monthly reports, we used Nilsson Hedge performance data of CTA’s to report on the performance of long-term trend followers spanning at least a 15-year interval prior to 31 December 2021. This therefore included a listing that we used for our Index construction of the TTU TF Index that comprised 151 Programs.
This year we have tightened our selection criteria to only include those Programs with at least a 15-year unbroken record.
The minimum 15-year lookback requirement now only includes 59 Programs for our reporting processes. This therefore excludes Programs that have enjoyed only a few years in the sun during the long-term lookback interval, and more faithfully reflects the importance of this 15-year robustness measure, which we use as a basis to choose from ‘sustainable’ Programs that have stood the test of time.
In addition to this change we also need to select and report on the Programs that meet the criteria of the Serenity selection for 2022. We will discuss this later in this report when we review the performance results for this powerful investment allocation.
So, we have lots to discuss in this Monthly report so let’s get stuck into it.
January 2022 Trend Performance Summary
January brings a strong start to the TopTradersUnplugged Trend Following Index (“TTU TF”) which posted a solid 1.61 % performance for the month. This is off the back of 3 years of positive performance. May the joy continue for Trend Following.
Not bad considering the -5.17% decline in the S&P500TR Index for the month. Our non-correlated relationship with US Equity Indexes can offer distinct benefits at times.
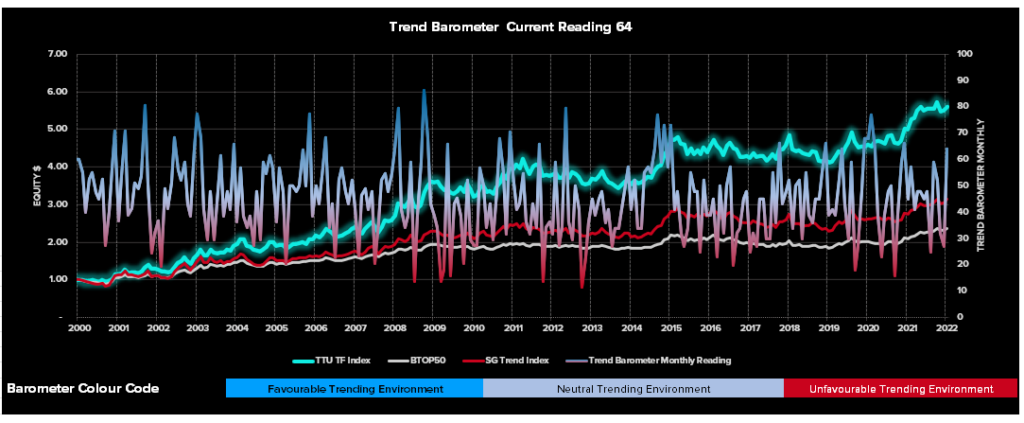
The TTU Trend Barometer is also reflecting strong trending conditions with a current reading of 64 which is well above its prior month reading of 27. Looks like the ‘surf’s up’ folks.
The Trend Barometer is a proprietary tool we use at TTU to assess the trend strength of a diversified portfolio consisting of 44 markets across all sectors. We firstly subdivide the trend strength of each market of a hypothetical diverse portfolio into five ranges from strong up, medium up, neutral, medium down and strong down. We then aggregate these results into a single portfolio number which we use to describe the overall trend strength across a hypothetical Program portfolio.
We then arbitrarily divide this percentage range into 3 where a value of 0-30 is considered a very unfavourable market regime for trend following Programs, a range between 30 to 55 is a somewhat neutral environment for Trend Following Programs (but not an environment where you could expect consistent performance) and values more than 55 are considered to be a favourable regime towards Trend Following Programs, where they should see good performance.
This method is surprisingly powerful in describing CTA monthly performance and can be used to connect market trading environments to resultant Manager performance.
Monthly Market Wrap
The 2021 year ended with equity highs. In fact, in 2021 there were about 70 all time new highs in the S&P500 but when you dig into the constituents of the Index, the story becomes murkier as the Indexes themselves were dominated by a handful of top performing stocks. The average stock for the S&P is almost 12% below it’s year high. So perhaps all is not good. This is also being reflected in the bond markets that are selling off quite dramatically since August 2021.
There is an ominous dark cloud now hanging over the markets and may signal a very uncertain year ahead. Will the classic 60/40 Equity/Bond portfolio come under heavy attack?
Mid-month we started to see more high inflation numbers emerge which continued to put pressure on bond yields. Equities were put under pressure, and we saw some good trends emerging in the energy sector and soft commodities sector. With rates already rising and the Fed laying the foundations to lift interest rates soon it has been interesting to see how the market has been punishing the new ‘equity darlings’ and rewarding the ‘equity stalwarts’.
Warren Buffett has been making a comeback with Berkshire Hathaway reaching new highs while Cathy Woods ‘Ark’ funds have been punished with drawdowns exceeding 50%. Perhaps investors are starting to adopt more prudent valuation metrics?
The third week of the month saw a continuation of the US Equities decline testing lows not experienced since March 2020. Despite the equity decline, bonds stayed fairly steady while in Europe yields drifted higher on expectations of higher inflation. According to many, inflation is no longer being considered a temporary phenomenon and is expected to stay elevated for a protracted period.
The end of the month saw the Fed continue to pursue emergency monetary policy suggesting that the Fed was attempting to manipulate the yield curve lower as opposed to letting market forces play out. With consumers expecting higher inflation it appears that the battle continues between what the market anticipates and what the Fed wants. China Equities followed US Equities in their overall declines entering bear market territory. With these ominous clouds, many pundits are anticipating a significant forthcoming correction referring to the post 2008 rising equity valuations as a ‘super bubble’.
For a blow-by-blow description of what was moving for the month, then you can always listen to our weekly systematic investor series by clicking on the links below. It is worthwhile listening to our past catalogue as it provides you with an understanding of how these markets can shape the emotions of a Trader and why it is therefore essential that Trend Followers adopt systematic rules-based processes to keep these emotions in check.
- 174 Systematic Investor Series ft Alan Dunne - January 10th, 2022
- 175 Systematic Investor Series ft Rob Carver - January 16th, 2022
- 176 Systematic Investor Series ft Richard Brennan - January 23rd, 2022
- 177 Systematic Investor Series ft Mark Rzepczynski - January 31st, 2022
Top Traders Unplugged Trend Following Index (TTU TF Index) Performance
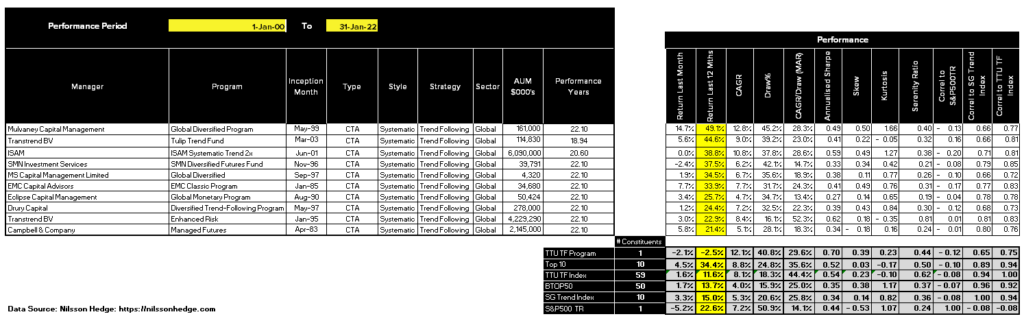
Using the excellent and free public sources of Fund Manager return data provided by Nilsson Hedge we create a Trend Following Index comprising those Programs which meet our definition of Globally Diversified Systematic Trend Following Programs. To meet this definition a Program must be:
- Geographically diversified across a broad array of asset classes that include soft commodities, energies, metals, bonds, fixed income, foreign exchange, and equities;
- Fully systematic in nature using quantitative rules-based processes for entry and exit decisions;
- Possess at least a 15-year unbroken track record up to the current month; and
- Adopt Trend Following trading techniques as the dominant investment strategy within the Program.
Having identified those Programs that meet this definition, we then create an Index by monthly rebalancing with equal weighting and cheekily refer to it as the TTU TF Index. Our Index comprises a total of 59 Programs over the Performance monitoring period from 1 January 2000 to the current month of 31st January 2022.
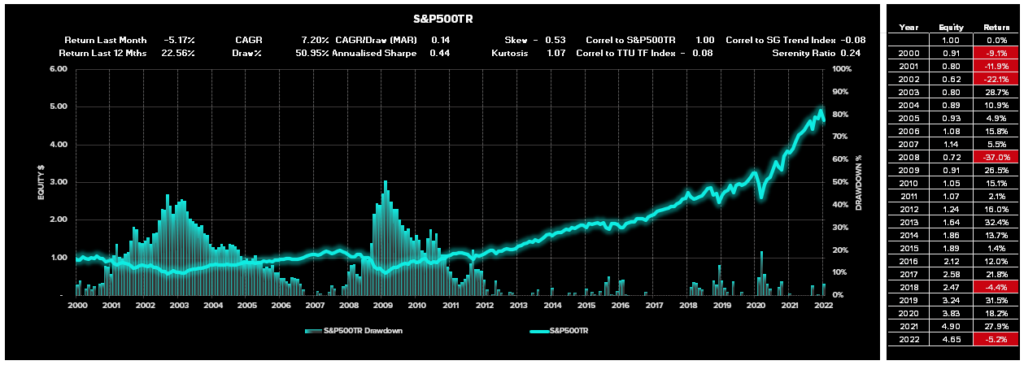
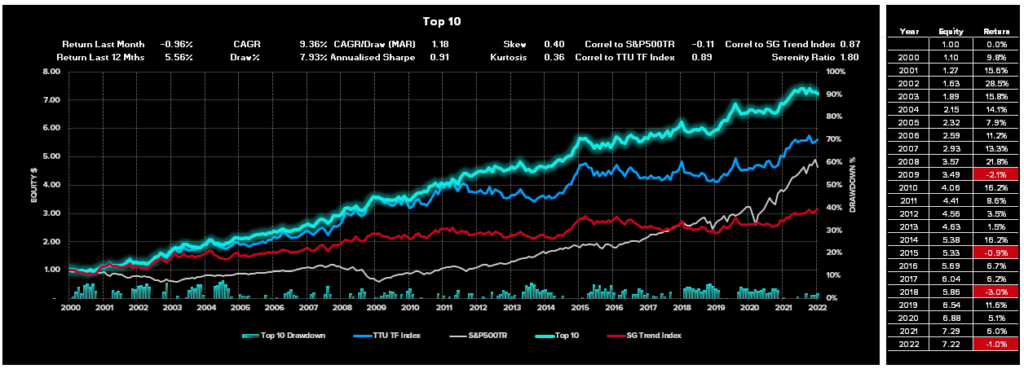
For the period from 1st January 2000 to 31st January 2022, the TTU TF Index has produced a Compound Annual Growth Rate of 8.10% with a Maximum Drawdown of 18.26% (Refer to Chart 1). This compares very favourably against the performance of the S&P500 Total Return Index (includes dividends) which has produced a Compound Average Growth Rate of 7.20% with a Maximum Drawdown of 50.95% over the same period (Refer to Chart 2).
For the month of January 2022, The TTU TF Index increased by 1.61%. Alternative Trend Following Indexes (Refer to Chart 1) such as the Barclays Top 50 Index (BTOP50) and the Société Générale Trend Index (SG Trend Index) also experienced increases of 1.67% and 3.32% respectively for the month.
Chart 1 – TTU TF Index Performance
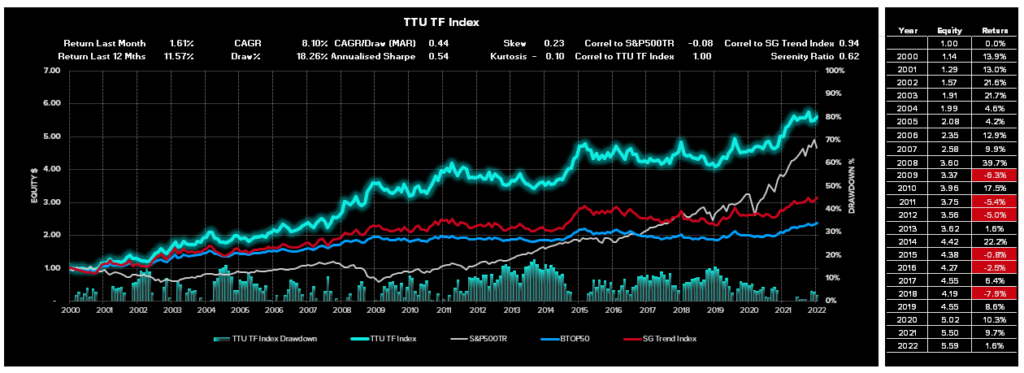
Chart 2– S&P500TR Index Performance
Top Traders Unplugged Trend Following Program (TTU TF Program)
You may have noticed that recently in the Systematic Investor Series I have been showcasing my proprietary system which I traded before my involvement with DUNN. I have taken my listeners under the hood to better understand the thinking behind the design process of this trend following model in the following episodes:
- 120 Systematic Investor Series – January 2nd, 2021; and
- 121 Systematic Investor Series – January 6th, 2021.
We have continued to track the performance of this trend following model on an ‘after fee’ NAV basis simply to provide a context for my listeners to understand how the performance of this classic trend following model performs against other, perhaps more recent Trend Following Programs whose methods have ‘drifted’ away from the traditional Trend Following roots.
Despite a difficult drawdown period between May 2015 to Feb 2019, the TTU Trend Following model continues to perform strongly during market regimes that are more volatile and uncertain.
January saw a negative month of -2.09% unlike the major Trend Following Indexes which all experienced positive performance. This discrepancy can be attributed to the prevalence of short-term Trend Following models in the TTU TF Program and the relative absence of short-term programs in the established TF Indexes like the TTU TF Index, SG Trend Index and BTOP 50 Index.
Chart 3 – TTU TF Program Performance
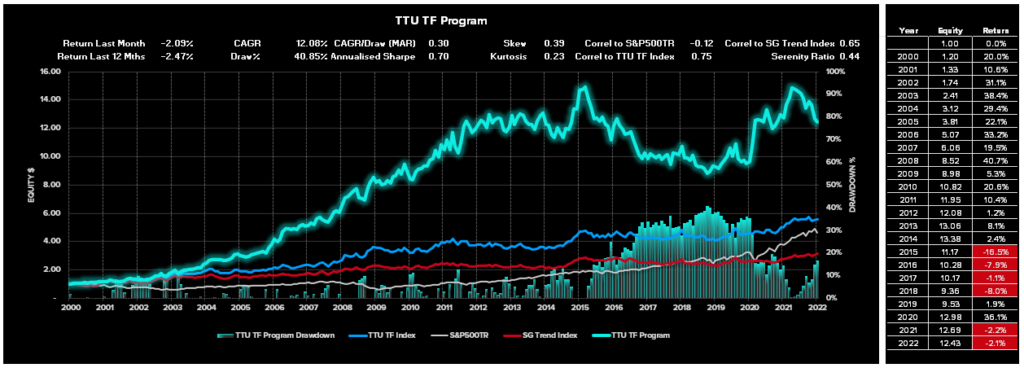
Table 1 – TTU TF Program Monthly Returns

Top 10 Lists
We have prepared the following Top 10 lists for various performance categories based on monthly performance returns for the reporting period 1st January 2000 to 31st January 2022.
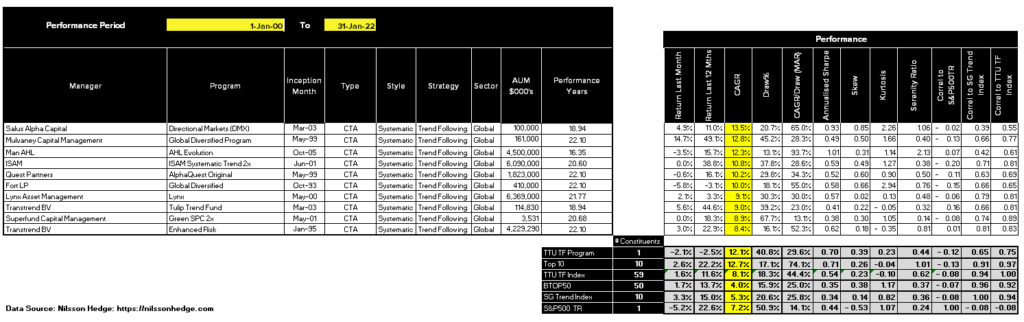
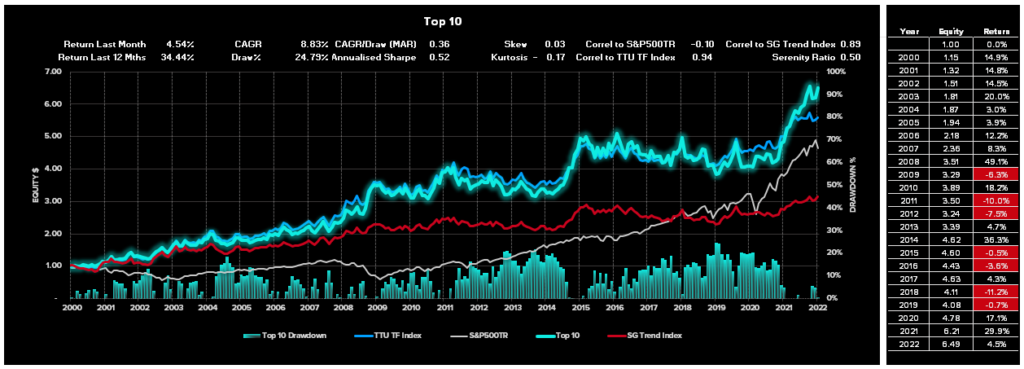
1. Top 10 Listing – by Compound Annual Growth Rate
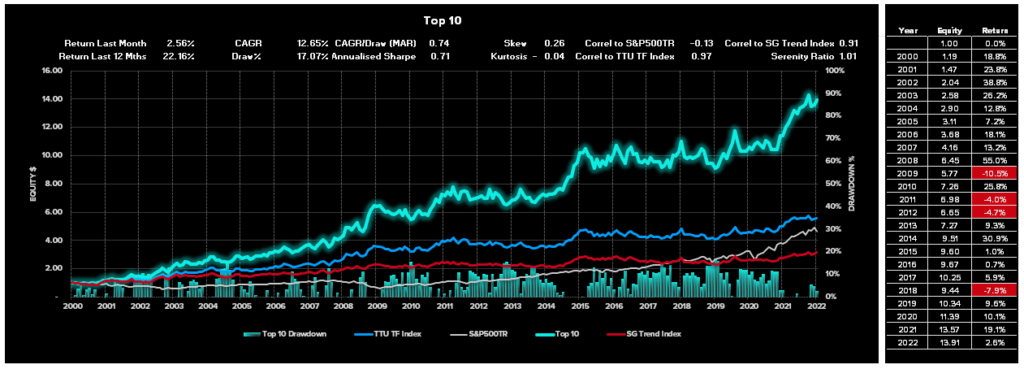
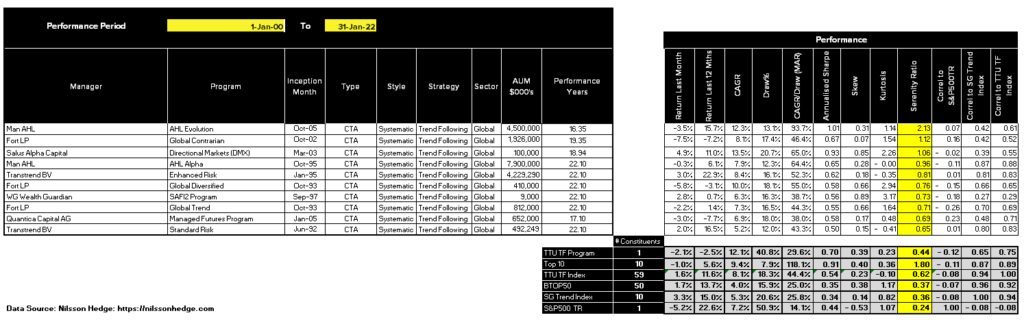
2. Top 10 Listing – by Risk Adjusted Return (Serenity Ratio)
3. Top 10 Listing – by Last 12 months Performance
Performance Results for the TTU Top 5 by Serenity Ratio
In a recent research project, we undertook at TTU, we examined three different allocation methods that could be deployed by an investor seeking to optimally allocate investment funds towards 5 of the Top ranked Globally Diversified Systematic Trend Following Programs with a long-term track record.
These three methods adopted 3 different forms of performance metric, namely:
- Top 5 Performers by Compound Annual Growth Rate (CAGR) using a rolling lookback of 15 years.
- Top 5 Performers by MAR ratio (CAGR/Max Draw%) using a rolling lookback of 15 years.
- Top 5 Performers by Serenity Ratio using a rolling lookback of 15 years.
The findings of our project can be obtained by clicking on this link.
Our research determined that the optimal selection method was the Serenity Ratio method.
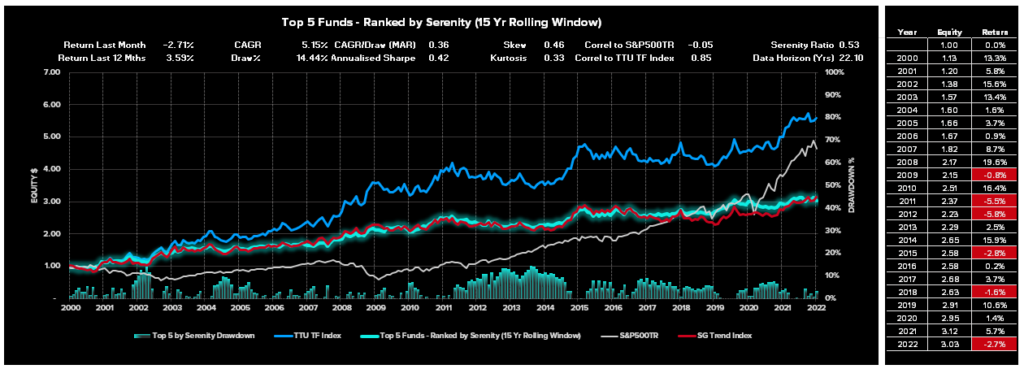
The Performance for the month of January 2022 of our Top 5 Selection Method using the Serenity Ratio was an decline of -2.71% bringing the prior 12 months return to a result of 3.59% (Refer to Chart 4). The ‘Serenity’ selection method continues to perform exceptionally well from a risk-adjusted perspective. For the entire reporting period, this selection method boasts a CAGR of 5.15% with a Maximum Drawdown of only 14.44% and effectively a “zero” correlation to the SRP500TR Index (-0.05).
Chart 4 – Performance Results of the Top 5 Allocation Method (Serenity Ratio)
Now in our research paper we explained how we undertake our Serenity selection process using a 15-year lookback at 12-month intervals. Given that we now have the performance results for the last 12 months, our 15-year lookback now needs to include these results and we need to update our process.
Please note that given we received this data in late January, we need to update our Serenity selection for the period 1st February 2022 to 31st January 2023. This means that for the month of January 2022, we are using the same Serenity selection as that used in 2021.
- Furthermore, we need to remind ourselves of the criteria we use to select Programs for our Serenity allocation as the criteria are different to that used for our monthly reporting process. So as a reminder, we use the following criteria for our Serenity selection comprising those Programs that meet the following definition:
- Are currently active Programs;
- Possess at least a 15-year track record;
- Have at least $100M AUM;
- Are globally diversified and invest across a broad array of asset classes;
- Are fully systematic in nature using quantitative rules-based processes for entry and exit decisions;
- Adopt Trend Following trading techniques as the dominant investment strategy within the Program;
- Offer pooled Onshore and/or Offshore investment vehicles; and
- Allow for a Minimum investment of $100K.
So, with a drum roll we can announce the Serenity selection that we will be using for the next 12 months commencing 1st February 2022.
The Top 5 Funds that we will be using for our Serenity allocation for the investment period between 1st February 2022 and 31st January 2023 are as follows:
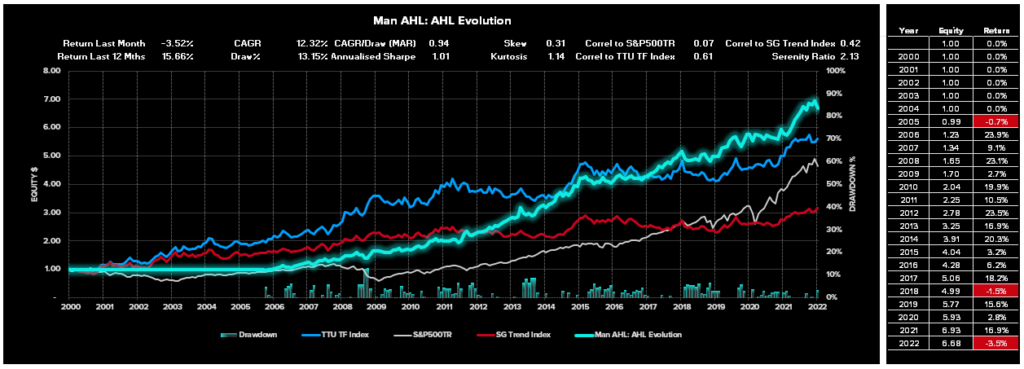
- Man AHL: AHL Evolution;
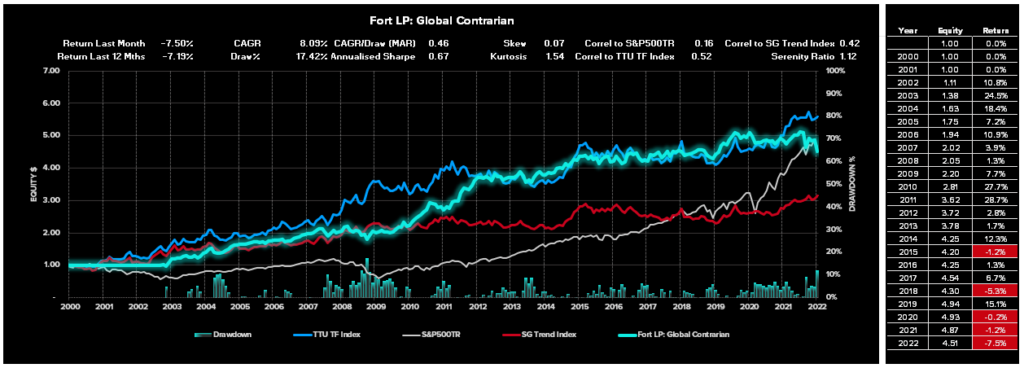
- Fort LP: Global Contrarian;
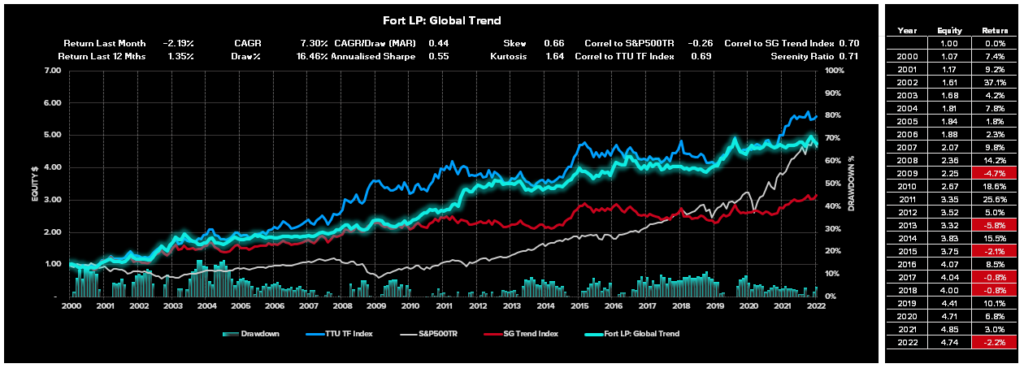
- Fort LP: Global Trend
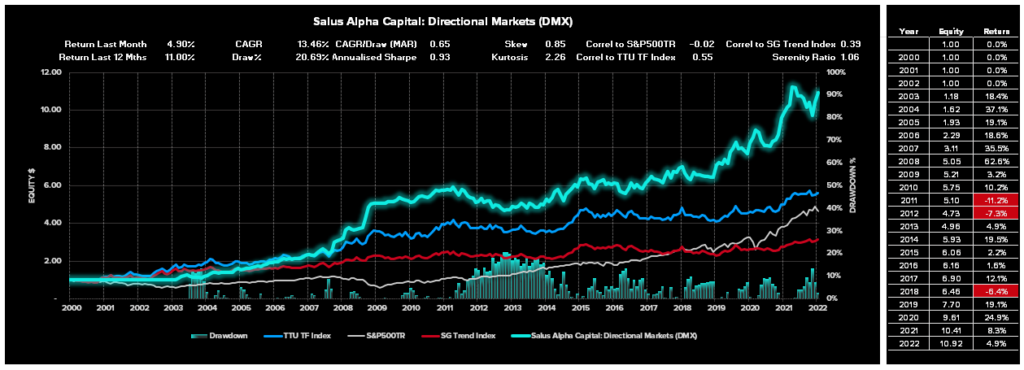
- Salus Alpha Capital: Directional Markets (DMX); and
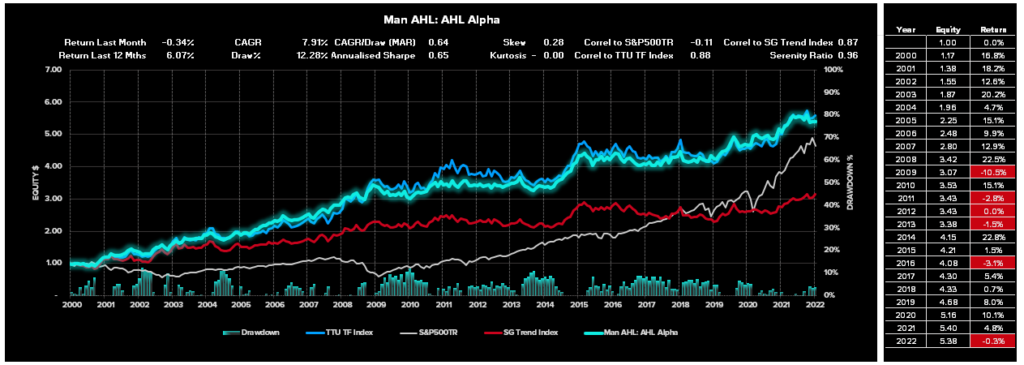
- Man AHL: Alpha
So how does this compare to our prior selection used for the period 1st February 2021 to 31st January 2022? Here was the prior listing.
- Man AHL: AHL Evolution;
- Fort LP: Global Contrarian;
- Salus Alpha Capital: Directional Markets (DMX);
- Fort LP: Global Diversified; and
- Fort LP: Global Trend.
Apart from a bit of a reshuffle in ranking the list essentially stays the same with the exception of Man AHL: Alpha which replaces Fort LP: Global Diversified.
That is the beauty of this Serenity selection process, we find that our selection remains consistent for long periods of time unlike other methods that through their rebalancing process introduces significant randomness into the process.
Individual Performance Results for these 5 Programs used for the Serenity allocation for the period 1st February 2022 to 31st January 2023 are as follows:
Performance Results for the Alternative 60/40 portfolio using the TTU Top 5 by Serenity Ratio
In our “How to Invest with the Best” blog post, we also highlighted the significant improved risk-adjusted performance results that could be achieved by replacing the 40% allocation to Bonds in the traditional 60/40 portfolio with an allocation of 40% towards the TTU Top 5 by Serenity ratio.
The evaluation compared the performance of a traditional 60% Equity/40% Bond portfolio against a 60% Equity/40% Serenity portfolio to highlight the uncorrelated historical nature of this Alternative 60/40 portfolio and demonstrate the benefits that a sizeable allocation towards the Serenity portfolio would bring to an investor if equity and bond markets go back to their historic relationship and become more positively correlated in the future. There is no guarantee that correlations remain static over time and it is possible that bond markets and equity markets may lose their uncorrelated relationship that has existed in the last 20 years or so. It is far less likely that the TF managers within the Serenity Grouping will ever be strongly positively correlated to the Equities market, over the long run, given the extensive global diversification and ability to go long and short, that is present within the constituents of the Serenity Grouping.
Chart 5 below showcases the comparative performance results for the period 1st January 2000 to 31st January 2022 of:
- A 100% investment in the S&P500TR portfolio
- A 100% investment in the VBIAX which is a suitable proxy for the classic 60% Equity/40% Bond portfolio
- A 100% investment in a 60% S&P500TR 40% Serenity portfolio and
- A 100% investment in the Serenity Portfolio
Chart 5 – Comparative Performance Results of Various Portfolio Allocations
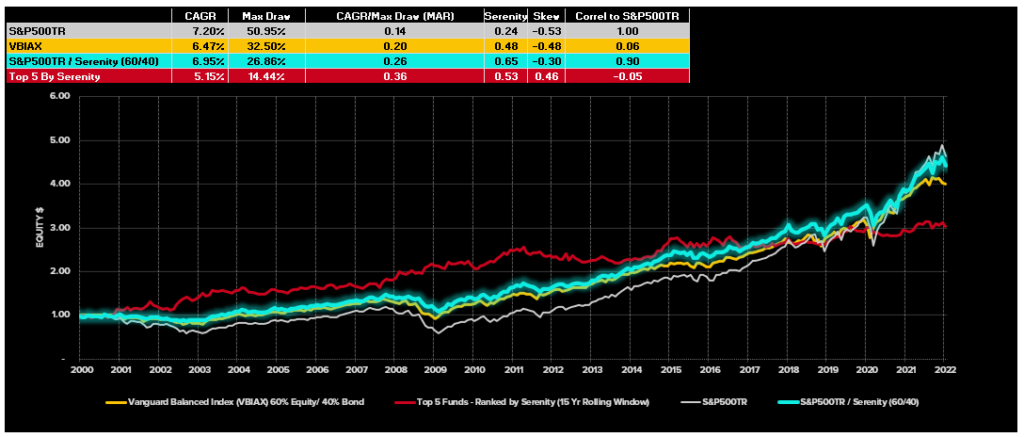
The comparison of alternative portfolio allocations above highlights the strong historic risk adjusted returns that have been enjoyed by 60% S&P500TR / 40% Serenity Composite Portfolio.
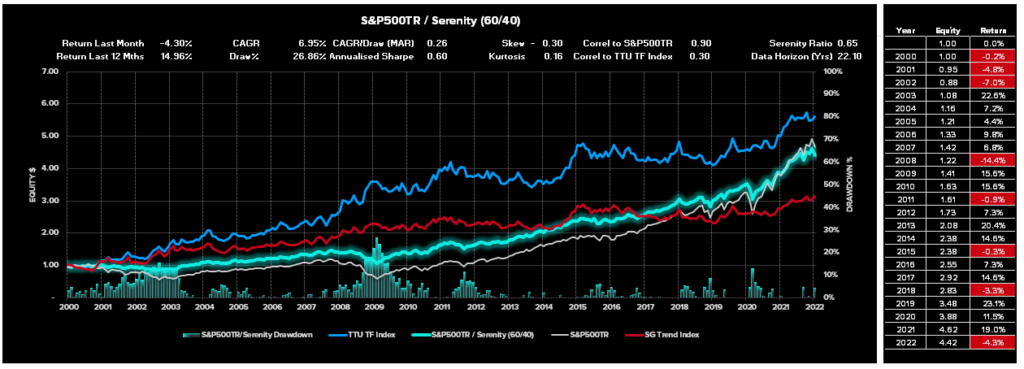
A more detailed assessment of this powerful 60/40 investment option is reflected in Chart 6 below.
Chart 6 – Performance Results for the 60% S&P500TR/ 40% Serenity Composite
Important Disclaimers
This document is directly solely to Accredited Investors, Qualified Eligible Participants, Qualified Clients and Qualified Purchasers. No investment decision should be made until prospective investors have read the detailed information in the fund offering documents of any manager mentioned in this document. This document is furnished on a confidential basis only for the use of the recipient and only for discussion purposes and is subject to amendment This document is neither advice nor a recommendation to enter into any transaction. This document is not an offer to buy or sell, nor a solicitation of an offer to buy or sell, any security or other financial instrument. This presentation is based on information obtained from sources that TopTradersUnplugged (“TTU”) (“considers to be reliable however, TTU makes no representation as to, and accepts no responsibility or liability for, the accuracy or completeness of the information. TTU has not independently verified third party manager or benchmark information, does not represent it as accurate, true or complete, makes no warranty, express or implied regarding it and shall not be liable for any losses, damages, costs or expenses relating to its adequacy, accuracy, truth, completeness or use.
All projections, valuations, and statistical analyses are provided to assist the recipient in the evaluation of the matters described herein. Such projections, valuations and analyses may be based on subjective assessments and assumptions and may use one among many alternative methodologies that produce different results accordingly, such projections, valuations and statistical analyses should not be viewed as facts and should not be relied upon as an accurate prediction of future events. There is no guarantee that any targeted performance will be achieved Commodity trading involves substantial risk of loss and may not be suitable for everyone
TTU is not and does not purport to be an advisor as to legal, taxation, accounting, financial or regulatory matters in any jurisdiction. The recipient should independently evaluate and judge the matters referred to herein. TTU does not provide advice or recommendations regarding an investor’s decision to allocate to funds or accounts managed by any manager (“or to maintain or sell investments in funds or accounts managed by any manager, and no fiduciary relationship under ERISA is created by the investor investing in funds or accounts managed by any manager, or through any communication between TTU and the investor
In reviewing this document, it should be understood that the past performance results of any asset class, or any investment or trading program set forth herein, are not necessarily indicative of any future results that may be achieved in connection with any transaction. Any persons subscribing for an investment must be able to bear the risks involved and must meet the suitability requirements relating to such investment. Some or all alternative investment programs discussed herein may not be suitable for certain investors This document is directed only to persons having professional experience in matters relating to investments. Any investment or investment activity to which this document relates is available only to such investment professionals. Persons who do not have professional experience in matters relating to investments should not rely upon this document.
This document and its contents are proprietary information of TTU and may not be reproduced or otherwise disseminated in whole or in part without TTU’s prior written consent.
This document contains simulated or hypothetical performance results that have certain inherent limitations AND SHOULD BE VIEWED FOR ILLUSTRATIVE PURPOSES. Unlike the results shown in an actual performance record, these results do not represent actual trading. HYPOTHETICAL PERFORMANCE RESULTS HAVE MANY INHERENT LIMITATIONS, SOME OF WHICH ARE DESCRIBED BELOW. NO REPRESENTATION IS BEING MADE THAT ANY ACCOUNT WILL OR IS LIKELY TO ACHIEVE PROFITS OR LOSSES SIMILAR TO THOSE SHOWN IN FACT, THERE ARE FREQUENTLY SHARP DIFFERENCES BETWEEN HYPOTHETICAL PERFORMANCE RESULTS AND THE ACTUAL RESULTS SUBSEQUENTLY ACHIEVED BY ANY PARTICULAR INVESTMENT ACCOUNT.
ONE OF THE LIMITATIONS OF HYPOTHETICAL PERFORMANCE RESULTS IS THAT THEY ARE GENERALLY PREPARED WITH THE BENEFIT OF HINDSIGHT IN ADDITION, HYPOTHETICAL TRADING DOES NOT INVOLVE FINANCIAL RISK, AND NO HYPOTHETICAL TRADING RECORD CAN COMPLETELY ACCOUNT FOR THE IMPACT OF FINANCIAL RISK IN ACTUAL TRADING FOR EXAMPLE, THE ABILITY TO WITHSTAND LOSSES OR TO ADHERE TO A PARTICULAR TRADING PROGRAM OR OTHER ASSET.
There are numerous other factors related to the markets in general or to the implementation of any specific trading program which cannot be fully accounted for in the preparation of hypothetical performance results and all of which can adversely affect actual trading results. No representation is being made that any investment will or is likely to achieve profits or losses similar to those being shown.
Most Comprehensive Guide to the Best Investment Books of All Time

Most Comprehensive Guide to the Best Investment Books of All Time
Get the most comprehensive guide to over 600 of the BEST investment books, with insights, and learn from some of the wisest and most accomplished investors in the world. A collection of MUST READ books carefully selected for you. Get it now absolutely FREE!
Get Your FREE Guide HERE!