


Trend Following Performance Report — January, 2024

Overview
So here we are in January 2024 and a new year is upon us where we find ourselves immersed immediately in some great trending opportunities. This stands in stark contrast to our performance in 2023 where performance for the industry was about break-even.
The financial landscape at the start of 2024 was marked by a cautious optimism, tempered by historical trends, narratives and potential economic indicators suggesting a period of subdued market movements for the first half of 2024. However, the reality unfolded quite differently. January and into early February as we write this report saw powerful market trends across commodities, cryptocurrencies, and equities, leading to fruitful outcomes for those engaged in trend-following strategies.
This divergence between expectations and reality serves as a poignant reminder of the complex interplay of factors that influence market dynamics. Economic growth, political events, and unforeseen global incidents all contribute to the fluidity of financial markets, often rendering even the most well-founded predictions obsolete.
The limitations of predictive models have been starkly highlighted in this context. Faced with unprecedented scenarios and significant market shifts, traditional forecasting methods have struggled to provide accurate guidance. This unpredictability underscores the importance of adaptability and diversification in investment strategies. Relying solely on forecasts can expose investors to significant risks, as the financial landscape can change rapidly, driven by new developments and changing narratives.
Unlike traditional investment approaches that often rely on forecasting future market movements, trend followers focus on identifying and capitalizing on existing market trends. This approach eschews the need for predictions, instead relying on algorithms and trading systems designed to detect the beginnings and ends of market trends.
The core philosophy of trend following — letting market actions dictate trading decisions — is particularly relevant in today's unpredictable financial environment. It emphasizes the importance of systematic trading rules and risk management, allowing investors to navigate market volatility and leverage opportunities presented by unexpected market shifts.
There is a vital insight found in the inability to forecast the future of trend-following strategies: the future is inherently uncertain, and adaptability is key. Trend-following models continuously evolve in response to changing market conditions, making any attempt at precise forecasting a futile endeavour. Instead of trying to predict the future, we should embrace the principle of "I don't know what the future will bring," recognizing the value of flexibility and the ability to respond to the market as it evolves.
January and into early February 2024 not only reflects on the unexpected turns in the financial markets of early 2024 but also offers a broader perspective on the nature of market predictions and the strategic mindset required to navigate such uncertainties successfully.
Of course, the new year also brings change to many of the Indexes and processes we have outlined in this monthly report. January is the time for rebalancing the SG Trend Index and some of our inhouse Indexes such as our Serenity selection for 2024 and the Top 10 Ensemble Blend of Trend Followers.
Here we say goodbye to some of the underperformers for 2023 and say hello to some new entrants into our processes who have managed to enter these Indexes and processes through the most recent performance. So without further ado, let's now turn our attention to the specifics of the January monthly report…
To commence the year, the TTU TF Index witnessed a modest uptick, recording a gain of 0.73%. The BTOP 50 Index also saw a positive monthly performance of 1.30% as did the SG Trend Index with a monthly performance of 1.18%.
SG Trend Index
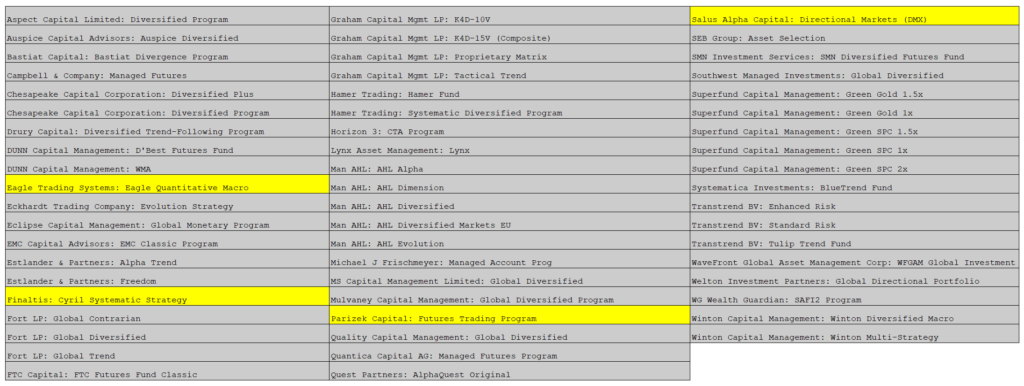
The SG Trend Index is designed to track the 10 largest trend following CTA’s of the managed futures space.
Criteria for inclusion in the Index as determined by Society Generale is as follows:
• Must trade primarily futures (including FX forwards);
• Must be broadly diversified across asset classes;
• Must be an industry recognized trend follower;
• Must exhibit significant correlation to trend following peers;
• Must be open the new investment; and
• Must report returns on a daily basis (net of fees).
The index currently is:
• Equally weighted;
• Calculated in base currency;
• Has an inception date of 1st January 2000;
• Rebalanced annually on 1st January; and
• Reconstituted annually on 1st January based on eligibility criteria.
There was a slight modification to the Index from January 2013 to the present. Previously the Programs needed to be a constituent of the SG CTA Index and the 10 largest Managers was not a requirement.
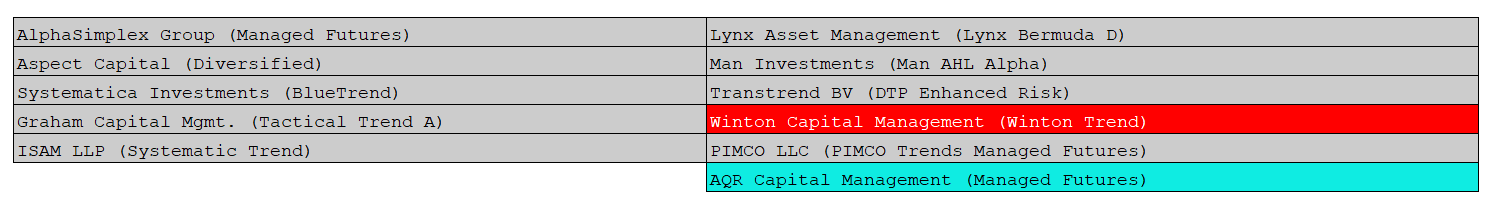
For the 2024 year following the rebalance of the Index we say goodbye to the Winton Trend Program and hello to the AQR Managed Futures Program. The listing of the 10 eligible programs in the Index for 2024 were as follows:
The performance of the SG Trend Index since 1st January 2000 to the end of last month is seen in Chart 2 below:
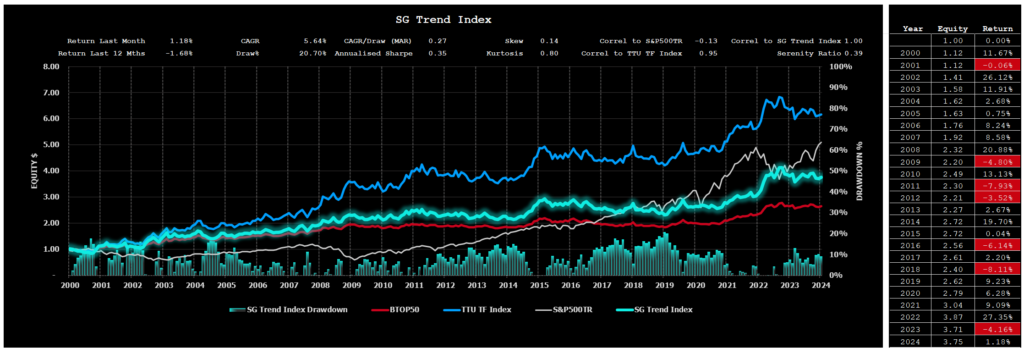
You will notice how the SG Trend Index is highly correlated with the BTOP50 Index and the TTU TF Index and uncorrelated with the S&P500TR Index.
Despite the high correlation between the various trend following Indexes, the long-term performance of these three Trend Following Indexes in terms of CAGR is different. The SG Trend Index plots between the BTOP50 Index and the TTU TF Index.
BTOP 50 Index
The BTOP50 Index seeks to replicate the overall composition of the managed futures industry with regards to trading style and overall market exposure. Unlike the SG Trend Index and the TTU TF Index, the BTOP50 is not strictly a trend following Index and is more broadly representative of the entire managed futures segment of which a dominant style is trend following. We like to think of the BTOP 50 as a ‘quasi trend following Index’ as opposed to a pure trend following Index.
Like the SG Trend Index, the BTOP50 Index is designed to track the performance of the largest Programs by AUM, however the Programs included may not be all Trend Following Programs. Criteria for inclusion in the Index as determined by Barclay Hedge is as follows:
Criteria for inclusion in the Index as determined by BarclayHedge is as follows:
• Must be a Program represented in the Barclay CTA Universe;
• In each Calendar year, the Programs selected must in aggregate be no less than 50% of the investable assets of the Barclay CTA Universe;
• The Programs must be open for investment;
• The Manager must be willing to provide Barclay Hedge with daily return performance;
• The Program must have at least two years of trading activity; and
• The Program’s advisor must have at least three years of operating history.
The index currently is:
• Equally weighted;
• Rebalanced annually on 1st January; and
• Reconstituted annually on 1st January based on eligibility criteria.
Despite the ’50’ tag in the BTOP 50 description, for 2022 there were 20 constituents and for 2023 there are now 21 funds in the Index.
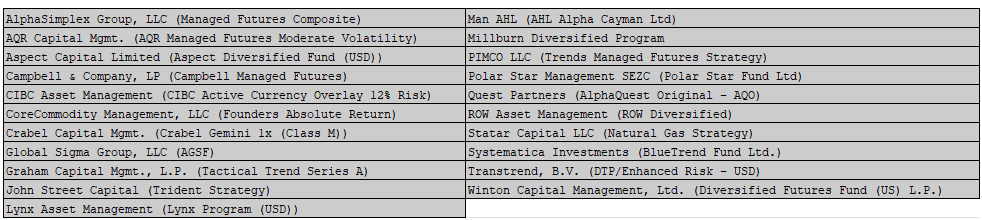
For 2023 the listing was as follows. We note that we are yet to receive the constituent listing of the BTOP50 for 2024 from Barclay Hedge.
The performance of the BTOP 50 Index since 1st January 2000 to to the end of last month is seen in Chart 4 below:
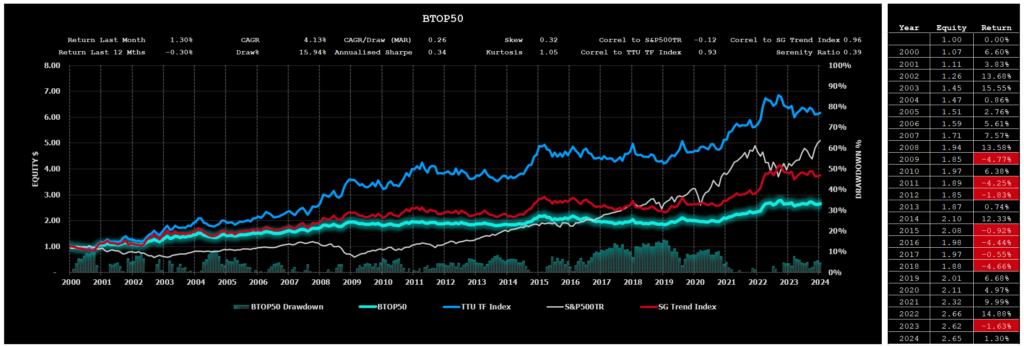
The BTOP 50 Index is highly correlated with the trend following Indexes of the SG Trend Index and the TTU TF Index, however its long-term performance is the lowest of the 3 Trend Following Indexes. While there is a significant representation of Trend Following Programs within the Index, the non-trend following Programs contribute to this diluted long-term performance.
TTU TF Index
The TTU TF Index has been developed by Top Traders Unplugged to provide a performance measure of the trend following programs with a long-term track record.
At TTU, we recognise the importance of a robust trading approach to these uncertain markets and feel that AUM is not a good robustness measure when it comes to assessing performance of the Trend Following industry. It is our strong opinion that the ultimate selection measure to apply in constituting a Trend Following Index is not AUM or a proxy risk metric such as the Sharpe, Sortino, MAR ratio, Ulcer Index or Serenity ratio. The superior metric to assess long-term performance is the long-term validated track record itself.
We have therefore developed a different method for constructing our TTU TF Index. The criteria for inclusion into our Index is as follows:
The criteria for inclusion into the TTU TF Index is as follows:
• Monthly performance results need to be captured in the Nilsson Hedge CTA database;
• Must be geographically diversified across asset classes;
• Must be fully systematic in nature using quantitative rules for entry and exit;
• Must possess at least a 15-year unbroken track record to the current reporting month;
• Must adopt trend following as their dominant investment strategy;
• Are currently active programs; and
• Must report performance monthly (net of fees).
The Index:
• Is Equally weighted;
• Is Rebalanced monthly;
• Is Reconstituted monthly;
• Has an inception date of 1st January 2000
As of January 31, 2024, the TTU TF Index, at the time of composing this report, encompasses outcomes from 54 Programs. The monthly return of the Index is derived from the average return of those Programs that have submitted their monthly reports. Currently, there are 58 active Programs in total, out of which 54 have reported for the month. The following Table highlights the 4 Programs that have yet to report for the month as of the date of this report.
The performance of the TTU TF Index since 1st January 2000 to to to the end of last month is as follows:
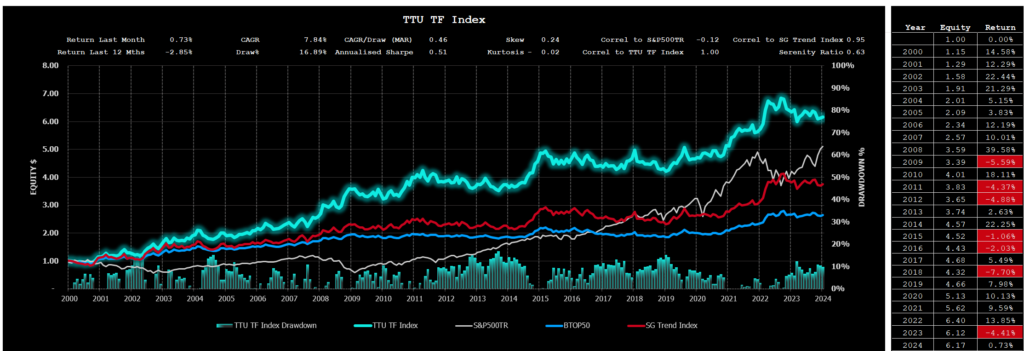
Now you might be intrigued by the performance result of the TTU TF Index. While it is highly correlated with the BTOP 50 Index and the SG Trend Index, we can see that long term performance of the TTU TF Index clearly outstrips alternative Index measures.
The dominant contributor of this outperformance is the requirement for any participating Program in the Index to have a long-term track record. You see, using AUM as a criterion for inclusion is not necessarily a useful selection criterion. While AUM reflects ‘market appeal’, it does not imply that this ‘market appeal’ is strongly correlated with ‘long term performance’.
Our process of Index construction gives us an insight into how any diversified ensemble of trend following Programs with a long-term track record approaches an optimal portfolio as we increase the number of Programs in the Index. Simply by diversifying into a large ensemble of Trend Following Programs with a long-term track record, we magically improve the Index result. CAGR is increased and our drawdowns are reduced.
Of course, we already know this ‘diversification’ principle of Trend Following. As we increase our diversification efforts, we obtain improvement both in terms of the maximum drawdown and in the CAGR generated by the ensemble. This is why we seek to strive for maximum market and system diversification within our individual programs. The TTU TF Index just takes this diversification one step further and diversifies across many different TF Programs to deliver a superior risk-adjusted result.
TTU TF Index Performance
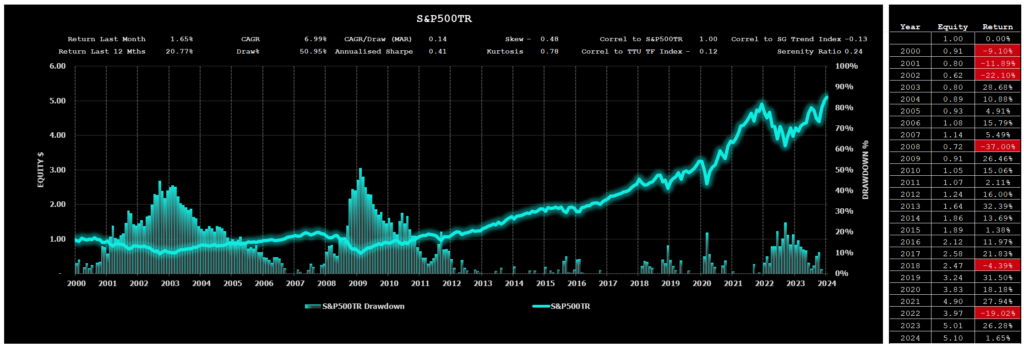
For the period from 1st January 2000 to 31st January 2024, the TTU TF Index has produced a Compound Annual Growth Rate of 7.84% with a Maximum Drawdown of 16.89% (Refer to Chart 6 above). This compares favorably against the performance of the S&P500 Total Return Index (includes dividends) which has produced a Compound Average Growth Rate of 6.99% with a Maximum Drawdown of 50.95% over the same period (Refer to the chart below).

TTU Trend Barometer
The TTU Trend Barometer saw a notable fall in its reading, declining from 77 in December to 25 in January, indicating a decline in trending conditions. However, this substantial decline in the barometer's reading did not directly translate into reduced performance outcomes for most of the trend following community. We believe this discrepancy can be attributed to the effects of short-term models in the Barometer which are highly sensitive to market conditions and in this instance, the short-term fluctuations in market conditions were not observed by trend followers with medium to long term models.
The Trend Barometer is a proprietary tool we use at TTU to assess the trend strength of a diversified portfolio consisting of 44 markets across all sectors. We firstly subdivide the trend strength of each market of a hypothetical diverse portfolio into five ranges from strong up, medium up, neutral, medium down and strong down. We then aggregate these results into a single portfolio number which we use to describe the overall trend strength across a hypothetical Program portfolio.
We then arbitrarily divide this percentage range into 3 where a value of 0-30 is considered a very unfavourable market regime for trend following Programs, a range between 30 to 55 is a somewhat neutral environment for Trend Following Programs (but not an environment where you could expect consistent performance) and values more than 55 are considered to be a favourable regime towards Trend Following Programs, where they should see good performance.
Aside from the occasional dispersed readings when compared to overall trend following performance this method is surprisingly powerful in describing CTA monthly performance and can be used to connect market trading environments to resultant Manager performance.
The Macro Environment
For a blow-by-blow macro wrap for the month, we recommend you listen to our weekly systematic investor series by clicking on the links below. It is also worthwhile listening to our past catalogue as it provides you with an understanding of how these markets can shape the emotions of a Trader and why it is therefore essential that Trend Followers adopt systematic rules-based processes to keep these emotions in check.
You can find all of our weekly conversations by clicking this link.
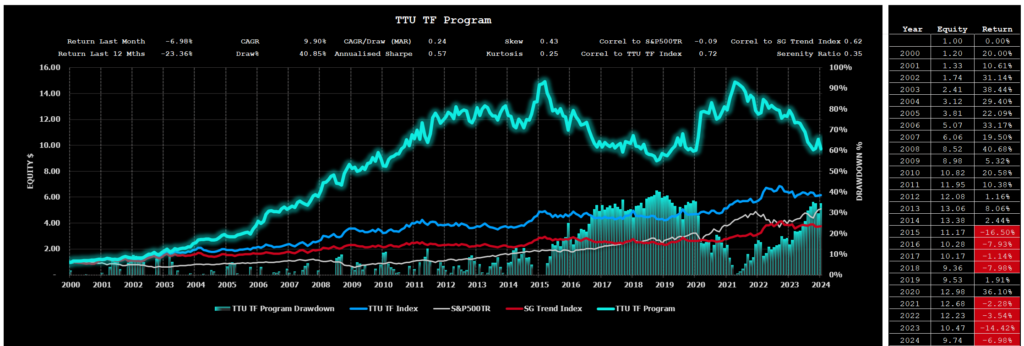
Top Traders Unplugged Trend Following Program (TTU TF Program)
You may have noticed that in the Systematic Investor Series I have have in the past mentioned my proprietary system which I traded before joining DUNN Capital Management. I have taken my listeners under the hood to better understand the thinking behind the design process of this trend following model in the following episodes:
- 120 Systematic Investor Series – January 2nd, 2021; and
- 121 Systematic Investor Series – January 6th, 2021.
The TTU Trend Following Program is also a kind of experiment for me, as I decided not to make any changes to the design or parameters in the program since about 2013, to see how a medium-term trend following strategy would perform without any new research and improvements.
We have continued to track the performance of this trend following model on an ‘after fee’ NAV basis simply to provide a context for my listeners to understand how the performance of this classic trend following model (albeit not as long-term as others) performs against other, perhaps more recent Trend Following Programs whose methods have ‘drifted’ away from the traditional Trend Following roots.
Despite a difficult drawdown period between May 2015 to Feb 2019, the TTU Trend Following model continues to perform during market regimes that are more volatile and uncertain, although in 2022, its shorter-term models (Group 3), have had a difficult time.
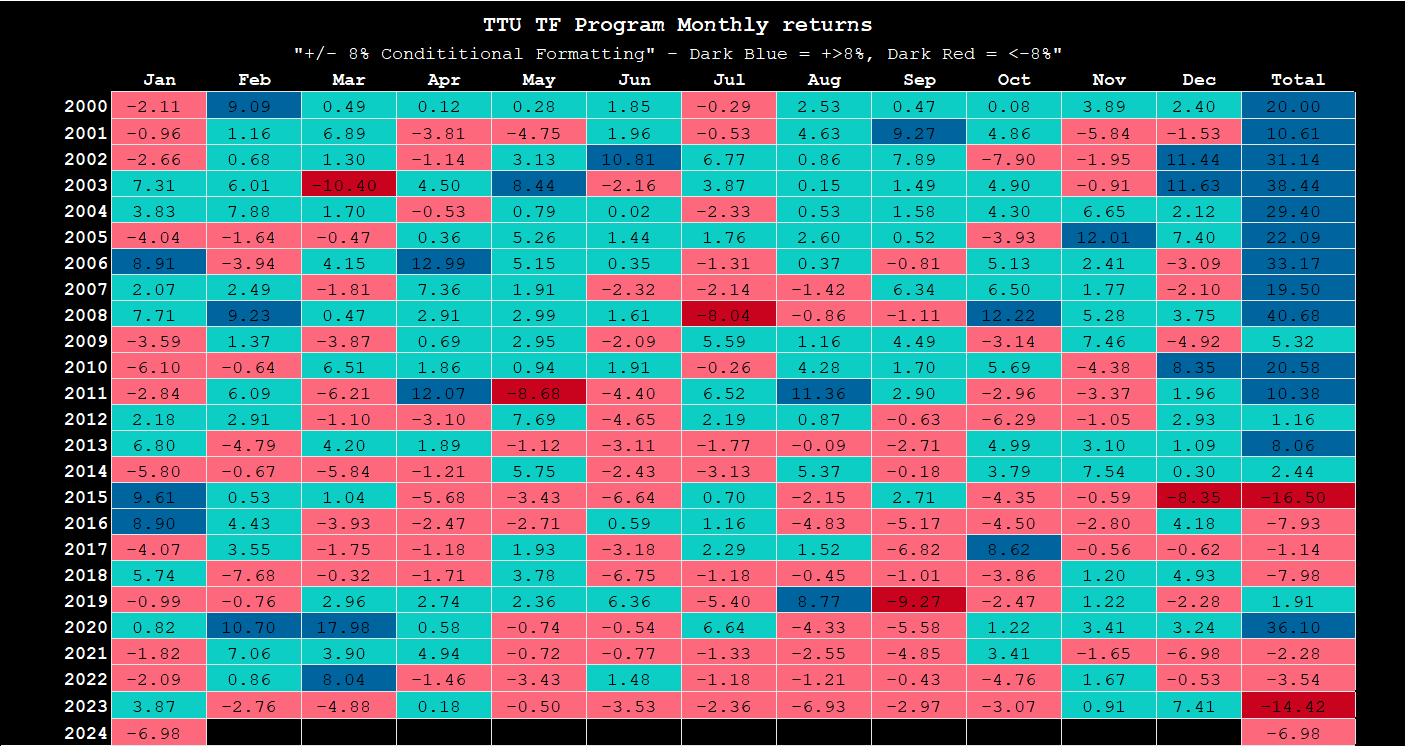
In January 2024, the TTU Trend Following Program recorded a loss of 6.98%, due to the poor performance of its short-term trend following. For a detailed overview, please refer to Chart 9 and Table 10.
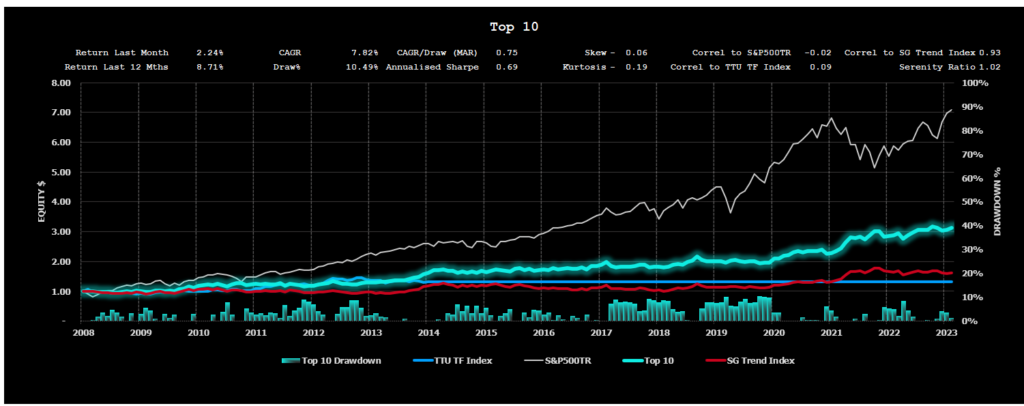
Blend of the Month (Top 10 Trend Following Ensemble) with Hind-Sight Bias
The ‘Blend of the Month’ showcases a hypothetical optimal ensemble of 10 Trend Following Programs in terms of Risk Adjusted Return (using MAR) which is selected from our TTU TF Index using data from 1st January 2000 to the reporting month.
Note that this blend is simply used to hypothetically illustrate the ability to choose 10 Trend Following Programs from the TTU TF Index that can produce stunning performance metrics. Clearly more due diligence needs to be undertaken if one were to undertake such a process in reality.
We use an algorithm to iterate through the monthly performance results of each Program in the Index over the long-term and collate the optimal blend.
Without further ado, the Blend of the Month for the period 1st January 2000 to end of last month is as follows.
This Blend of the month is simply used to illustrate how an ensemble of 10 Trend Following Programs with a long-term track record could theoretically be chosen using the benefit of hindsight to produce stunning performance results with little volatility.
In practice, we do not have the benefit of hindsight when selecting the Programs we wish to compile for an uncertain future.
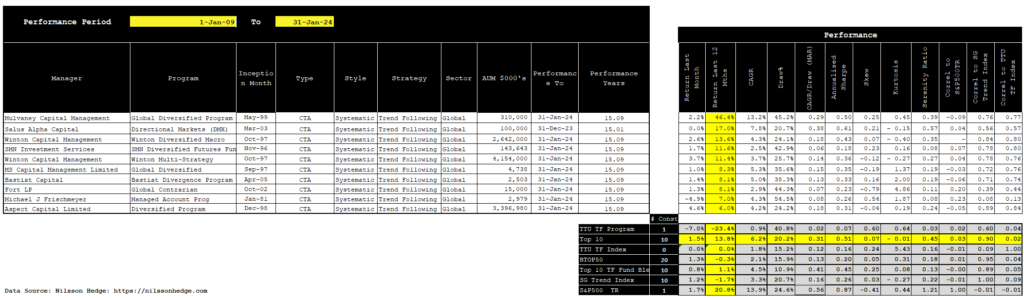
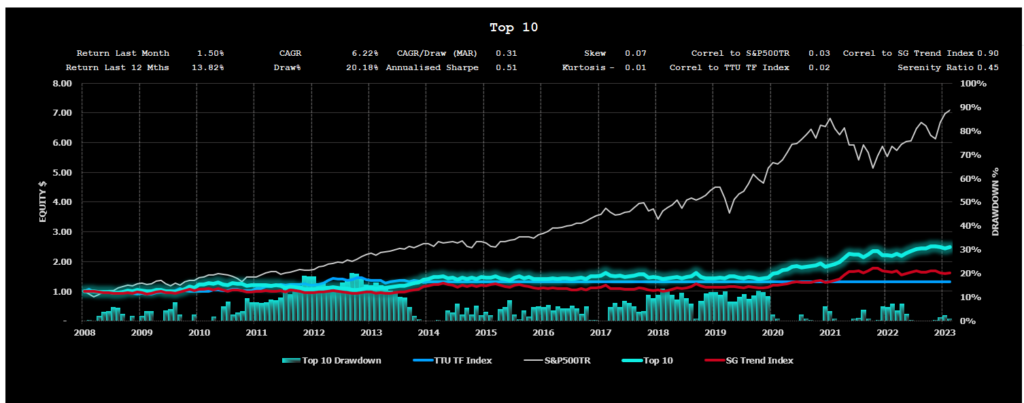
Blend of the Month (Top 10 Trend Following Ensemble) without Hind-Sight Bias
We do however have a process that can be adopted which converges towards the optimal solution with a 12-month lag that does not use hindsight bias.
The process does not use timing to select Programs for inclusion as timing methods can be problematic, but rather operates off the principle that Programs with a long-term track record of offering superior risk adjusted returns tend to do so going forward into the future. In other words, there is a degree of autocorrelation in the risk adjusted performance returns of those Programs with a long term validated track record.
Our process uses Monthly Performance data for those Programs with at least a 15-year track record. Each year it then selects an optimal portfolio of 10 Programs from the available listing based on MAR of a composite of 10 possible Programs. We use an iteration process where we rank possible composites using 2,000,000 possible permutations of combinations of a 10 Programs drawn from the entire listing and then select the best performing composite in terms of MAR for the following unseen year.
Once again, we need to issue a word of caution. This hypothetical blend is simply used to hypothetically illustrate the ability to choose 10 Trend Following Programs from the TTU TF Index without hindsight bias using a powerful process that converges towards the optimal blend solution. Clearly more due diligence needs to be undertaken if one were to undertake such a process.
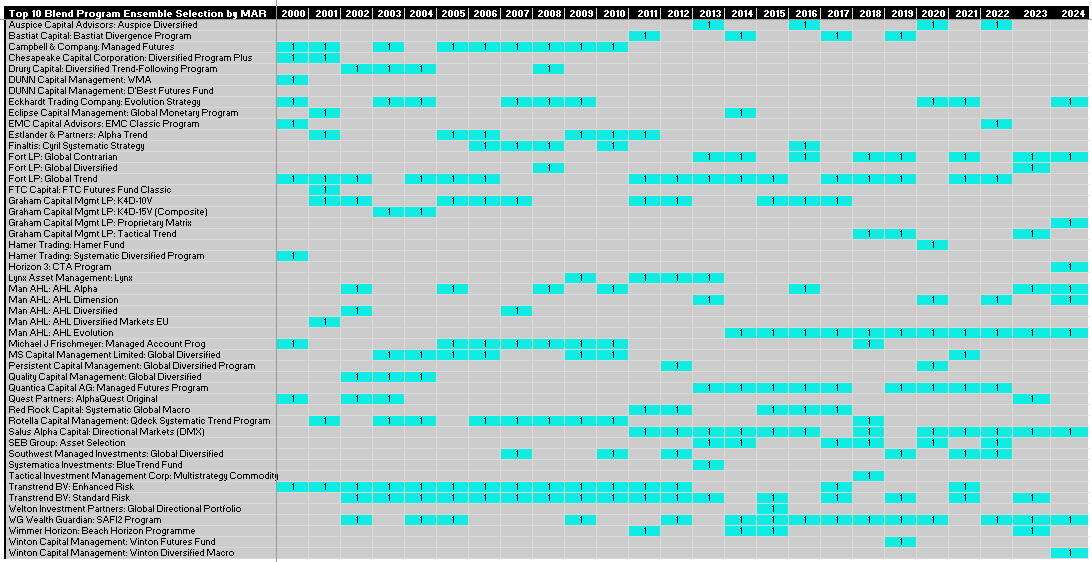
The Programs we have selected each year is described by the Table below. The listing of Programs we are using for the current unseen year are described in the 2024-year column of Table 13 below. This Top 10 listing described in the 2024 column will remain in force until January 2025 when the selection process and rebalance will be undertaken for the 2024-year.
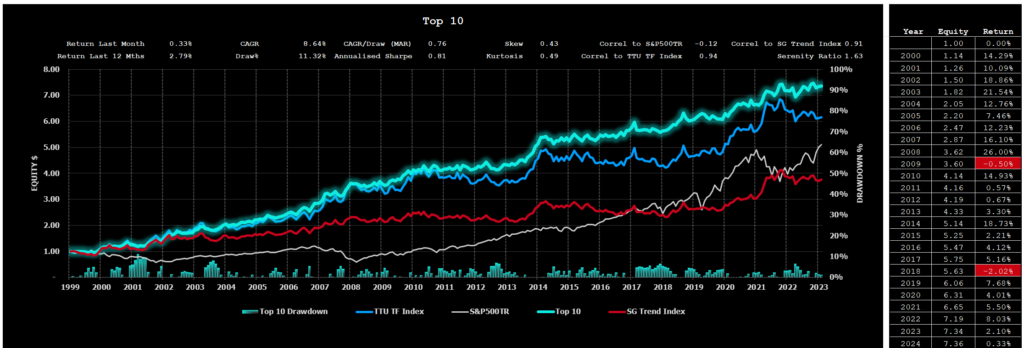
The consolidated performance results of this ‘optimal’ selection process undertaken each year is as follows:
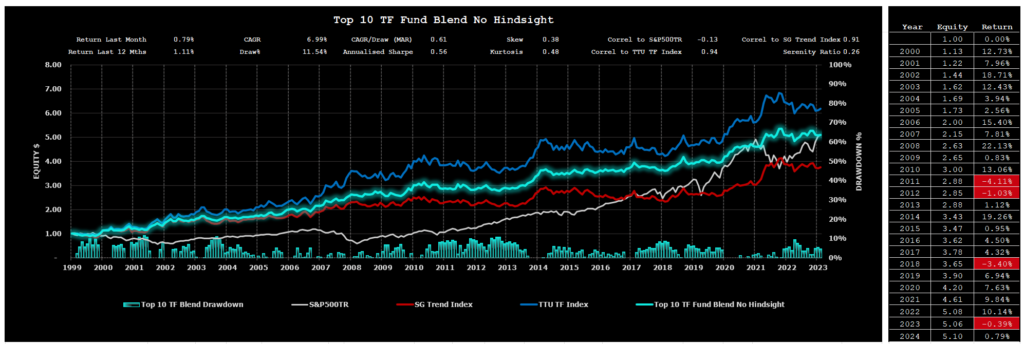
While overall performance results of Chart 14 are marginally inferior to the hypothetical ‘Blend of the Month’ (described in Chart 12) with slightly lower CAGR of 6.99% compared to 8.64% over the same reporting period and Drawdowns of 11.54% versus 11.32%, we can see how the overall risk-adjusted performance metrics of the “non-cherry picked” blend converges towards (approaches) the ‘optimal’ portfolio solution. Using MAR as a basis for comparison, the hypothetical blend has a MAR of 0.76 whereas the non-cherry-picked selection has a MAR of 0.61.
Top 10 Lists
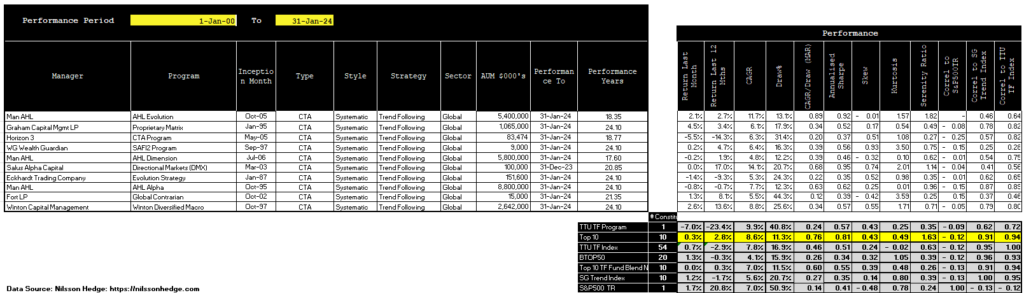
We have prepared the following Top 10 lists (excluding non-reporting Programs) for various performance categories based on monthly performance returns for a 15-year period commencing 1st January 2009 to the current month.
Top 10 Listing – by Compound Annual Growth Rate
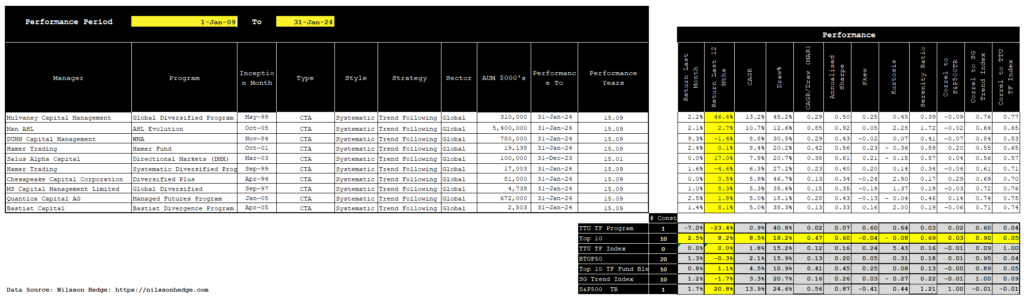
Top 10 Listing – by Risk Adjusted Return (Serenity Ratio)
Top 10 Listing – by Last 12 months Performance
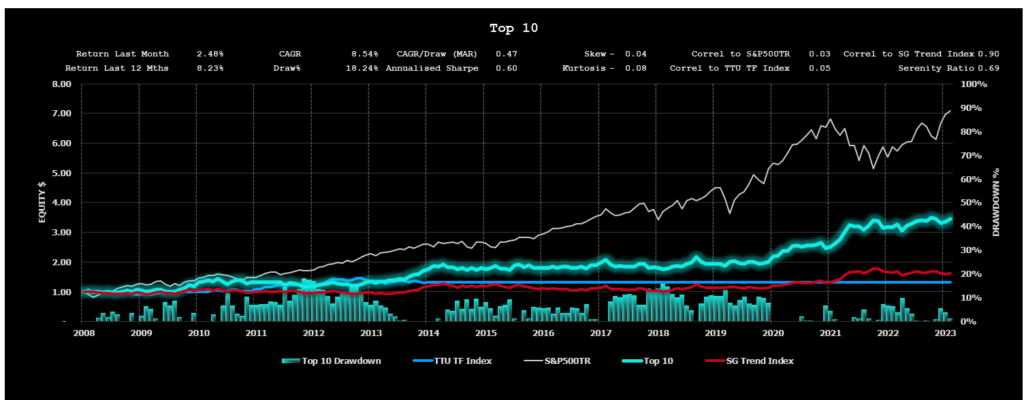
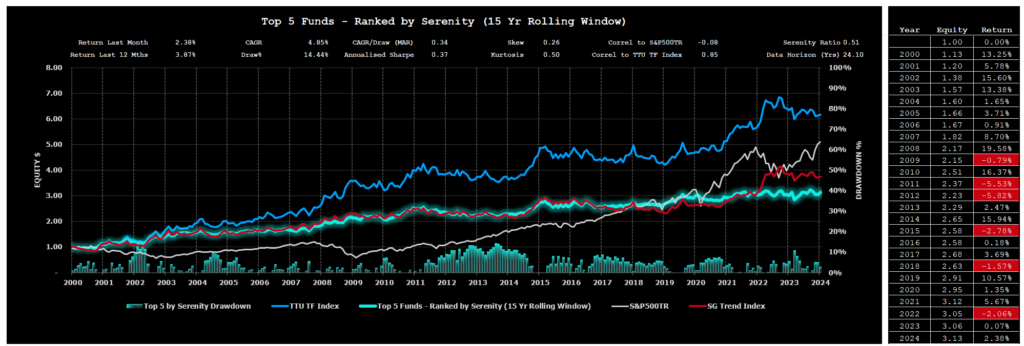
Performance Results for the TTU Top 5 by Serenity Ratio
In a recent research project, we undertook at TTU, we examined three different allocation methods that could be deployed by an investor seeking to optimally allocate investment funds towards 5 of the Top ranked Globally Diversified Systematic Trend Following Programs with a long-term track record.
These three methods adopted 3 different forms of performance metric, namely:
- Top 5 Performers by Compound Annual Growth Rate (CAGR) using a rolling lookback of 15 years.
- Top 5 Performers by MAR ratio (CAGR/Max Draw%) using a rolling lookback of 15 years.
- Top 5 Performers by Serenity Ratio using a rolling lookback of 15 years.
The findings of our project can be obtained by clicking on this link.
Our research determined that the optimal selection method was the Serenity Ratio method.
The Performance for the month of January 2024 of our Top 5 Selection Method using the Serenity Ratio was an increase of 2.38%. (Refer to Chart 21).
For the entire reporting period, this selection method produces a CAGR of 4.85% with a Maximum Drawdown of only 14.44% and effectively a “zero” correlation to the S&P500TR Index (-0.08).
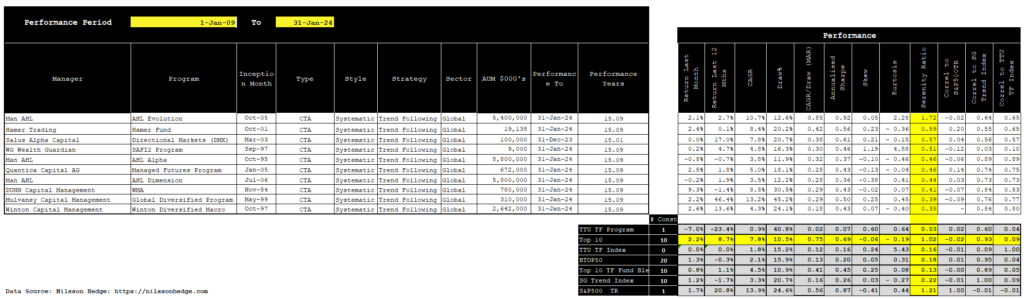
We mentioned in our recent podcast on the Systematic Investor Series Episode 283 that the Serenity selection for 2024 would be announced in this monthly report. So without further ado, having updated our data sets with results from 2023, the 2024 Serenity selection is as follows:
This selection will be applied for the investment period between 1st February 2024 to 31st January 2025:
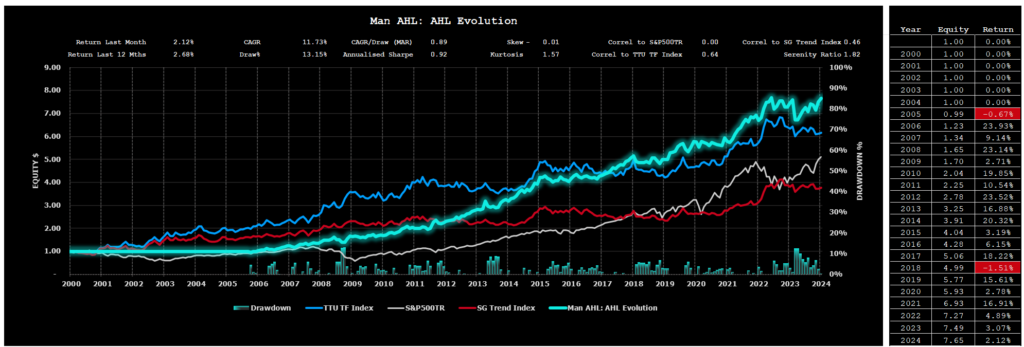
- Man AHL: AHL Evolution;
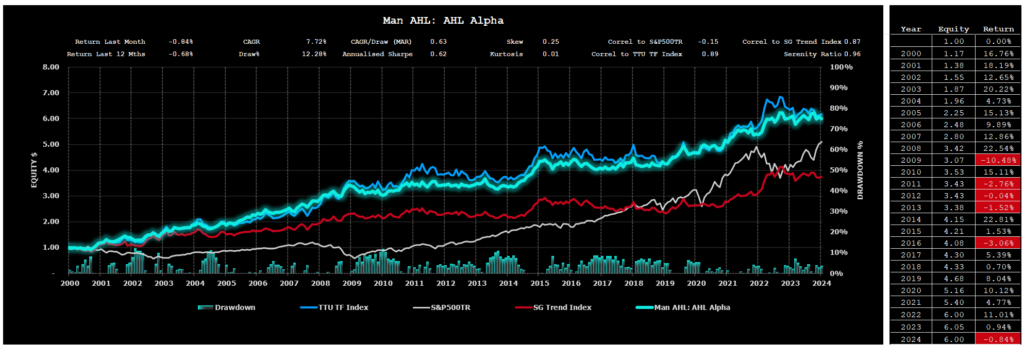
- Man AHL: AHL Aplha;
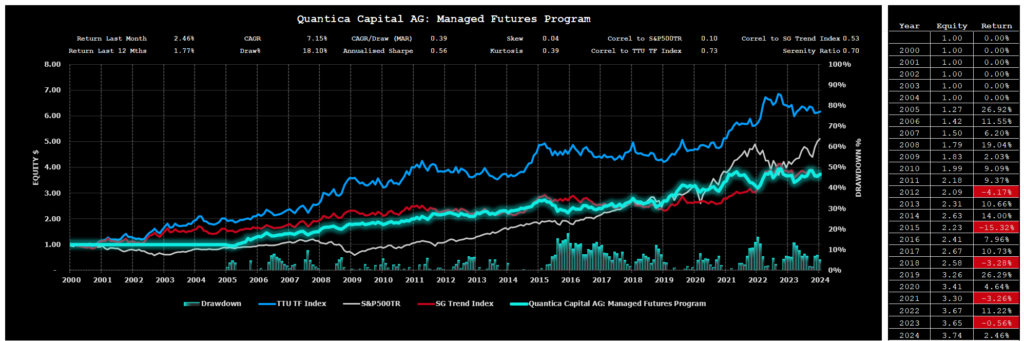
- Quantica Capital AG: Managed Futures Program;
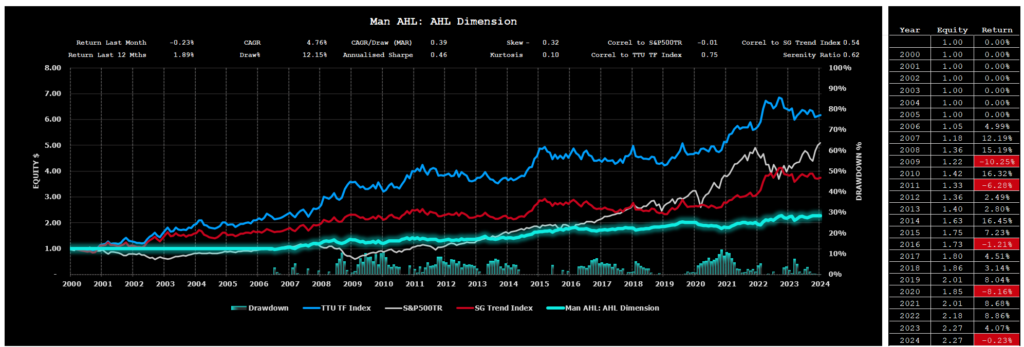
- Man AHL: AHL Dimension; and
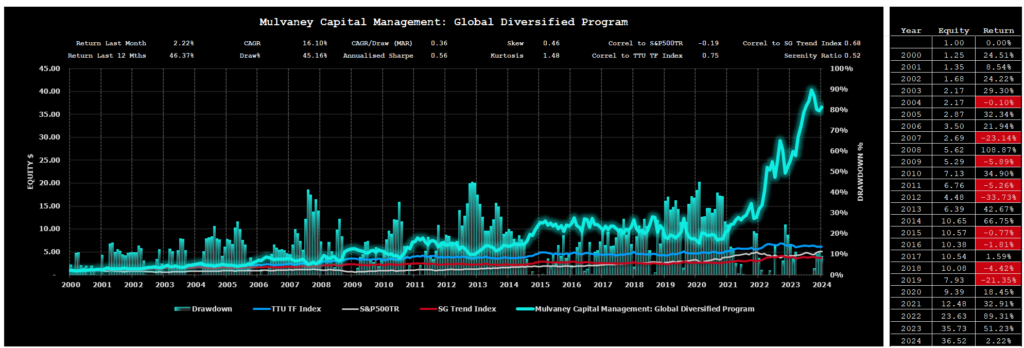
- Mulvaney Capital Management: Global Diversified Program.
Individual Performance Results for these 5 Programs used for the Serenity allocation as of 31st January 2023 using the 2024 listing are as follows:
Performance Results for the Alternative 60/40 portfolio using the TTU Top 5 by Serenity Ratio
In our “How to Invest with the Best” blog post, we also highlighted the significant improved risk-adjusted performance results that could be achieved by replacing the 40% allocation to Bonds in the traditional 60/40 portfolio with an allocation of 40% towards the TTU Top 5 by Serenity ratio.
The evaluation compared the performance of a traditional 60% Equity/40% Bond portfolio against a 60% Equity/40% Serenity portfolio to highlight the uncorrelated historical nature of this Alternative 60/40 portfolio and demonstrate the benefits that a sizeable allocation towards the Serenity portfolio would bring to an investor if equity and bond markets go back to their historic relationship and become more positively correlated in the future. There is no guarantee that correlations remain static over time and it is possible that bond markets and equity markets may lose their uncorrelated relationship that has existed in the last 20 years or so. It is far less likely that the TF managers within the Serenity Grouping will ever be strongly positively correlated to the Equities market, over the long run, given the extensive global diversification and ability to go long and short, that is present within the constituents of the Serenity Grouping.
Chart 27 below showcases the comparative performance results for the period 1 January 2000 to the end of last month:
- A 100% investment in the S&P500TR portfolio;
- A 100% investment in the VBMFX which is a proxy for the bond market;
- A 100% investment in the VBIAX which is a suitable proxy for the classic 60% Equity/40% Bond portfolio;
- A 100% investment in a 60% S&P500TR 40% Serenity portfolio; and
- A 100% investment in the Serenity Portfolio.
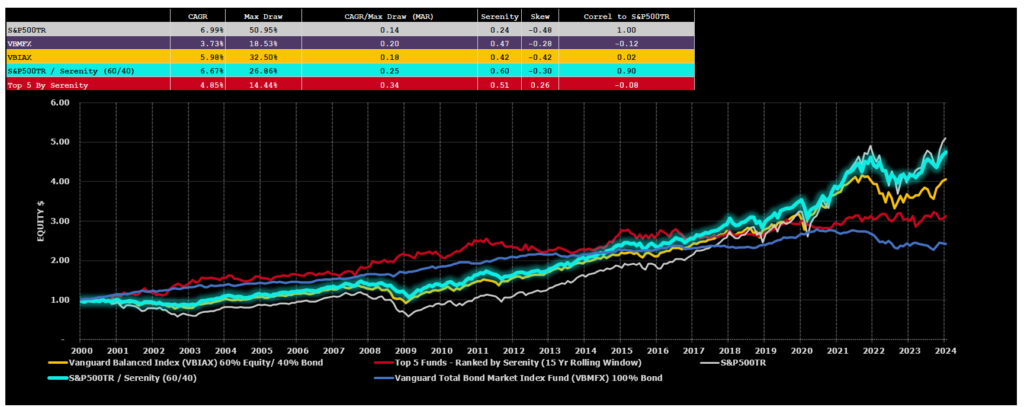
The comparison of alternative portfolio allocations above highlights the strong historic risk adjusted returns that have been enjoyed by 60% S&P500TR / 40% Serenity Composite Portfolio.
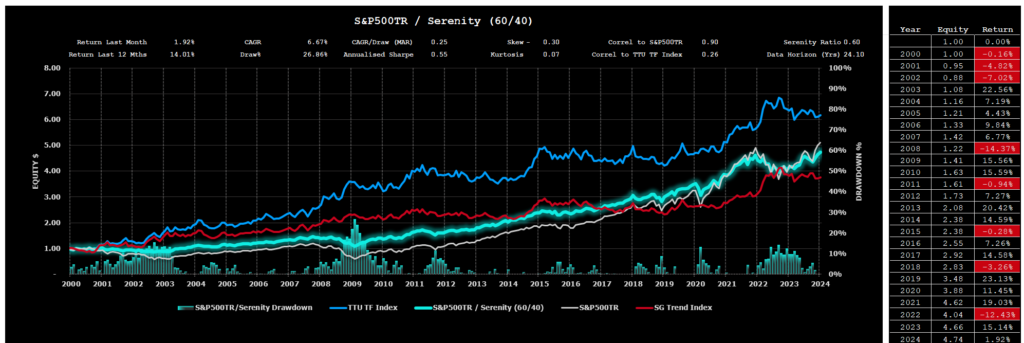
A more detailed assessment of this powerful 60/40 investment option is reflected in Chart 28 below.
Important Disclaimers
This document is directly solely to Accredited Investors, Qualified Eligible Participants, Qualified Clients and Qualified Purchasers. No investment decision should be made until prospective investors have read the detailed information in the fund offering documents of any manager mentioned in this document. This document is furnished on a confidential basis only for the use of the recipient and only for discussion purposes and is subject to amendment This document is neither advice nor a recommendation to enter into any transaction. This document is not an offer to buy or sell, nor a solicitation of an offer to buy or sell, any security or other financial instrument. This presentation is based on information obtained from sources that TopTradersUnplugged (“TTU”) (“considers to be reliable however, TTU makes no representation as to, and accepts no responsibility or liability for, the accuracy or completeness of the information. TTU has not independently verified third party manager or benchmark information, does not represent it as accurate, true or complete, makes no warranty, express or implied regarding it and shall not be liable for any losses, damages, costs or expenses relating to its adequacy, accuracy, truth, completeness or use.
All projections, valuations, and statistical analyses are provided to assist the recipient in the evaluation of the matters described herein. Such projections, valuations and analyses may be based on subjective assessments and assumptions and may use one among many alternative methodologies that produce different results accordingly, such projections, valuations and statistical analyses should not be viewed as facts and should not be relied upon as an accurate prediction of future events. There is no guarantee that any targeted performance will be achieved Commodity trading involves substantial risk of loss and may not be suitable for everyone
TTU is not and does not purport to be an advisor as to legal, taxation, accounting, financial or regulatory matters in any jurisdiction. The recipient should independently evaluate and judge the matters referred to herein. TTU does not provide advice or recommendations regarding an investor’s decision to allocate to funds or accounts managed by any manager (“or to maintain or sell investments in funds or accounts managed by any manager, and no fiduciary relationship under ERISA is created by the investor investing in funds or accounts managed by any manager, or through any communication between TTU and the investor
In reviewing this document, it should be understood that the past performance results of any asset class, or any investment or trading program set forth herein, are not necessarily indicative of any future results that may be achieved in connection with any transaction. Any persons subscribing for an investment must be able to bear the risks involved and must meet the suitability requirements relating to such investment. Some or all alternative investment programs discussed herein may not be suitable for certain investors This document is directed only to persons having professional experience in matters relating to investments. Any investment or investment activity to which this document relates is available only to such investment professionals. Persons who do not have professional experience in matters relating to investments should not rely upon this document.
This document and its contents are proprietary information of TTU and may not be reproduced or otherwise disseminated in whole or in part without TTU’s prior written consent.
This document contains simulated or hypothetical performance results that have certain inherent limitations AND SHOULD BE VIEWED FOR ILLUSTRATIVE PURPOSES. Unlike the results shown in an actual performance record, these results do not represent actual trading. HYPOTHETICAL PERFORMANCE RESULTS HAVE MANY INHERENT LIMITATIONS, SOME OF WHICH ARE DESCRIBED BELOW. NO REPRESENTATION IS BEING MADE THAT ANY ACCOUNT WILL OR IS LIKELY TO ACHIEVE PROFITS OR LOSSES SIMILAR TO THOSE SHOWN IN FACT, THERE ARE FREQUENTLY SHARP DIFFERENCES BETWEEN HYPOTHETICAL PERFORMANCE RESULTS AND THE ACTUAL RESULTS SUBSEQUENTLY ACHIEVED BY ANY PARTICULAR INVESTMENT ACCOUNT.
ONE OF THE LIMITATIONS OF HYPOTHETICAL PERFORMANCE RESULTS IS THAT THEY ARE GENERALLY PREPARED WITH THE BENEFIT OF HINDSIGHT IN ADDITION, HYPOTHETICAL TRADING DOES NOT INVOLVE FINANCIAL RISK, AND NO HYPOTHETICAL TRADING RECORD CAN COMPLETELY ACCOUNT FOR THE IMPACT OF FINANCIAL RISK IN ACTUAL TRADING FOR EXAMPLE, THE ABILITY TO WITHSTAND LOSSES OR TO ADHERE TO A PARTICULAR TRADING PROGRAM OR OTHER ASSET.
There are numerous other factors related to the markets in general or to the implementation of any specific trading program which cannot be fully accounted for in the preparation of hypothetical performance results and all of which can adversely affect actual trading results. No representation is being made that any investment will or is likely to achieve profits or losses similar to those being shown.
Most Comprehensive Guide to the Best Investment Books of All Time

Most Comprehensive Guide to the Best Investment Books of All Time
Get the most comprehensive guide to over 600 of the BEST investment books, with insights, and learn from some of the wisest and most accomplished investors in the world. A collection of MUST READ books carefully selected for you. Get it now absolutely FREE!
Get Your FREE Guide HERE!