


Trend Following Performance Report — March, 2024

Overview
March 2024 marks a transformative moment for trend following, as it culminates a four-year period of robust performance initiated in 2020. This era has not only redefined investment expectations but also established a new benchmark for the sector, highlighting a significant paradigm shift in market dynamics and emphasizing the essential role of trend following in today's financial landscape.
Post-2020, as global economies began to diverge from the synchronized monetary policies that had characterized the prior decade, a pronounced shift in the market regime emerged. This move away from long-established coordinated policies spurred a renaissance in asset behaviours, vividly observed in the significant trends across diverse markets such as Cocoa, Bitcoin, precious metals, and energy sectors. Rather than being driven by uniform global policy impacts, these markets demonstrated volatility and a return to intrinsic, market-driven movements influenced by unique supply and demand dynamics, geopolitical tensions, and sector-specific developments.
For instance, fluctuations in global production and consumption trends significantly impacted Cocoa prices, while Bitcoin's trajectory was distinctly shaped by evolving regulatory landscapes and its increasing acceptance among institutional investors. Precious metals reacted to inflationary pressures and economic uncertainties that diverged under varied national policies and growing geopolitical uncertainty in the Ukraine and the Middle East. Meanwhile, the energy sector responded dynamically to regional geopolitical changes and the global transition towards renewable energy sources, moving independently from the broader market influences that had previously dominated its trends.
These varied and pronounced trends have underscored a crucial development in investment management, challenging the traditional reliance on the 60/40 portfolio strategy (60% stocks and 40% bonds). Historically favoured for its balance of growth (via stocks) and safety (via bonds), the 60/40 strategy's effectiveness has been called into question, especially in light of recent periods where equities and bonds have suffered simultaneous downturns, moving in tandem in response to global economic stresses rather than inversely as expected.
This synchronicity in turbulent times necessitates a reconsideration of the effectiveness of the 60/40 portfolio in contemporary market environments. Consequently, there is a growing recognition within the investment community of the need to diversify beyond traditional asset allocations. This recognition paves the way for a compelling case for a significant allocation towards trend following strategies.
Trend following, with its inherent flexibility to capitalize on both rising and falling markets across a broad spectrum of assets, provides a robust alternative to traditional investment approaches. By dynamically adjusting to market conditions and capturing trends as they unfold, trend following can serve as a vital component of portfolio diversification. This strategy not only enhances the potential for positive returns in varied market environments but also helps mitigate risks during periods of significant market disruptions where traditional assets might move together and fail to provide the necessary balance.
Given these considerations, investors are increasingly viewing substantial allocations to trend following strategies not merely as an alternative but as an essential enhancement to their portfolios. This strategic pivot ensures resilience and potential growth in the face of unpredictable global market shifts and is becoming fundamental in crafting portfolios capable of navigating the complexities of today's financial landscapes, thereby establishing trend following as a cornerstone of modern investment planning.
The success achieved by trend following strategies over the past four years exemplifies a broader paradigm shift within the financial markets, where unpredictability has become a consistent feature rather than an anomaly. The post-2020 world has ushered in an era marked by heightened volatility and unpredictability, driven by rapid geopolitical changes, erratic economic policies, and global events that disrupt traditional market patterns. This environment of continual change has provided fertile ground for trend following strategies, uniquely designed to capitalize on significant market movements, irrespective of their direction.
This capability to adapt to and profit from economic flux is deeply ingrained in the philosophy of trend following itself. This approach does not attempt to predict market movements but rather reacts to them, leveraging trends as they emerge and evolve. As a result, trend followers have turned volatility into opportunity, achieving gains during periods of both market upheaval and recovery.
The proven effectiveness of trend following in navigating these waters suggests it should play a more prominent role in the strategic planning of portfolios, as traditional models struggle to keep pace with the speed and complexity of modern financial markets. The sustained success of trend following over these turbulent years is a clear indicator of its value and efficacy in the current financial era, challenging preconceived notions about market behaviour and portfolio management and advocating for a more flexible and responsive approach to investing that can adjust to the unpredictable rhythms of global markets.
As we look to the future, the persistence of market uncertainty seems inevitable. Global political, economic, and social shifts suggest that this unpredictability will not only continue but may intensify. Such a scenario is promising for the trend following sector. The ongoing flux presents a continuous stream of opportunities for disciplined and diversified trend following approaches to demonstrate their value by capturing trends that other investment strategies might miss.
The outlook for trend following remains not just optimistic but vibrant. The sector is well-equipped to continue its impressive trajectory, navigating through the complexities of tomorrow’s markets with agility and strategic acumen.
March 2024 Trend Index Performance
In March, the TTU TF Index experienced another notable increase, rising by 5.23% and reaching a new high watermark, with a year-to-date (YTD) gain of 12.51%, marking an impressive beginning to 2024. Similarly, the BTOP 50 Index also saw robust growth, ascending by 3.13% during the month and achieving a YTD increase of 8.72%. Furthermore, the SG Trend Index registered a significant gain of 4.19% in March, culminating in a YTD rise of 12.23%.
SG Trend Index
The SG Trend Index is designed to track the 10 largest trend following CTA’s of the managed futures space.
Criteria for inclusion in the Index as determined by Society Generale is as follows:
• Must trade primarily futures (including FX forwards);
• Must be broadly diversified across asset classes;
• Must be an industry recognized trend follower;
• Must exhibit significant correlation to trend following peers;
• Must be open the new investment; and
• Must report returns on a daily basis (net of fees).
The index currently is:
• Equally weighted;
• Calculated in base currency;
• Has an inception date of 1st January 2000;
• Rebalanced annually on 1st January; and
• Reconstituted annually on 1st January based on eligibility criteria.
There was a slight modification to the Index from January 2013 to the present. Previously the Programs needed to be a constituent of the SG CTA Index and the 10 largest Managers was not a requirement.
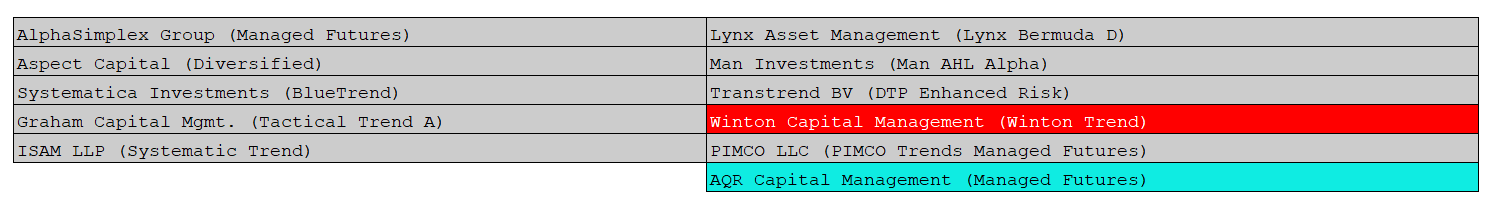
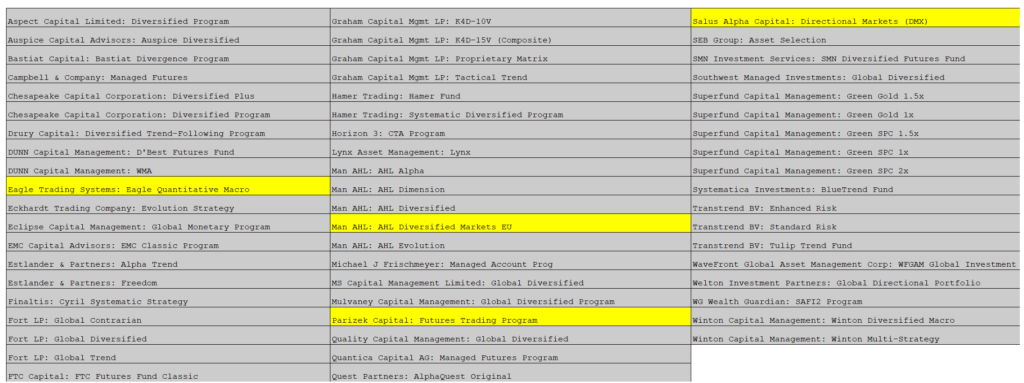
For the 2024 year following the rebalance of the Index we say goodbye to the Winton Trend Program and hello to the AQR Managed Futures Program. The listing of the 10 eligible programs in the Index for 2024 were as follows:
The performance of the SG Trend Index since 1st January 2000 to the end of last month is seen in Chart 2 below:
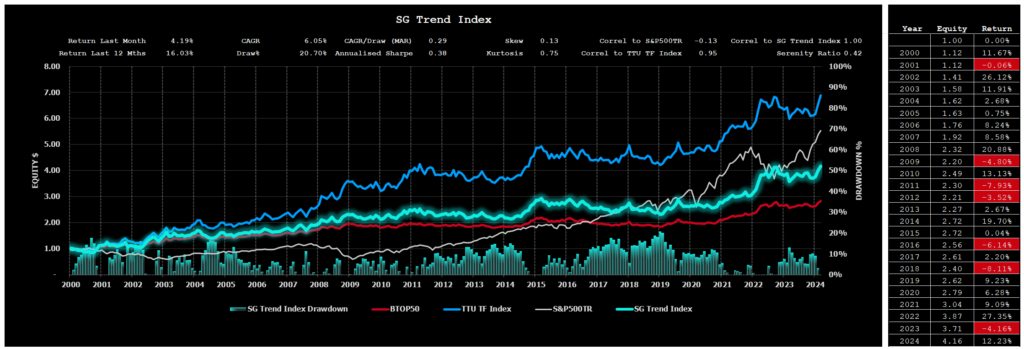
You will notice how the SG Trend Index is highly correlated with the BTOP50 Index and the TTU TF Index and uncorrelated with the S&P500TR Index.
Despite the high correlation between the various trend following Indexes, the long-term performance of these three Trend Following Indexes in terms of CAGR is different. The SG Trend Index plots between the BTOP50 Index and the TTU TF Index.
BTOP 50 Index
The BTOP50 Index seeks to replicate the overall composition of the managed futures industry with regards to trading style and overall market exposure. Unlike the SG Trend Index and the TTU TF Index, the BTOP50 is not strictly a trend following Index and is more broadly representative of the entire managed futures segment of which a dominant style is trend following. We like to think of the BTOP 50 as a ‘quasi trend following Index’ as opposed to a pure trend following Index.
Like the SG Trend Index, the BTOP50 Index is designed to track the performance of the largest Programs by AUM, however the Programs included may not be all Trend Following Programs. Criteria for inclusion in the Index as determined by Barclay Hedge is as follows:
Criteria for inclusion in the Index as determined by BarclayHedge is as follows:
• Must be a Program represented in the Barclay CTA Universe;
• In each Calendar year, the Programs selected must in aggregate be no less than 50% of the investable assets of the Barclay CTA Universe;
• The Programs must be open for investment;
• The Manager must be willing to provide Barclay Hedge with daily return performance;
• The Program must have at least two years of trading activity; and
• The Program’s advisor must have at least three years of operating history.
The index currently is:
• Equally weighted;
• Rebalanced annually on 1st January; and
• Reconstituted annually on 1st January based on eligibility criteria.
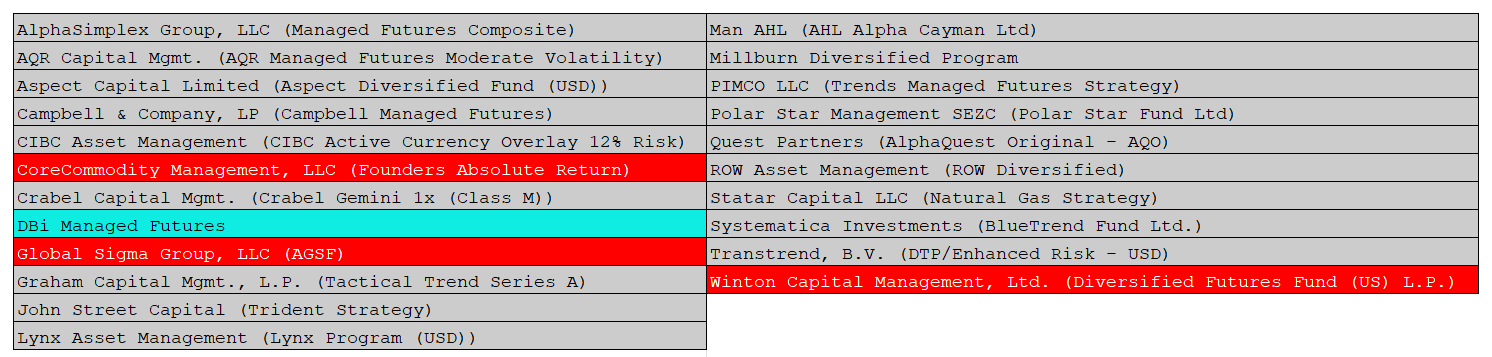
Despite the ’50’ tag in the BTOP 50 description, for 2024 there were 19 constituents in the Index. For the 2024 year we say goodbye to CoreCommodity Management, Global Sigma Group, Winton Capital and say hello to DBi Managed Futures.
The performance of the BTOP 50 Index since 1st January 2000 to to the end of last month is seen in Chart 4 below:
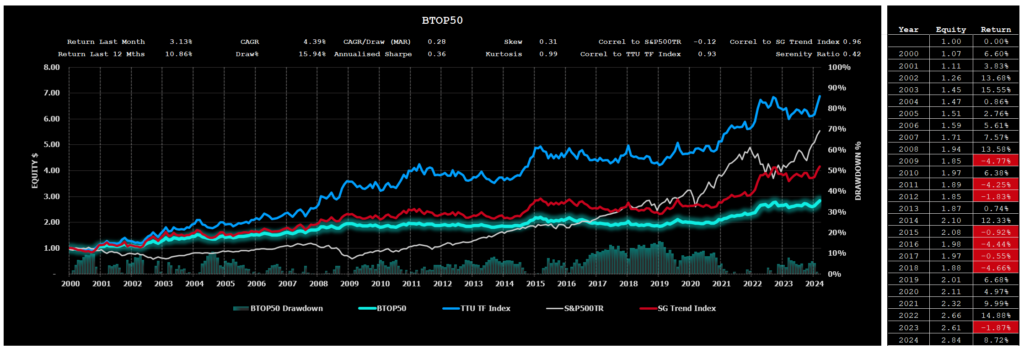
The BTOP 50 Index is highly correlated with the trend following Indexes of the SG Trend Index and the TTU TF Index, however its long-term performance is the lowest of the 3 Trend Following Indexes. While there is a significant representation of Trend Following Programs within the Index, the non-trend following Programs contribute to this diluted long-term performance.
TTU TF Index
The TTU TF Index has been developed by Top Traders Unplugged to provide a performance measure of the trend following programs with a long-term track record.
At TTU, we recognise the importance of a robust trading approach to these uncertain markets and feel that AUM is not a good robustness measure when it comes to assessing performance of the Trend Following industry. It is our strong opinion that the ultimate selection measure to apply in constituting a Trend Following Index is not AUM or a proxy risk metric such as the Sharpe, Sortino, MAR ratio, Ulcer Index or Serenity ratio. The superior metric to assess long-term performance is the long-term validated track record itself.
We have therefore developed a different method for constructing our TTU TF Index. The criteria for inclusion into our Index is as follows:
The criteria for inclusion into the TTU TF Index is as follows:
• Monthly performance results need to be captured in the Nilsson Hedge CTA database;
• Must be geographically diversified across asset classes;
• Must be fully systematic in nature using quantitative rules for entry and exit;
• Must possess at least a 15-year unbroken track record to the current reporting month;
• Must adopt trend following as their dominant investment strategy;
• Are currently active programs; and
• Must report performance monthly (net of fees).
The Index:
• Is Equally weighted;
• Is Rebalanced monthly;
• Is Reconstituted monthly;
• Has an inception date of 1st January 2000
As of March 31, 2024, at the time this report was written, the TTU TF Index draws its results from 58 Active Programs. The Index's monthly return is calculated based on the average return of these Programs that have submitted their reports for the month. Out of a total of 58 active Programs, 54 have provided their monthly reports. The table below details the 4 Programs that are still pending submission of their reports as of the reporting date.
The performance of the TTU TF Index since 1st January 2000 to to to the end of last month is as follows:
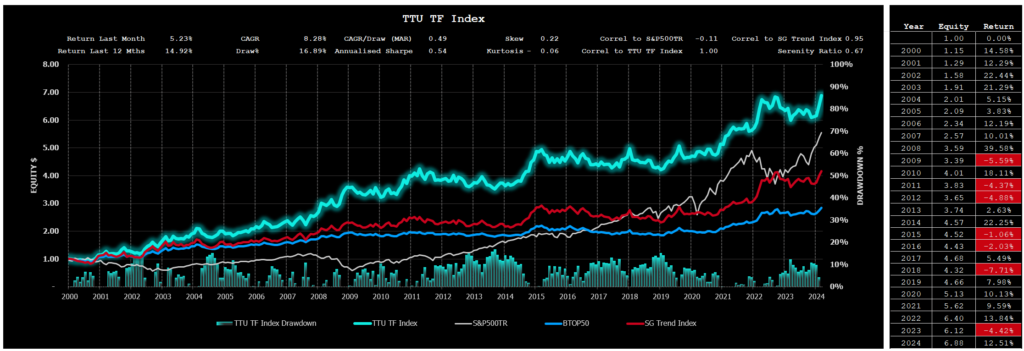
Now you might be intrigued by the performance result of the TTU TF Index. While it is highly correlated with the BTOP 50 Index and the SG Trend Index, we can see that long term performance of the TTU TF Index clearly outstrips alternative Index measures.
The dominant contributor of this outperformance is the requirement for any participating Program in the Index to have a long-term track record. You see, using AUM as a criterion for inclusion is not necessarily a useful selection criterion. While AUM reflects ‘market appeal’, it does not imply that this ‘market appeal’ is strongly correlated with ‘long term performance’.
Our process of Index construction gives us an insight into how any diversified ensemble of trend following Programs with a long-term track record approaches an optimal portfolio as we increase the number of Programs in the Index. Simply by diversifying into a large ensemble of Trend Following Programs with a long-term track record, we magically improve the Index result. CAGR is increased and our drawdowns are reduced.
Of course, we already know this ‘diversification’ principle of Trend Following. As we increase our diversification efforts, we obtain improvement both in terms of the maximum drawdown and in the CAGR generated by the ensemble. This is why we seek to strive for maximum market and system diversification within our individual programs. The TTU TF Index just takes this diversification one step further and diversifies across many different TF Programs to deliver a superior risk-adjusted result.
TTU TF Index Performance
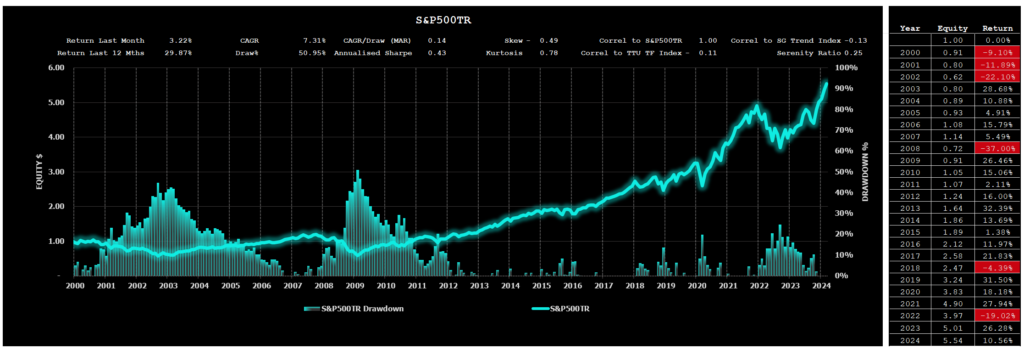
For the period from 1st January 2000 to 31st March 2024, the TTU TF Index has produced a Compound Annual Growth Rate of 8.28% with a Maximum Drawdown of 16.89% (Refer to Chart 6 above). This compares favorably against the performance of the S&P500 Total Return Index (includes dividends) which has produced a Compound Average Growth Rate of 7.31% with a Maximum Drawdown of 50.95% over the same period (Refer to the chart below).
TTU Trend Barometer
The TTU Trend Barometer saw a decrease in its reading, from 50 in February to 41 in March, reflecting a slight trend towards less favorable trending conditions, in particulary for shorter-term time frames.
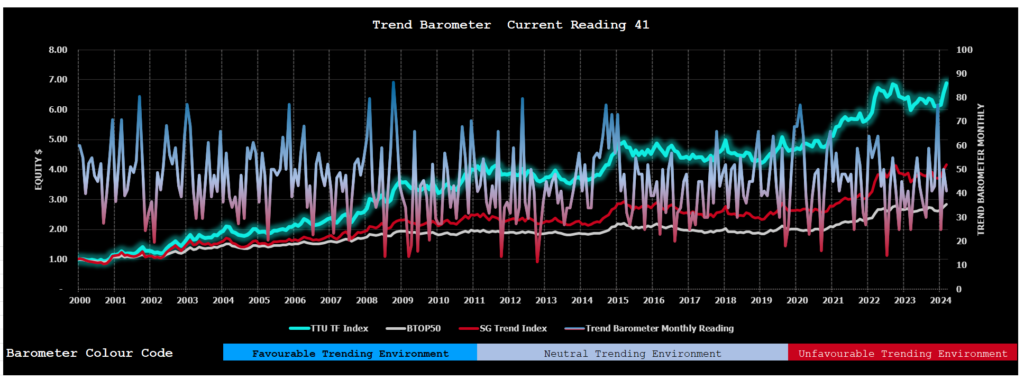
The Trend Barometer is a proprietary tool we use at TTU to assess the trend strength of a diversified portfolio consisting of 44 markets across all sectors. We firstly subdivide the trend strength of each market of a hypothetical diverse portfolio into five ranges from strong up, medium up, neutral, medium down and strong down. We then aggregate these results into a single portfolio number which we use to describe the overall trend strength across a hypothetical Program portfolio.
We then arbitrarily divide this percentage range into 3 where a value of 0-30 is considered a very unfavourable market regime for trend following Programs, a range between 30 to 55 is a somewhat neutral environment for Trend Following Programs (but not an environment where you could expect consistent performance) and values more than 55 are considered to be a favourable regime towards Trend Following Programs, where they should see good performance.
Aside from the occasional dispersed readings when compared to overall trend following performance this method is surprisingly powerful in describing CTA monthly performance and can be used to connect market trading environments to resultant Manager performance.
The Macro Environment
For a blow-by-blow macro wrap for the month, we recommend you listen to our weekly systematic investor series by clicking on the links below. It is also worthwhile listening to our past catalogue as it provides you with an understanding of how these markets can shape the emotions of a Trader and why it is therefore essential that Trend Followers adopt systematic rules-based processes to keep these emotions in check.
You can find all of our weekly conversations by clicking this link.
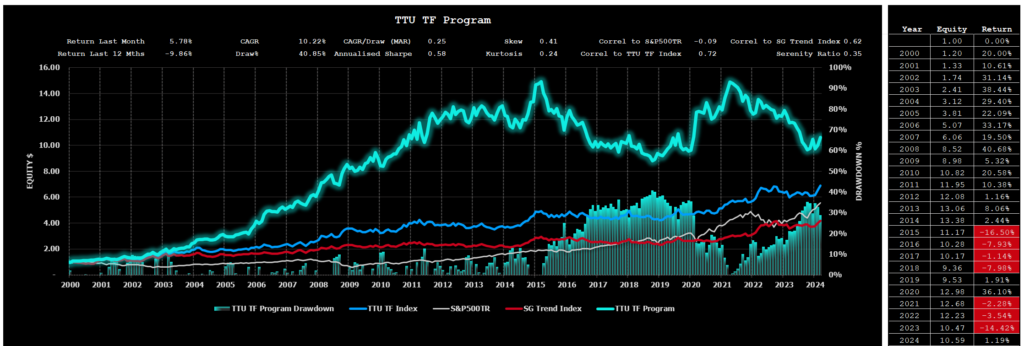
Top Traders Unplugged Trend Following Program (TTU TF Program)
You may have noticed that in the Systematic Investor Series I have have in the past mentioned my proprietary system which I traded before joining DUNN Capital Management. I have taken my listeners under the hood to better understand the thinking behind the design process of this trend following model in the following episodes:
- 120 Systematic Investor Series – January 2nd, 2021; and
- 121 Systematic Investor Series – January 6th, 2021.
The TTU Trend Following Program is also a kind of experiment for me, as I decided not to make any changes to the design or parameters in the program since about 2013, to see how a medium-term trend following strategy would perform without any new research and improvements.
We have continued to track the performance of this trend following model on an ‘after fee’ NAV basis simply to provide a context for my listeners to understand how the performance of this classic trend following model (albeit not as long-term as others) performs against other, perhaps more recent Trend Following Programs whose methods have ‘drifted’ away from the traditional Trend Following roots.
Despite a difficult drawdown period between May 2015 to Feb 2019, the TTU Trend Following model continues to perform during market regimes that are more volatile and uncertain, although in 2022, its shorter-term models (Group 3), have had a difficult time.
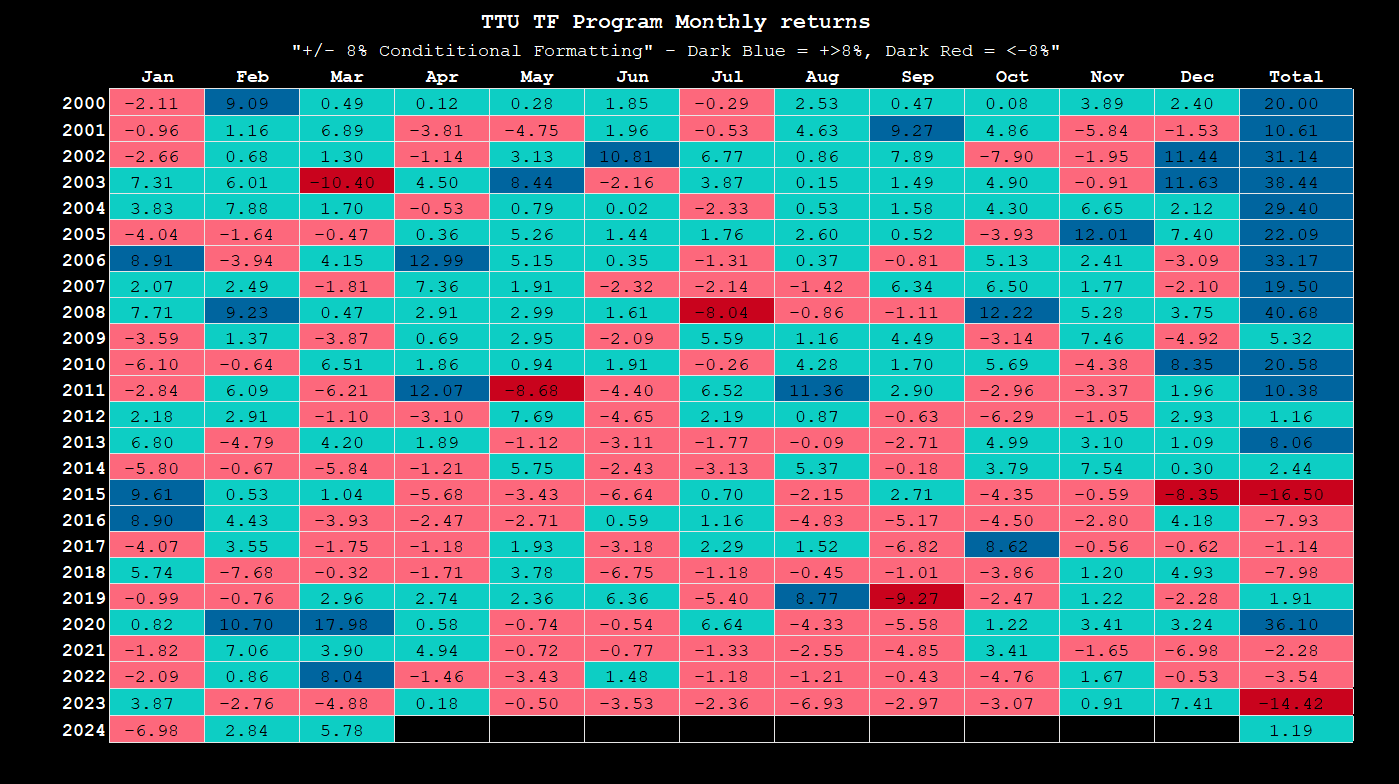
In March 2024, the TTU Trend Following Program experienced a growth of 5.78%, which adjusted its total for the year to a slight positive result of 1.19%. For an in-depth analysis, please see Chart 9 and Table 10.
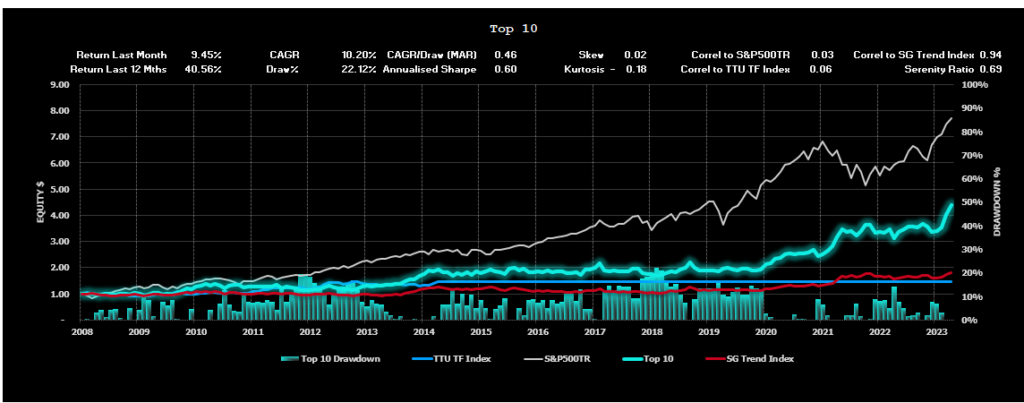
Top 10 Lists
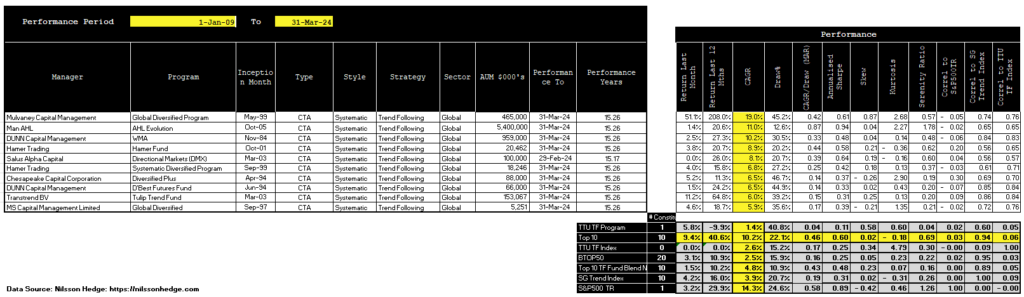
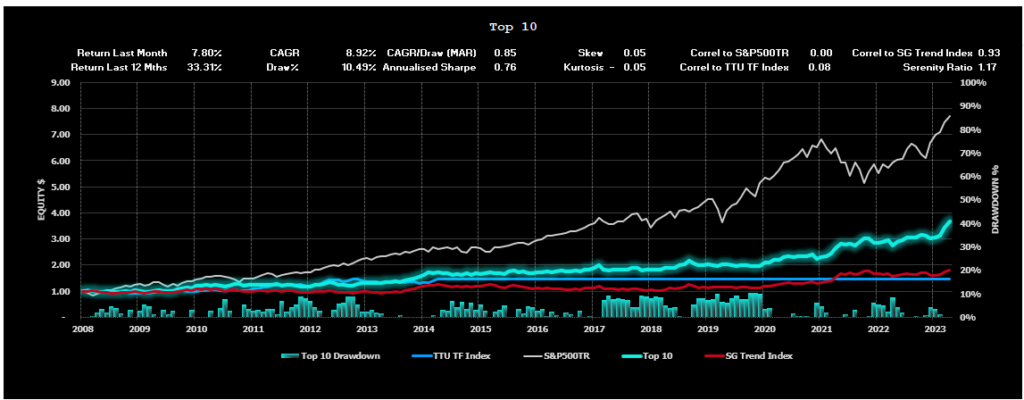
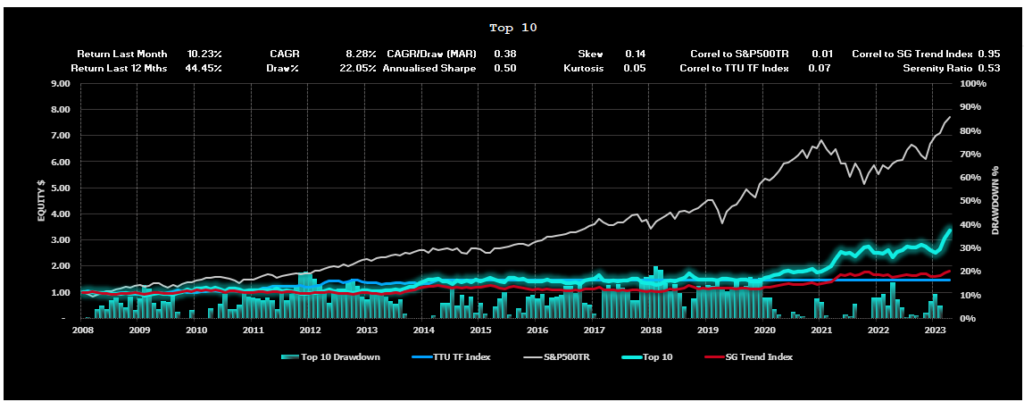
We have prepared the following Top 10 lists (excluding non-reporting Programs) for various performance categories based on monthly performance returns for a 15-year period commencing 1st January 2009 to the current month.
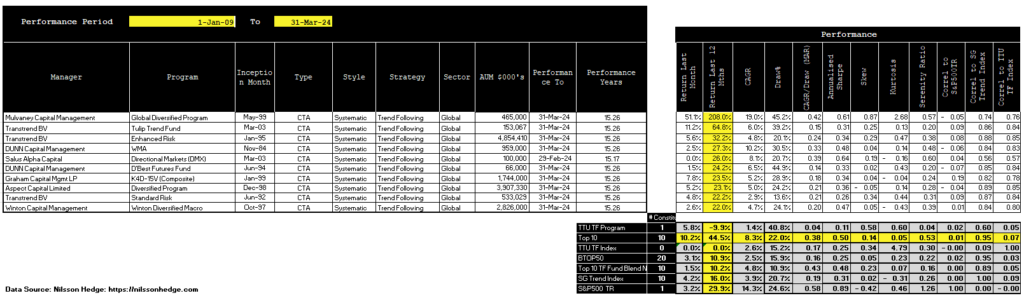
Top 10 Listing – by Compound Annual Growth Rate
Top 10 Listing – by Risk Adjusted Return (Serenity Ratio)
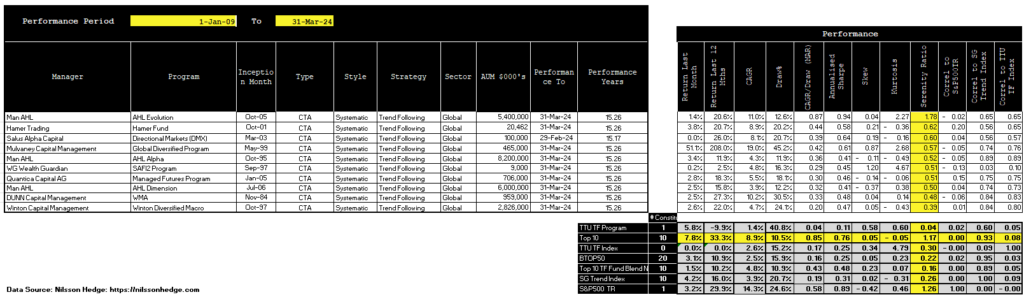
Top 10 Listing – by Last 12 months Performance
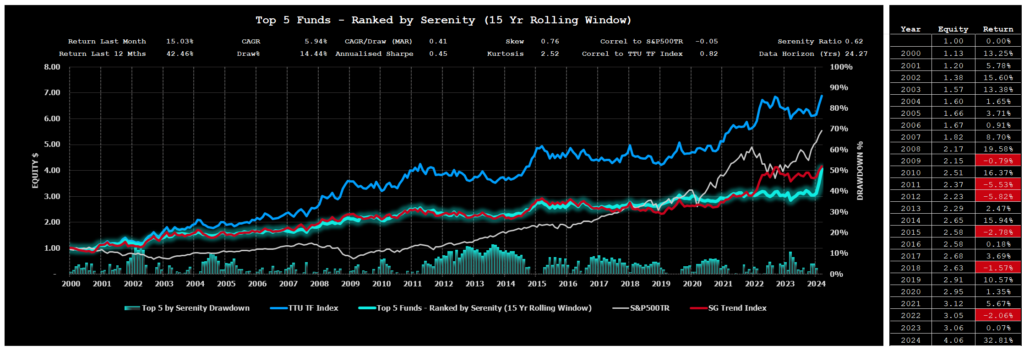
Performance Results for the TTU Top 5 by Serenity Ratio
In a recent research project, we undertook at TTU, we examined three different allocation methods that could be deployed by an investor seeking to optimally allocate investment funds towards 5 of the Top ranked Globally Diversified Systematic Trend Following Programs with a long-term track record.
These three methods adopted 3 different forms of performance metric, namely:
- Top 5 Performers by Compound Annual Growth Rate (CAGR) using a rolling lookback of 15 years.
- Top 5 Performers by MAR ratio (CAGR/Max Draw%) using a rolling lookback of 15 years.
- Top 5 Performers by Serenity Ratio using a rolling lookback of 15 years.
The findings of our project can be obtained by clicking on this link.
Our research determined that the optimal selection method was the Serenity Ratio method.
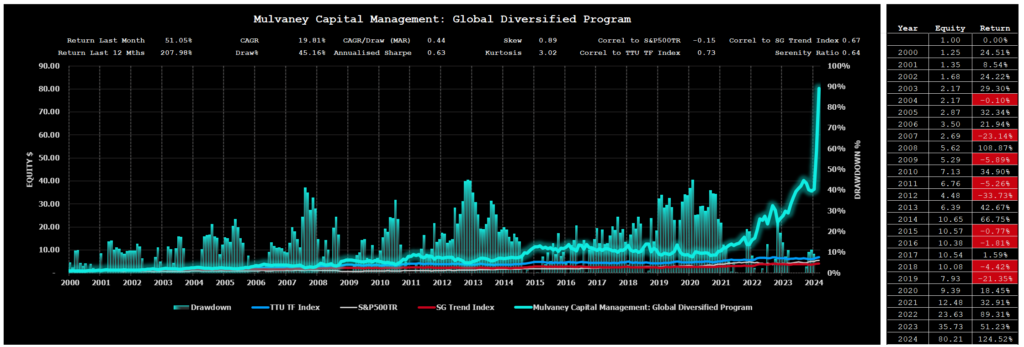
The Performance for the month of March 2024 of our Top 5 Selection Method using the Serenity Ratio was an increase of 15.03%. (Refer to Chart 21). With the inclusion of Mulvaney Capital’s Program in the Serenity Index this year, we are getting the benefit of strong growth so far in 2024.
For the entire reporting period, this selection method produces a CAGR of 5.94% with a Maximum Drawdown of only 14.44% and effectively a “zero” correlation to the S&P500TR Index (-0.05).
We mentioned in our recent podcast on the Systematic Investor Series Episode 283 that the Serenity selection for 2024 would be announced in this monthly report. So without further ado, having updated our data sets with results from 2023, the 2024 Serenity selection is as follows:
This selection will be applied for the investment period between 1st February 2024 to 31st January 2025:
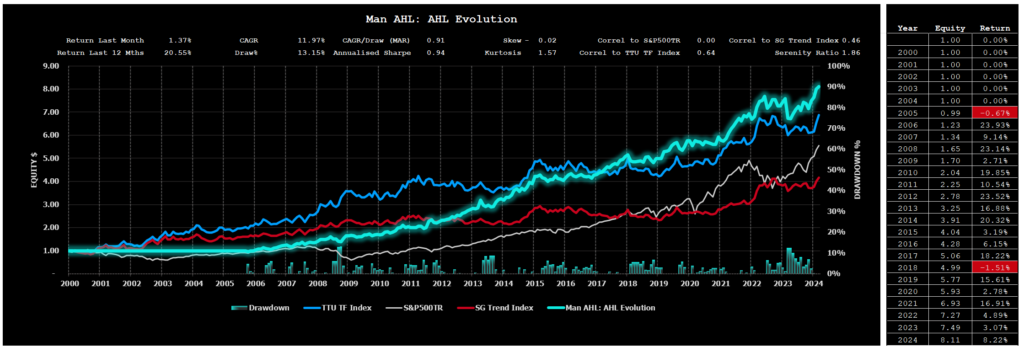
- Man AHL: AHL Evolution;
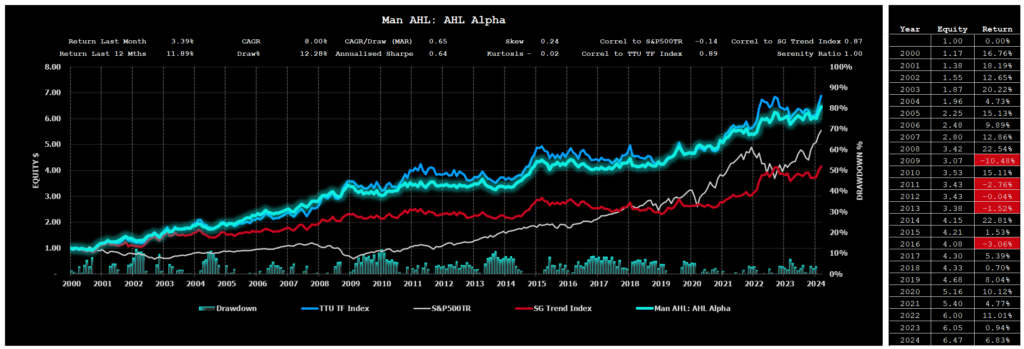
- Man AHL: AHL Aplha;
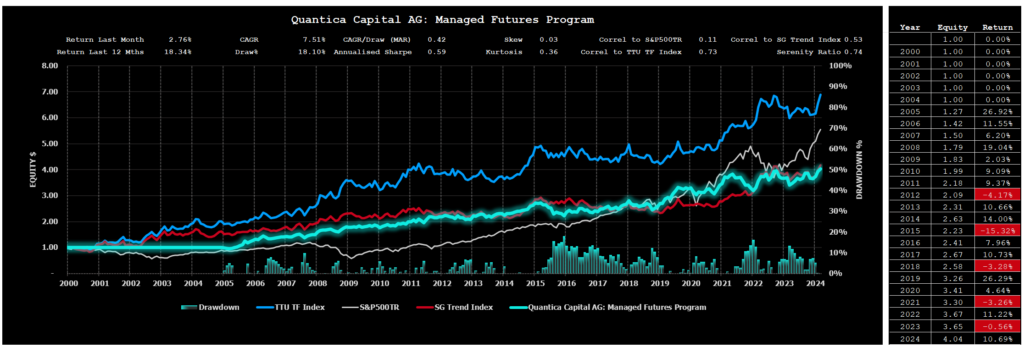
- Quantica Capital AG: Managed Futures Program;
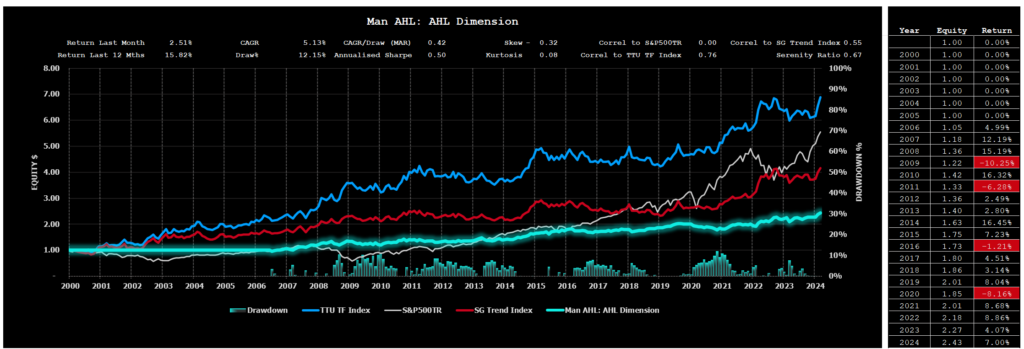
- Man AHL: AHL Dimension; and
- Mulvaney Capital Management: Global Diversified Program.
Individual Performance Results for these 5 Programs used for the Serenity allocation as of 29th February 2024 using the 2024 listing are as follows:
Performance Results for the Alternative 60/40 portfolio using the TTU Top 5 by Serenity Ratio
In our “How to Invest with the Best” blog post, we also highlighted the significant improved risk-adjusted performance results that could be achieved by replacing the 40% allocation to Bonds in the traditional 60/40 portfolio with an allocation of 40% towards the TTU Top 5 by Serenity ratio.
The evaluation compared the performance of a traditional 60% Equity/40% Bond portfolio against a 60% Equity/40% Serenity portfolio to highlight the uncorrelated historical nature of this Alternative 60/40 portfolio and demonstrate the benefits that a sizeable allocation towards the Serenity portfolio would bring to an investor if equity and bond markets go back to their historic relationship and become more positively correlated in the future. There is no guarantee that correlations remain static over time and it is possible that bond markets and equity markets may lose their uncorrelated relationship that has existed in the last 20 years or so. It is far less likely that the TF managers within the Serenity Grouping will ever be strongly positively correlated to the Equities market, over the long run, given the extensive global diversification and ability to go long and short, that is present within the constituents of the Serenity Grouping.
Chart 23 below showcases the comparative performance results for the period 1 January 2000 to the end of last month:
- A 100% investment in the S&P500TR portfolio;
- A 100% investment in the VBMFX which is a proxy for the bond market;
- A 100% investment in the VBIAX which is a suitable proxy for the classic 60% Equity/40% Bond portfolio;
- A 100% investment in a 60% S&P500TR 40% Serenity portfolio; and
- A 100% investment in the Serenity Portfolio.
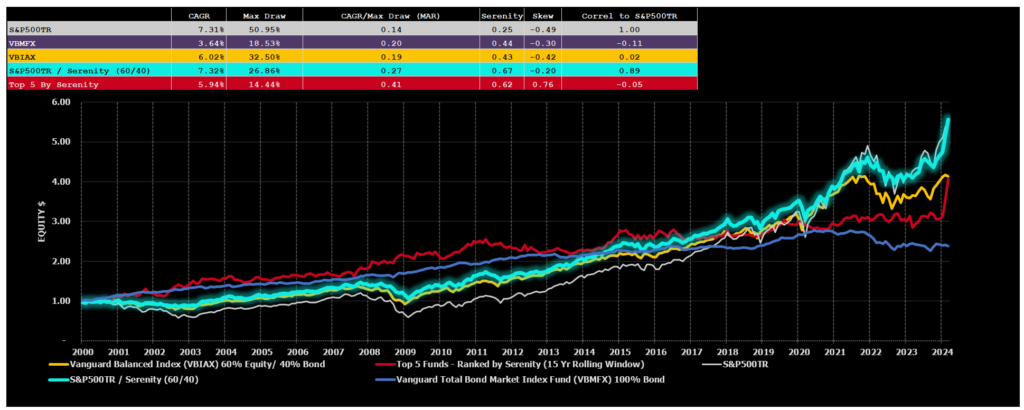
The comparison of alternative portfolio allocations above highlights the strong historic risk adjusted returns that have been enjoyed by 60% S&P500TR / 40% Serenity Composite Portfolio.
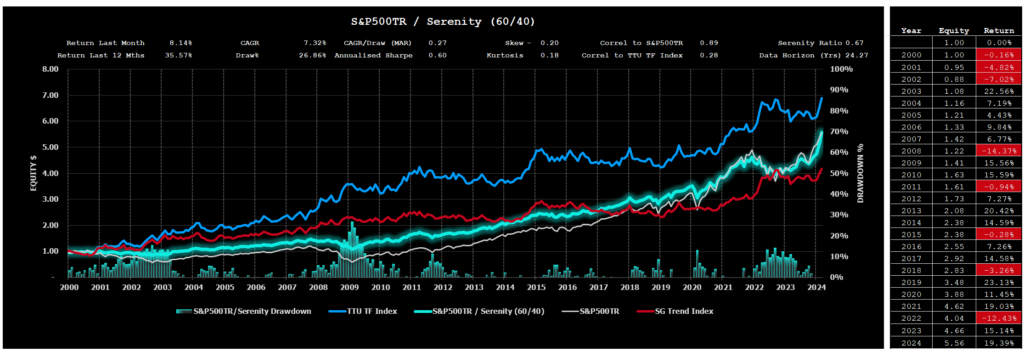
A more detailed assessment of this powerful 60/40 investment option is reflected in Chart 28 below.
Important Disclaimers
This document is directly solely to Accredited Investors, Qualified Eligible Participants, Qualified Clients and Qualified Purchasers. No investment decision should be made until prospective investors have read the detailed information in the fund offering documents of any manager mentioned in this document. This document is furnished on a confidential basis only for the use of the recipient and only for discussion purposes and is subject to amendment This document is neither advice nor a recommendation to enter into any transaction. This document is not an offer to buy or sell, nor a solicitation of an offer to buy or sell, any security or other financial instrument. This presentation is based on information obtained from sources that TopTradersUnplugged (“TTU”) (“considers to be reliable however, TTU makes no representation as to, and accepts no responsibility or liability for, the accuracy or completeness of the information. TTU has not independently verified third party manager or benchmark information, does not represent it as accurate, true or complete, makes no warranty, express or implied regarding it and shall not be liable for any losses, damages, costs or expenses relating to its adequacy, accuracy, truth, completeness or use.
All projections, valuations, and statistical analyses are provided to assist the recipient in the evaluation of the matters described herein. Such projections, valuations and analyses may be based on subjective assessments and assumptions and may use one among many alternative methodologies that produce different results accordingly, such projections, valuations and statistical analyses should not be viewed as facts and should not be relied upon as an accurate prediction of future events. There is no guarantee that any targeted performance will be achieved Commodity trading involves substantial risk of loss and may not be suitable for everyone
TTU is not and does not purport to be an advisor as to legal, taxation, accounting, financial or regulatory matters in any jurisdiction. The recipient should independently evaluate and judge the matters referred to herein. TTU does not provide advice or recommendations regarding an investor’s decision to allocate to funds or accounts managed by any manager (“or to maintain or sell investments in funds or accounts managed by any manager, and no fiduciary relationship under ERISA is created by the investor investing in funds or accounts managed by any manager, or through any communication between TTU and the investor
In reviewing this document, it should be understood that the past performance results of any asset class, or any investment or trading program set forth herein, are not necessarily indicative of any future results that may be achieved in connection with any transaction. Any persons subscribing for an investment must be able to bear the risks involved and must meet the suitability requirements relating to such investment. Some or all alternative investment programs discussed herein may not be suitable for certain investors This document is directed only to persons having professional experience in matters relating to investments. Any investment or investment activity to which this document relates is available only to such investment professionals. Persons who do not have professional experience in matters relating to investments should not rely upon this document.
This document and its contents are proprietary information of TTU and may not be reproduced or otherwise disseminated in whole or in part without TTU’s prior written consent.
This document contains simulated or hypothetical performance results that have certain inherent limitations AND SHOULD BE VIEWED FOR ILLUSTRATIVE PURPOSES. Unlike the results shown in an actual performance record, these results do not represent actual trading. HYPOTHETICAL PERFORMANCE RESULTS HAVE MANY INHERENT LIMITATIONS, SOME OF WHICH ARE DESCRIBED BELOW. NO REPRESENTATION IS BEING MADE THAT ANY ACCOUNT WILL OR IS LIKELY TO ACHIEVE PROFITS OR LOSSES SIMILAR TO THOSE SHOWN IN FACT, THERE ARE FREQUENTLY SHARP DIFFERENCES BETWEEN HYPOTHETICAL PERFORMANCE RESULTS AND THE ACTUAL RESULTS SUBSEQUENTLY ACHIEVED BY ANY PARTICULAR INVESTMENT ACCOUNT.
ONE OF THE LIMITATIONS OF HYPOTHETICAL PERFORMANCE RESULTS IS THAT THEY ARE GENERALLY PREPARED WITH THE BENEFIT OF HINDSIGHT IN ADDITION, HYPOTHETICAL TRADING DOES NOT INVOLVE FINANCIAL RISK, AND NO HYPOTHETICAL TRADING RECORD CAN COMPLETELY ACCOUNT FOR THE IMPACT OF FINANCIAL RISK IN ACTUAL TRADING FOR EXAMPLE, THE ABILITY TO WITHSTAND LOSSES OR TO ADHERE TO A PARTICULAR TRADING PROGRAM OR OTHER ASSET.
There are numerous other factors related to the markets in general or to the implementation of any specific trading program which cannot be fully accounted for in the preparation of hypothetical performance results and all of which can adversely affect actual trading results. No representation is being made that any investment will or is likely to achieve profits or losses similar to those being shown.
Most Comprehensive Guide to the Best Investment Books of All Time

Most Comprehensive Guide to the Best Investment Books of All Time
Get the most comprehensive guide to over 600 of the BEST investment books, with insights, and learn from some of the wisest and most accomplished investors in the world. A collection of MUST READ books carefully selected for you. Get it now absolutely FREE!
Get Your FREE Guide HERE!