


Trend Following Performance Report — November, 2022

Overview
We mentioned in last month’s report that the eerie silence of October made us tread warily into November with a sense of foreboding. Well, our Spidey senses proved us right this time. November was the inevitable dreaded giveback for the Trend Follower.
We love these trends that just seem to go on forever, but we all understand that this is not how real markets work over the long term. What goes up inevitably comes down and vice versa. Fortunately for the global economy a continuous linear growth line is a fiction like perpetual motion machines. The maths may allow for this weird wonderous phenomenon of straight lines, but the physics of the real world makes it clear which side ‘reality’ lies on.
Now as trend followers, the “giveback” is unfortunately a very necessary outcome arising from our models. When striving to maximise trending opportunities using price following with no profit targets, our open-ended profit potential is inevitably constrained by the trailing stops we deploy to exit a trending condition when it decides to turn.
So, despite the inability to exit at market highs or market lows, the price we pay for our non-predictive price following stance is that we inevitably allow for a bit of giveback.
The interconnected nature of financial markets may mean that if we have not spent enough time focussing on how we produce an uncorrelated portfolio, then we may find that the givebacks during these unfavourable trend turning points tend to cluster across financial markets leading to quite significant adverse volatility. It is during these periods of ‘giveback’ we find significant dispersion amongst the Programs, and these can be useful times for us in our navel gazing, as it provides useful information that may help us to ‘de-correlate’ our portfolios further.
Inevitably there will be volatility associated with these givebacks, but the level of volatility will tell us something useful about how leveraged we are, how uncorrelated we are and how robust we are in our journey into an uncertain future.
So as much as we hate the dreaded giveback, it is through adversity during these moments, that the ideas flow in how to improve the robustness of our Trend Following portfolios.
Despite this tale of adversity which we humbly accept, there is a silver lining to this cloud. Our risk mitigation mechanism of stops and trailing stops means that our portfolios are able to fairly quickly adjust to new and emerging trends as we say goodbye to old trends. Our process accepts risk and then releases it, as opposed to other investment processes that hold onto or transfer risk about their portfolio. In this sense our portfolios are constantly adapting by releasing ‘old risk’ to make them more capable of accepting ‘new risk’. Our portfolios are adaptive as we never warehouse risk and are always capable of taking on new risk.
The new and existing return streams that remain in our portfolios are the survivors. We don’t hold onto stale deteriorating return streams that inevitably compromise our portfolios in an uncertain future. We liken our portfolios to a ‘portfolio of species’ where the survivors that reside in that portfolio at any time, are the battle-hardened robust species that have survived and are still ‘fit for purpose’. The trend followers portfolio is an adaptive portfolio that at any point in time is most capable of responding to new foreign regimes yet also capable of surviving what history has already presented.
The decision made about which return streams we select in going forward is not one based on our assumptions we may have about the future outlook. These decisions are derived from systematic data driven processes that simply select survivors that are not only most capable of responding to new foreign environments but also have demonstrated their ability to survive right back through their evolutionary track record. Robustness is not the ability to survive a single regime. Robustness is the ability to survive many different regimes.
Our work in risk management is never done. We are always searching for new regimes to test the robustness of our portfolios. The past is our testing ground to evaluate our models, but it is the future which holds our opportunity. In that future lie new risk events that simply allow us to make our portfolios even more robust.
“It is not the strongest of the species that survives, nor the most intelligent, but the one most adaptable to change” – Leon C. Megginson (not Charles Darwin).
November 2022 Trend Index Performance
November saw the TTU TF Index, BTOP50 Index and the SG Trend Index all give back some of the healthy returns that have been earned in the calendar year.
The TTU TF Index saw a decline of -5.33% adjusting the YTD total to 12.3%. The BTOP 50 Index declined by -4.78% bringing the YTD result to 14.5% and the SG Trend Index declined by -5.96% bringing the YTD result to a still impressive 27.8%.
To understand the slight differences between the performance results of these indexes we need to take a quick detour to understand how they are constructed.
SG Trend Index
The SG Trend Index is designed to track the 10 largest trend following CTA’s of the managed futures space.
Criteria for inclusion in the Index as determined by Society Generale is as follows:
• Must trade primarily futures (including FX forwards);
• Must be broadly diversified across asset classes;
• Must be an industry recognized trend follower;
• Must exhibit significant correlation to trend following peers;
• Must be open the new investment; and
• Must report returns on a daily basis (net of fees).
The index currently is:
• Equally weighted;
• Calculated in base currency;
• Has an inception date of 1st January 2000;
• Rebalanced annually on 1st January; and
• Reconstituted annually on 1st January based on eligibility criteria.
There was a slight modification to the Index from January 2013 to present. Previously the Programs needed to be a constituent of the SG CTA Index and the 10 largest Managers was not a requirement.
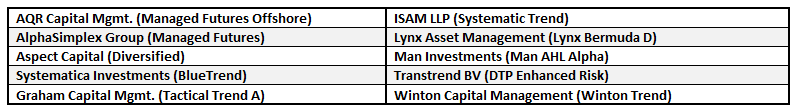
The current listing of the 10 eligible programs in the Index for 2022 are as follows:
The performance of the SG Trend Index since 1st January 2000 to the end of last month is seen in Chart 1 below:
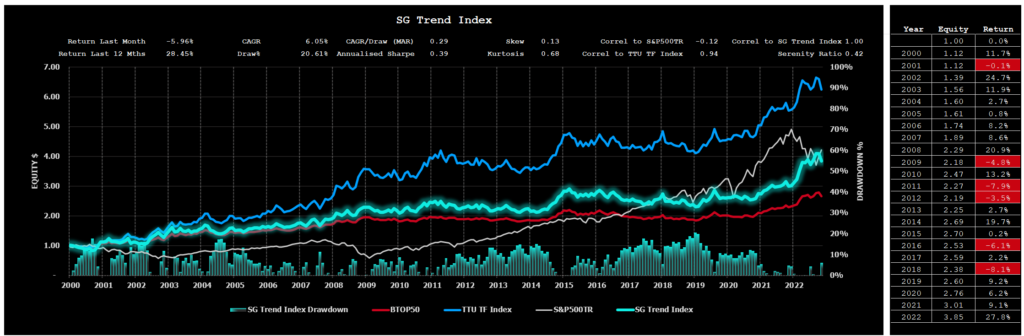
You will notice how the SG Trend Index is highly correlated with the BTOP50 Index and the TTU TF Index and uncorrelated with the S&P500TR Index.
Despite the high correlation between the various trend following Indexes, the long-term performance of these three Trend Following Indexes in terms of CAGR is different. The SG Trend Index plots between the BTOP50 Index and the TTU TF Index.
BTOP 50 Index
The BTOP50 Index seeks to replicate the overall composition of the managed futures industry with regards to trading style and overall market exposure. Unlike the SG Trend Index and the TTU TF Index, the BTOP50 is not strictly a trend following Index and is more broadly representative of the entire managed futures segment of which a dominant style is trend following. We like to think of the BTOP 50 as a ‘quasi trend following Index’ as opposed to a pure trend following Index.
Like the SG Trend Index, the BTOP50 Index is designed to track the performance of the largest Programs by AUM, however the Programs included may not be all Trend Following Programs. Criteria for inclusion in the Index as determined by Barclay Hedge is as follows:
Criteria for inclusion in the Index as determined by BarclayHedge is as follows:
• Must be a Program represented in the Barclay CTA Universe;
• In each Calendar year, the Programs selected must in aggregate be no less than 50% of the investable assets of the Barclay CTA Universe;
• The Programs must be open for investment;
• The Manager must be willing to provide Barclay Hedge with daily return performance;
• The Program must have at least two years of trading activity; and
• The Program’s advisor must have at least three years of operating history.
The index currently is:
• Equally weighted;
• Rebalanced annually on 1st January; and
• Reconstituted annually on 1st January based on eligibility criteria.
Despite the ’50’ tag in the BTOP 50 description, for 2022 there are 20 funds in the Index comprising the following Programs:

The performance of the BTOP 50 Index since 1st January 2000 to to the end of last month is seen in Chart 2 below:
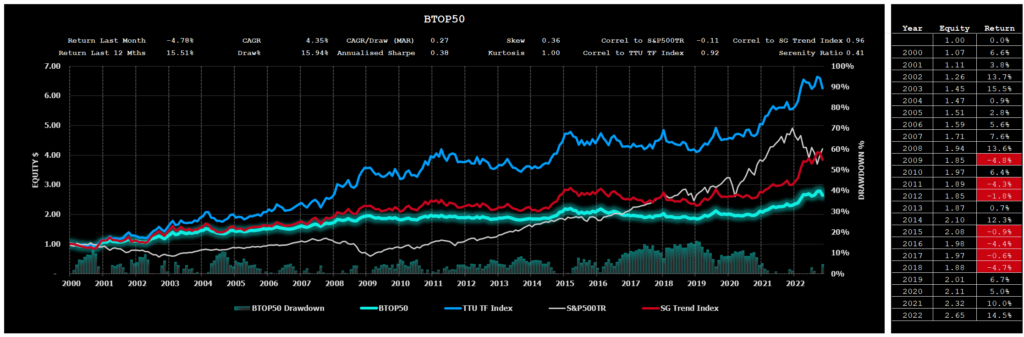
The BTOP 50 Index is highly correlated with the trend following Indexes of the SG Trend Index and the TTU TF Index, however its long-term performance is the lowest of the 3 Trend Following Indexes. While there is a significant representation of Trend Following Programs within the Index, the non-trend following Programs contribute to this diluted long-term performance.
TTU TF Index
The TTU TF Index has been developed by Top Traders Unplugged to provide a performance measure of the trend following programs with a long-term track record.
At TTU, we recognise the importance of a robust trading approach to these uncertain markets and feel that AUM is not a good robustness measure when it comes to assessing performance of the Trend Following industry. It is our strong opinion that the ultimate selection measure to apply in constituting a Trend Following Index is not AUM or a proxy risk metric such as the Sharpe, Sortino, MAR ratio, Ulcer Index or Serenity ratio. The superior metric to assess long-term performance is the long-term validated track record itself.
We have therefore developed a different method for constructing our TTU TF Index. The criteria for inclusion into our Index is as follows:
The criteria for inclusion into the TTU TF Index is as follows:
• Monthly performance results need to be captured in the Nilsson Hedge CTA database;
• Must be geographically diversified across asset classes;
• Must be fully systematic in nature using quantitative rules for entry and exit;
• Must possess at least a 15-year unbroken track record to the current reporting month;
• Must adopt trend following as their dominant investment strategy;
• Are currently active programs; and
• Must report performance monthly (net of fees).
The Index:
• Is Equally weighted;
• Is Rebalanced monthly;
• Is Reconstituted monthly;
• Has an inception date of 1st January 2000
As of 30th November 2022, the TTU TF Index at the date of writing this report comprised the results of 52 Programs. The monthly return for the Index is calculated using the average return produced from those Programs who have reported for the month.
The total listing is now 58 active Programs with Red Rock Capital now dropping from the listing.
The Programs which have not reported for the month at the date of this report are highlighted in the Table below.

The performance of the TTU TF Index since 1st January 2000 to to to the end of last month is as follows:
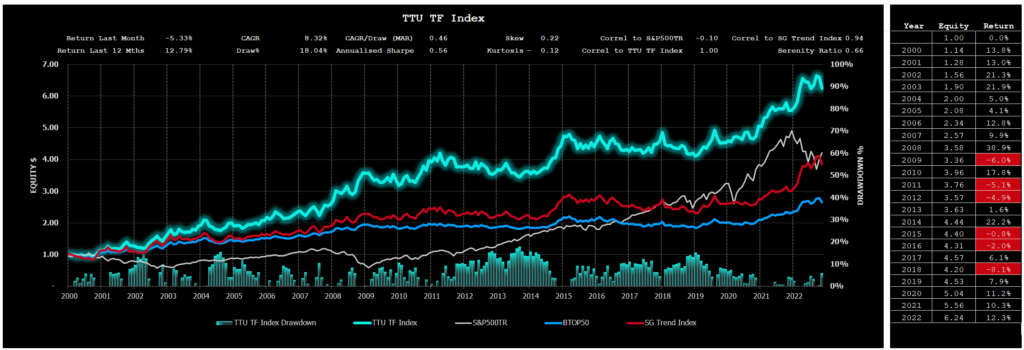
Now you might be intrigued by the performance result of the TTU TF Index. While it is highly correlated with the BTOP 50 Index and the SG Trend Index, we can see that long term performance of the TTU TF Index clearly outstrips alternative Index measures.
The dominant contributor of this outperformance is the requirement for any participating Program in the Index to have a long-term track record. You see, using AUM as a criterion for inclusion is not necessarily a useful selection criteria. While AUM reflects ‘market appeal’, it does not imply that this ‘market appeal’ is strongly correlated with ‘long term performance’.
Our process of Index construction gives us an insight into how any diversified ensemble of trend following Programs with a long-term track record approaches an optimal portfolio as we increase the number of Programs in the Index. Simply by diversifying into a large ensemble of Trend Following Programs with a long-term track record, we magically improve the Index result. CAGR is increased and our drawdowns are reduced.
Of course, we already know this ‘diversification’ principle of Trend Following. As we increase our diversification efforts, we obtain improvement both in terms of the maximum drawdown and in the CAGR generated by the ensemble. This is why we seek to strive for maximum market and system diversification within our individual programs. The TTU TF Index just takes this diversification one step further and diversifies across many different TF Programs to deliver a superior risk-adjusted result.
TTU TF Index Performance
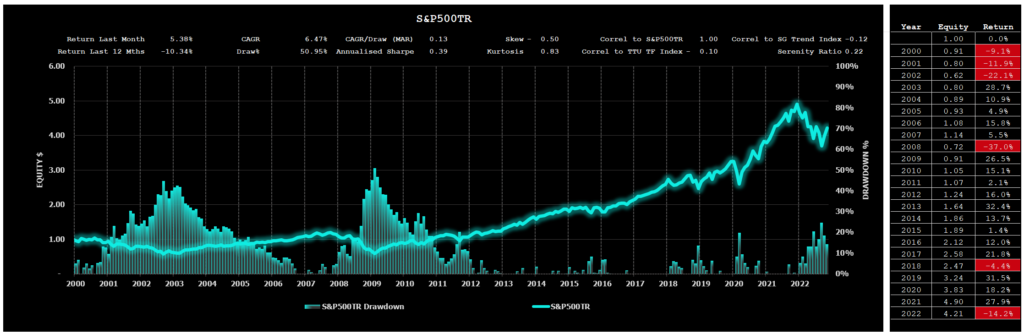
For the period from 1st January 2000 to 30th November 2022, the TTU TF Index has produced a Compound Annual Growth Rate of 8.32% with a Maximum Drawdown of 18.04% (Refer to Chart 3 above). This compares very favourably against the performance of the S&P500 Total Return Index (includes dividends) which has produced a Compound Average Growth Rate of 6.47% with a Maximum Drawdown of 50.95% over the same period (Refer to Chart 4 below).
TTU Trend Barometer
The TTU Trend Barometer is not surprisingly also reflecting an unfavourable market regime for Trend Followers having decreased from a reading of 41 in October to a current reading of 25.
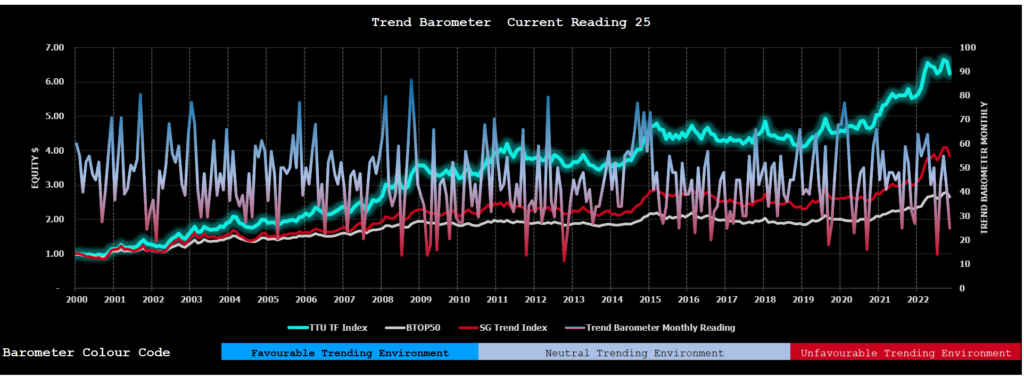
The Trend Barometer is a proprietary tool we use at TTU to assess the trend strength of a diversified portfolio consisting of 44 markets across all sectors. We firstly subdivide the trend strength of each market of a hypothetical diverse portfolio into five ranges from strong up, medium up, neutral, medium down and strong down. We then aggregate these results into a single portfolio number which we use to describe the overall trend strength across a hypothetical Program portfolio.
We then arbitrarily divide this percentage range into 3 where a value of 0-30 is considered a very unfavourable market regime for trend following Programs, a range between 30 to 55 is a somewhat neutral environment for Trend Following Programs (but not an environment where you could expect consistent performance) and values more than 55 are considered to be a favourable regime towards Trend Following Programs, where they should see good performance.
This method is surprisingly powerful in describing CTA monthly performance and can be used to connect market trading environments to resultant Manager performance.
November 2022 Macro Environment
For a blow-by-blow macro wrap for the month, we recommend you listen to our weekly systematic investor series by clicking on the links below. It is also worthwhile listening to our past catalogue as it provides you with an understanding of how these markets can shape the emotions of a Trader and why it is therefore essential that Trend Followers adopt systematic rules-based processes to keep these emotions in check.
- 217 Systematic Investor Series ft Robert Carver
- 218 Systematic Investor Series ft Richard Brennan
- 219 Systematic Investor Series ft Cem Karsan
- 220 Systematic Investor Series ft Mark Rzepczynski
- 221 Systematic Investor Series ft Alan Dunne
Top Traders Unplugged Trend Following Program (TTU TF Program)
You may have noticed that in the Systematic Investor Series I have have been mentioning from time to time my proprietary system which I traded before my involvement with DUNN. I have taken my listeners under the hood to better understand the thinking behind the design process of this trend following model in the following episodes:
- 120 Systematic Investor Series – January 2nd, 2021; and
- 121 Systematic Investor Series – January 6th, 2021.
The TTU Trend Following Program is also a kind of experiment for me, as I decided not to make any changes to the design or parameters in the program since about 2013, to see how a medium-term trend following strategy would perform without any new research and improvements.
We have continued to track the performance of this trend following model on an ‘after fee’ NAV basis simply to provide a context for my listeners to understand how the performance of this classic trend following model (albeit not as long-term as others) performs against other, perhaps more recent Trend Following Programs whose methods have ‘drifted’ away from the traditional Trend Following roots.
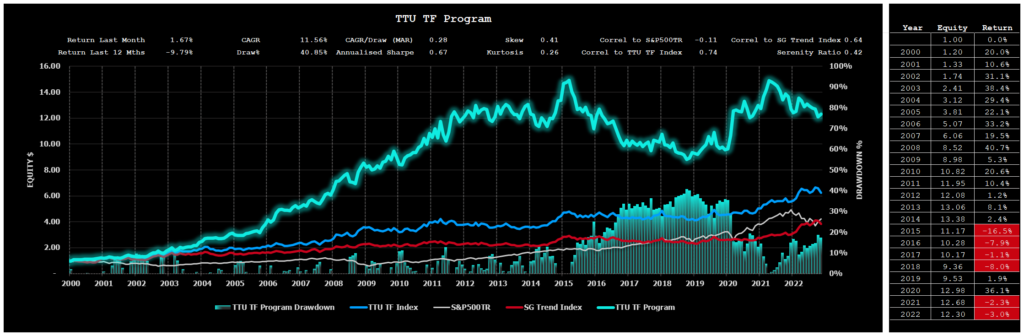
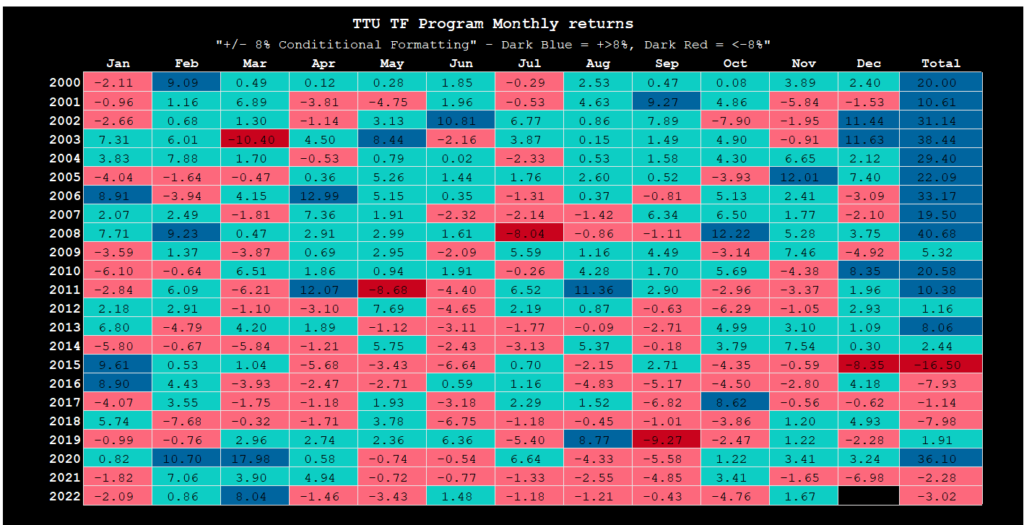
Despite a difficult drawdown period between May 2015 to Feb 2019, the TTU Trend Following model continues to perform during market regimes that are more volatile and uncertain, although in 2022, its shorter-term models (Group 3), have had a difficult time.
November, thanks to the short term models, saw the TTU Trend Following Program buck the overall Trend Following result and saw an increase of 1.67% with the current Drawdown reducing to 17.43% Refer to Chart 6 and Table 1).
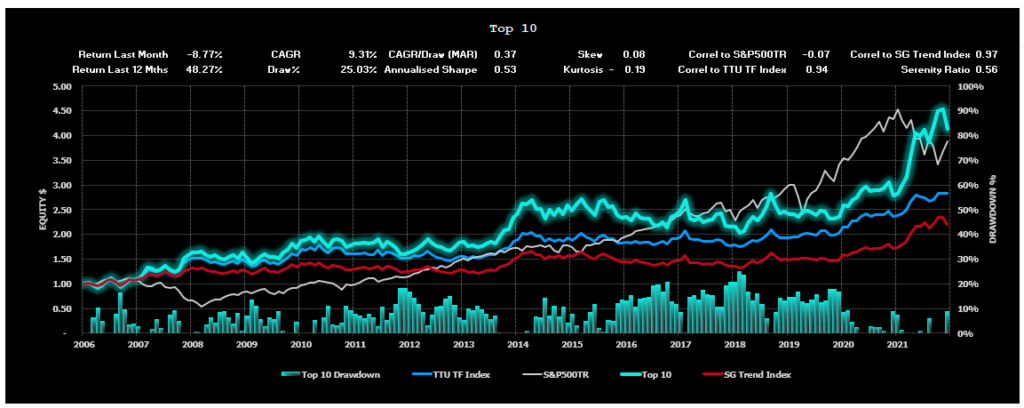
Blend of the Month (Top 10 Trend Following Ensemble)
The ‘Blend of the Month’ showcases the optimal ensemble of 10 Trend Following Programs in terms of Risk Adjusted Return (using MAR) which is selected from our TTU TF Index using data from 1st January 2000 to the reporting month.
We use an algorithm to iterate through the monthly performance results of each Program in the Index over the long-term and collate the optimal blend.
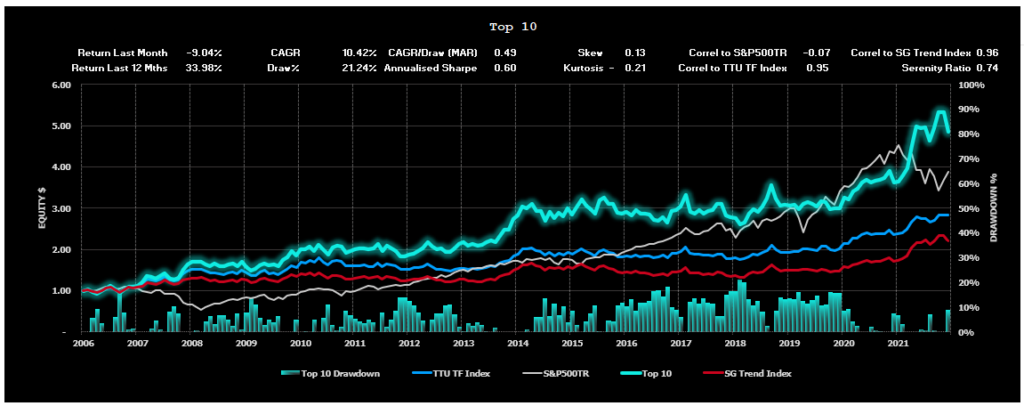
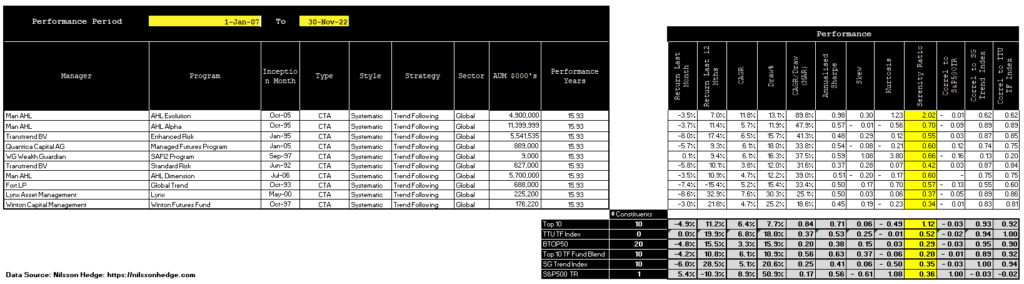
Without further ado, the Blend of the Month for the period 1st January 2000 to 30th November 2022 is as follows.
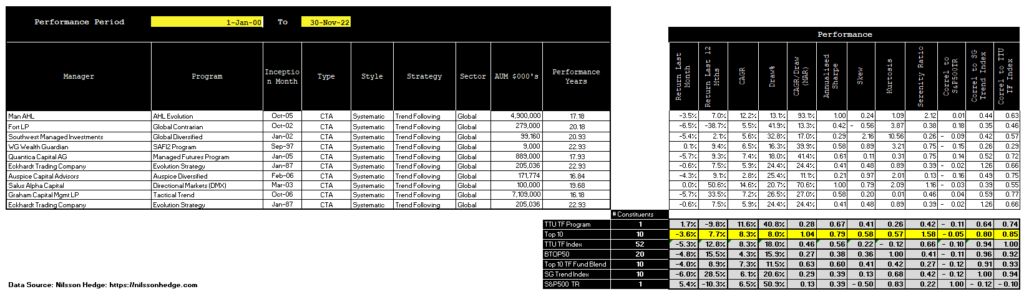
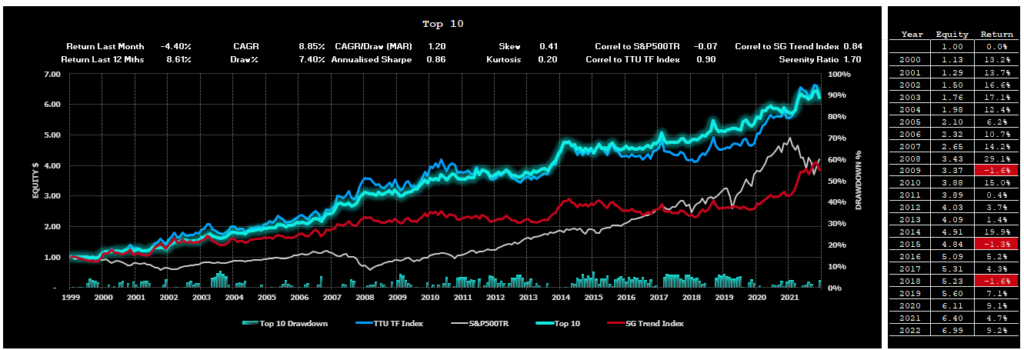
This Blend of the month is simply used to illustrate how an ensemble of 10 Trend Following Programs with a long-term track record could theoretically be chosen using the benefit of hindsight to produce stunning performance results with little volatility.
In practice however we do not have the benefit of hindsight when selecting the Programs we wish to compile for an uncertain future.
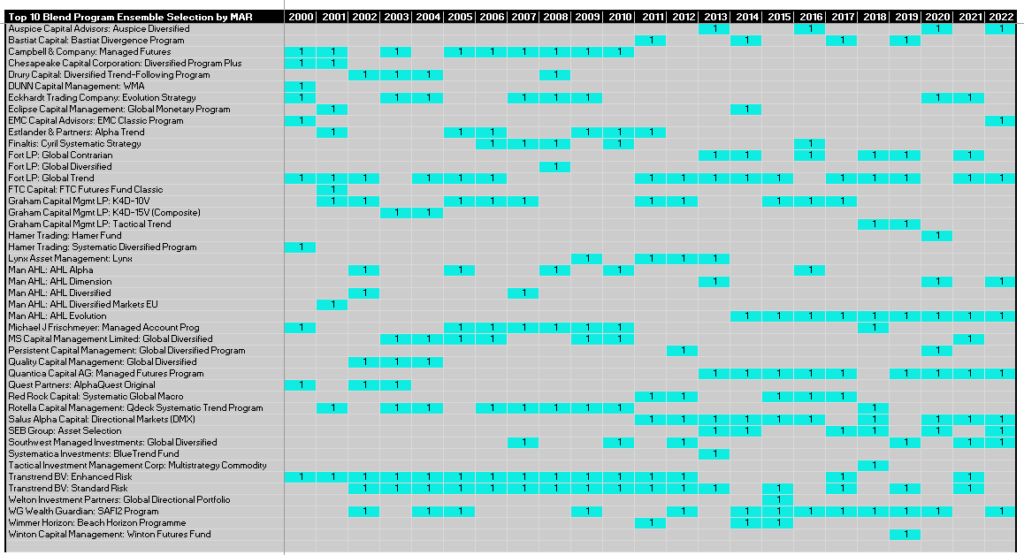
We do however have a process that can be adopted which does not use hindsight bias and selects a compilation of 10 Programs each year which configures an optimal risk adjusted solution through an iteration process using historical long-term performance data.
The intent of this exercise is to demonstrate that while we lack the benefit of hindsight in selecting optimal candidates for a Trend Following Portfolio, we can get close to achieving similar performance results over the long term as the hypothetical blend detailed above.
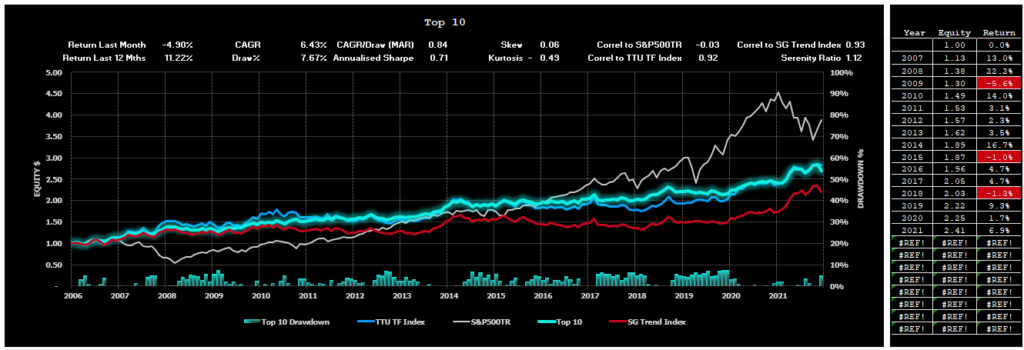
The selection of contributing Programs for this powerful blend which we adopt each year is as follows.
The consolidated performance results of this selection process are as follows:

While overall performance results are marginally inferior to the hypothetical ‘Blend of the Month’ with slightly lower CAGR of 7.39% compared to 8.85% over the same reporting period and higher Drawdowns of 11.54% versus 7.40%, we can see how the overall performance metrics of the “non-cherry picked” blend approaches the ‘optimal’ portfolio solution in terms of risk adjusted performance.
Top 10 Lists
We have prepared the following Top 10 lists for various performance categories based on monthly performance returns for a 15-year period commencing 1 January 2007 to 30 November 2022.
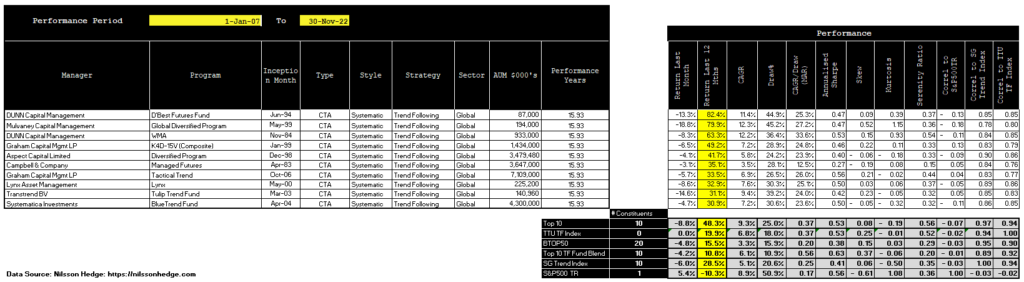
Top 10 Listing – by Compound Annual Growth Rate
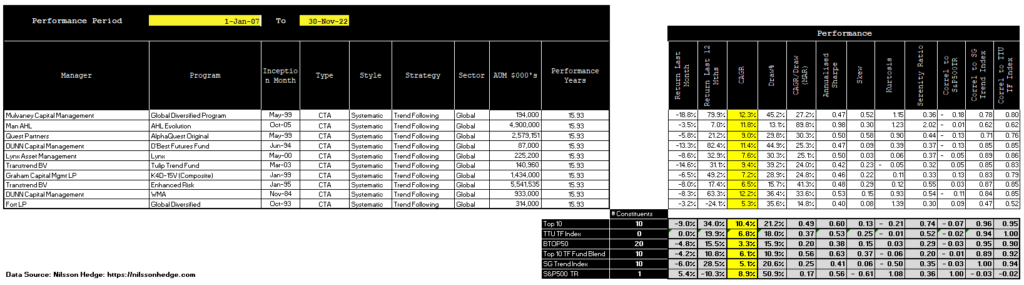
Top 10 Listing – by Risk Adjusted Return (Serenity Ratio)
Top 10 Listing – by Last 12 months Performance
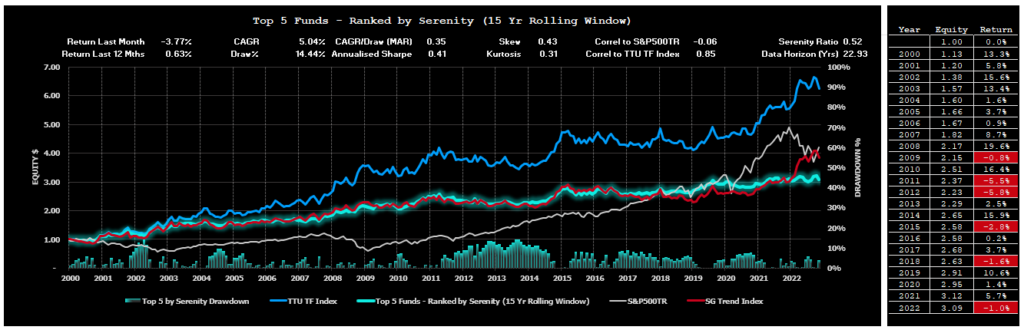
Performance Results for the TTU Top 5 by Serenity Ratio
In a recent research project, we undertook at TTU, we examined three different allocation methods that could be deployed by an investor seeking to optimally allocate investment funds towards 5 of the Top ranked Globally Diversified Systematic Trend Following Programs with a long-term track record.
These three methods adopted 3 different forms of performance metric, namely:
- Top 5 Performers by Compound Annual Growth Rate (CAGR) using a rolling lookback of 15 years.
- Top 5 Performers by MAR ratio (CAGR/Max Draw%) using a rolling lookback of 15 years.
- Top 5 Performers by Serenity Ratio using a rolling lookback of 15 years.
The findings of our project can be obtained by clicking on this link.
Our research determined that the optimal selection method was the Serenity Ratio method.
The Performance for the month of November 2022 of our Top 5 Selection Method using the Serenity Ratio was a decrease of -3.77% bringing the YTD result to -1.0% (Refer to Chart 7).
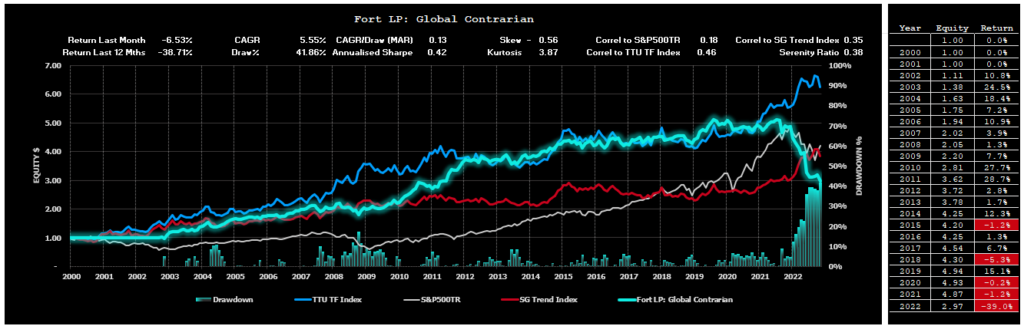
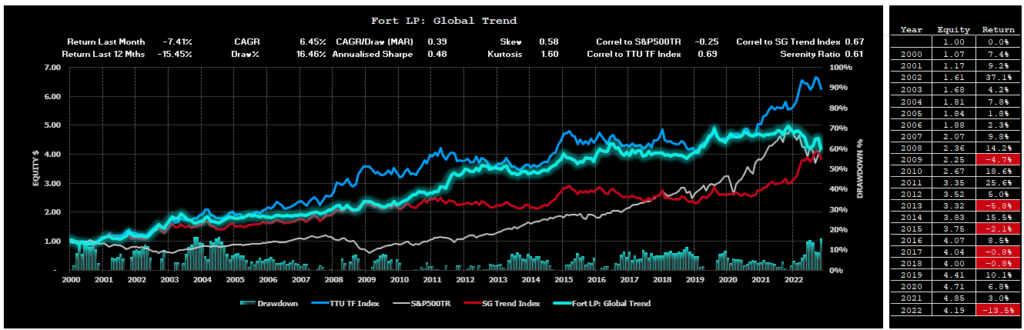
Cracks are starting to show in two the Programs used for this year’s Serenity selection. Despite a long history of powerful serenity performance, the Fort Program’s that are included in the selection are either at or approaching their Maximum Drawdowns. Fortunately, the balance of Programs selected in the listing are managing to stem the Drawdown impact on the entire ensemble.
Despite the unfavourable performance of the Fort Programs in our serenity allocation, our process of selection demands that we continue to stick with the selection for 2022 until the rebalance at the end of the 12-month review process.
When the rebalance occurs, the deterioration in the Serenity ratio for the Fort Programs means that it will be unlikely that they will meet the selection criteria for next year. Our process allows for the adaptive evolution of our listing over time where weak performers are dropped from the listing over time as new performance data is received.
Despite the setback arising from poor recent performance from Fort Programs, the ‘Serenity’ selection method continues to perform well from a risk-adjusted perspective. For the entire reporting period, this selection method boasts a CAGR of 5.04% with a Maximum Drawdown of only 14.44% and effectively a “zero” correlation to the S&P500TR Index (-0.06).
The current selection of Top 5 Funds that have been recommended by this research for the investment period between 1st February 2022 and 31st January 2023 are as follows:
- Man AHL: AHL Evolution;
- Fort LP: Global Contrarian;
- Fort LP: Global Trend
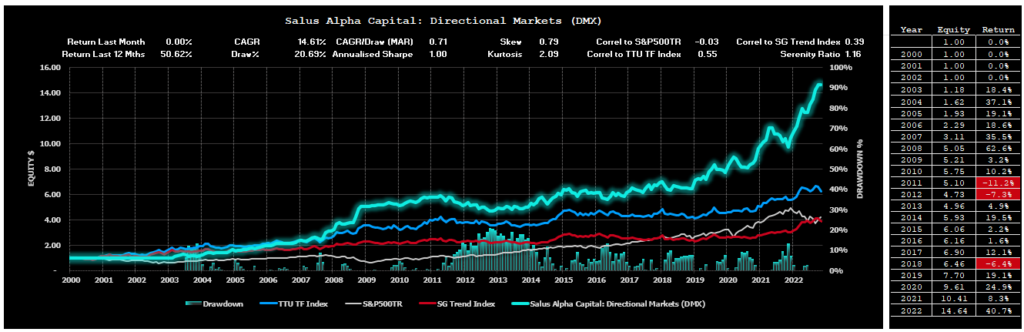
- Salus Alpha Capital: Directional Markets (DMX); and
- Man AHL: Alpha
Individual Performance Results for these 5 Programs used for the Serenity allocation as at 31 October 2022 are as follows:


Performance Results for the Alternative 60/40 portfolio using the TTU Top 5 by Serenity Ratio
In our “How to Invest with the Best” blog post, we also highlighted the significant improved risk-adjusted performance results that could be achieved by replacing the 40% allocation to Bonds in the traditional 60/40 portfolio with an allocation of 40% towards the TTU Top 5 by Serenity ratio.
The evaluation compared the performance of a traditional 60% Equity/40% Bond portfolio against a 60% Equity/40% Serenity portfolio to highlight the uncorrelated historical nature of this Alternative 60/40 portfolio and demonstrate the benefits that a sizeable allocation towards the Serenity portfolio would bring to an investor if equity and bond markets go back to their historic relationship and become more positively correlated in the future. There is no guarantee that correlations remain static over time and it is possible that bond markets and equity markets may lose their uncorrelated relationship that has existed in the last 20 years or so. It is far less likely that the TF managers within the Serenity Grouping will ever be strongly positively correlated to the Equities market, over the long run, given the extensive global diversification and ability to go long and short, that is present within the constituents of the Serenity Grouping.
Chart 8 below showcases the comparative performance results for the period 1 January 2000 to 30 November 2022 of:
- A 100% investment in the S&P500TR portfolio;
- A 100% investment in the VBMFX which is a proxy for the bond market;
- A 100% investment in the VBIAX which is a suitable proxy for the classic 60% Equity/40% Bond portfolio;
- A 100% investment in a 60% S&P500TR 40% Serenity portfolio; and
- A 100% investment in the Serenity Portfolio.
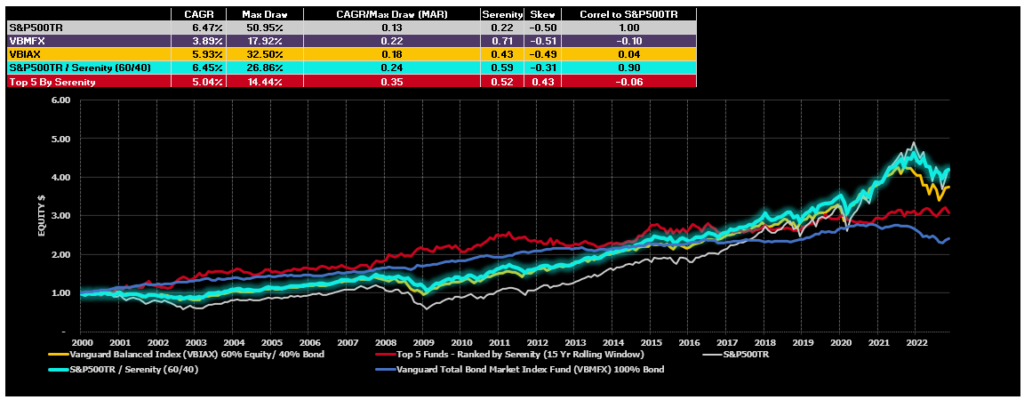
The comparison of alternative portfolio allocations above highlights the strong historic risk adjusted returns that have been enjoyed by 60% S&P500TR / 40% Serenity Composite Portfolio.
A more detailed assessment of this powerful 60/40 investment option is reflected in Chart 9 below.

Important Disclaimers
This document is directly solely to Accredited Investors, Qualified Eligible Participants, Qualified Clients and Qualified Purchasers. No investment decision should be made until prospective investors have read the detailed information in the fund offering documents of any manager mentioned in this document. This document is furnished on a confidential basis only for the use of the recipient and only for discussion purposes and is subject to amendment This document is neither advice nor a recommendation to enter into any transaction. This document is not an offer to buy or sell, nor a solicitation of an offer to buy or sell, any security or other financial instrument. This presentation is based on information obtained from sources that TopTradersUnplugged (“TTU”) (“considers to be reliable however, TTU makes no representation as to, and accepts no responsibility or liability for, the accuracy or completeness of the information. TTU has not independently verified third party manager or benchmark information, does not represent it as accurate, true or complete, makes no warranty, express or implied regarding it and shall not be liable for any losses, damages, costs or expenses relating to its adequacy, accuracy, truth, completeness or use.
All projections, valuations, and statistical analyses are provided to assist the recipient in the evaluation of the matters described herein. Such projections, valuations and analyses may be based on subjective assessments and assumptions and may use one among many alternative methodologies that produce different results accordingly, such projections, valuations and statistical analyses should not be viewed as facts and should not be relied upon as an accurate prediction of future events. There is no guarantee that any targeted performance will be achieved Commodity trading involves substantial risk of loss and may not be suitable for everyone
TTU is not and does not purport to be an advisor as to legal, taxation, accounting, financial or regulatory matters in any jurisdiction. The recipient should independently evaluate and judge the matters referred to herein. TTU does not provide advice or recommendations regarding an investor’s decision to allocate to funds or accounts managed by any manager (“or to maintain or sell investments in funds or accounts managed by any manager, and no fiduciary relationship under ERISA is created by the investor investing in funds or accounts managed by any manager, or through any communication between TTU and the investor
In reviewing this document, it should be understood that the past performance results of any asset class, or any investment or trading program set forth herein, are not necessarily indicative of any future results that may be achieved in connection with any transaction. Any persons subscribing for an investment must be able to bear the risks involved and must meet the suitability requirements relating to such investment. Some or all alternative investment programs discussed herein may not be suitable for certain investors This document is directed only to persons having professional experience in matters relating to investments. Any investment or investment activity to which this document relates is available only to such investment professionals. Persons who do not have professional experience in matters relating to investments should not rely upon this document.
This document and its contents are proprietary information of TTU and may not be reproduced or otherwise disseminated in whole or in part without TTU’s prior written consent.
This document contains simulated or hypothetical performance results that have certain inherent limitations AND SHOULD BE VIEWED FOR ILLUSTRATIVE PURPOSES. Unlike the results shown in an actual performance record, these results do not represent actual trading. HYPOTHETICAL PERFORMANCE RESULTS HAVE MANY INHERENT LIMITATIONS, SOME OF WHICH ARE DESCRIBED BELOW. NO REPRESENTATION IS BEING MADE THAT ANY ACCOUNT WILL OR IS LIKELY TO ACHIEVE PROFITS OR LOSSES SIMILAR TO THOSE SHOWN IN FACT, THERE ARE FREQUENTLY SHARP DIFFERENCES BETWEEN HYPOTHETICAL PERFORMANCE RESULTS AND THE ACTUAL RESULTS SUBSEQUENTLY ACHIEVED BY ANY PARTICULAR INVESTMENT ACCOUNT.
ONE OF THE LIMITATIONS OF HYPOTHETICAL PERFORMANCE RESULTS IS THAT THEY ARE GENERALLY PREPARED WITH THE BENEFIT OF HINDSIGHT IN ADDITION, HYPOTHETICAL TRADING DOES NOT INVOLVE FINANCIAL RISK, AND NO HYPOTHETICAL TRADING RECORD CAN COMPLETELY ACCOUNT FOR THE IMPACT OF FINANCIAL RISK IN ACTUAL TRADING FOR EXAMPLE, THE ABILITY TO WITHSTAND LOSSES OR TO ADHERE TO A PARTICULAR TRADING PROGRAM OR OTHER ASSET.
There are numerous other factors related to the markets in general or to the implementation of any specific trading program which cannot be fully accounted for in the preparation of hypothetical performance results and all of which can adversely affect actual trading results. No representation is being made that any investment will or is likely to achieve profits or losses similar to those being shown.
Most Comprehensive Guide to the Best Investment Books of All Time

Most Comprehensive Guide to the Best Investment Books of All Time
Get the most comprehensive guide to over 600 of the BEST investment books, with insights, and learn from some of the wisest and most accomplished investors in the world. A collection of MUST READ books carefully selected for you. Get it now absolutely FREE!
Get Your FREE Guide HERE!