





Trend Following: Week in Review - October 30, 2026

“Metals Broke Lower, Breadth Thinned. Trend Strength Fell to 36%.”
This Week in Trend – 30 October 2026
Welcome to This Week in Trend, our weekly examination of the evolving structure of global futures markets and what that structure means for systematic trend followers. This edition covers market conditions through the US close on Friday, 30 October 2026. Market returns, the SG Trend Index and the TTU Trend Barometer reading are all as at that close.
Market breadth narrowed for a third consecutive week, yet trend-following returns recovered. Only 14 of 49 futures contracts finished higher, the TTU Trend Barometer fell from 41% to 36%, giving back all of last week’s recovery and moving back below the 40% line that separates a cold environment from the Neutral band, and the SG Trend Index advanced from +14.31% to +14.92% year to date. The contrast was most visible in Metals and Meats. Gold broke below its July low near 4,000, and Silver, Platinum and Lean Hogs recorded the three largest declines on the board, each extending an established downward structure. Meanwhile, several of the year’s leading advances, in Oats, Soybean Meal and the US equity indices, continued to retreat. Fewer markets rose, and fewer met the Barometer’s trend-strength criteria, yet the moves that persisted were substantial: all ten of the largest moves on the board were declines, and eight of them ran with the structures beneath them. Breadth and trend prevalence pointed the same way this week, and portfolio returns went the other.
Last week’s report closed by asking whether the Barometer could hold above the 40% line or would slip back into a cold environment, and whether the 10-day rate of change would turn with it. It fell 5 points to 36%, giving back all of last week’s gain, while the 10-day rate of change eased from Falling Moderately to Falling Weakly. Five other questions were left open. Would the pullbacks in Oats, Soybean Meal and Canola stop above the levels from which their climbs began? Would WTI and Brent hold the upper parts of their ranges? Would Gold’s July low near 4,000 hold? Would the bounce in Bonds become a higher high? And where would October close for the SG Trend Index? Canola held close to last week’s level, while Oats and Soybean Meal fell further, Soybean Meal back toward the level from which its September climb began, and Rough Rice eased from its high. WTI rose for a fourth week while Brent eased slightly from the top of its range. Gold did not hold, falling to near 3,885. Bonds rose for a fourth week, and none of the four charts has yet set a higher high. And the SG Trend Index, which stood at -1.29% for October a week ago, closed the month at -0.77% on SG’s estimated figure.
Trend Indicators: Barometer Falls to 36%, SG Trend Index Recovers

TTU Trend Barometer: 36%, down from 41% last week. TTU describes overall trend strength as Moderately Weak, down from Neutral, and the reading has moved 4 points below the 40% line into the cold environment, 19 points below the 55% threshold for a favourable environment. The 10-day rate of change now reads Falling Weakly, compared with Falling Moderately a week ago, so TTU’s short-term measure is still declining, though less steeply. The five-week sequence, from 2 October to 30 October, now stands at 52, 50, 36, 41 and 36. The reading is 6 points above the late July low of 30% and 16 points below the 52% at which the sequence begins, and it has given back all 5 points it recovered last week, returning to its 16 October level. The lower reading indicates that fewer markets met the Barometer’s medium-to-strong trend criteria. It does not, by itself, establish how trend-following portfolios performed or whether the remaining trends became less profitable.
Set against the performance table, breadth and the reading fell together, while the moves themselves grew larger. Fourteen of 49 contracts rose, down from 19, and seven of the ten categories in the snapshot fell, the same as a week ago. The average absolute weekly move increased from 2.34% to 2.54%, while the spread between the largest gain and the largest loss narrowed from 19.74 to 14.03 percentage points, because no single contract moved as far this week as Natural Gas did last week. The board was busier, and most of the extra movement was on the downside. Narrow participation alongside a cold reading separates two counts that are easy to conflate: how many markets rose, and how many are trending. The Barometer measures the second, and a market trending lower is part of that count as much as one trending higher.
Because the reading counts trends rather than weighing weekly price changes, a week of larger moves does not necessarily lift it, and this week the measured proportion of trending markets eased even as the average absolute move widened. The ten largest moves on the board illustrate the mix without explaining the reading. All ten were declines, and eight of them ran with the structures beneath them, up from five a week ago. Lean Hogs, Silver, Platinum, Palladium and Natural Gas extended their declines, Orange Juice fell back toward the lows of the decline that has run most of the year, Coffee resumed the decline from its July spike, and Bitcoin fell further inside the decline from above 120,000. Two ran against: Oats and Soybean Meal fell further from the highs that had led the Grains complex. The largest gain on the board, the VIX at 3.81%, was only the fourteenth largest move overall. Further down the table, the counter-trend share remained large.
The sector data is consistent with a trend environment that stayed cold, with the declines doing more of the work than the advances. Running with their structures, Gold broke below its July low, Silver fell to its lowest level since the winter, Platinum moved further below its summer low and Palladium fell below 1,000. Lean Hogs set another low, EUR moved to the lowest level on its chart, Corn fell for a fifth week and Wheat for a ninth, Coffee gave back its rebound, and Orange Juice fell back toward its lows. WTI rose within its advance. Running against them, Oats and Soybean Meal fell further from the top of their charts, Rough Rice eased from its high, Sugar pulled back from its high for a second week, and Copper eased for a third week from close to its own. All four Bonds maturities rose for a fourth week inside their declines, and the DAX, Euro Stoxx 50 and the Russell 2000 lifted inside their pullbacks. Both cattle contracts gave back their bounces and resumed the declines from their spring highs. At 36%, the reading sits alongside a board on which the declines extended across Metals, Meats and Grains while few advances outside the petroleum complex made progress.

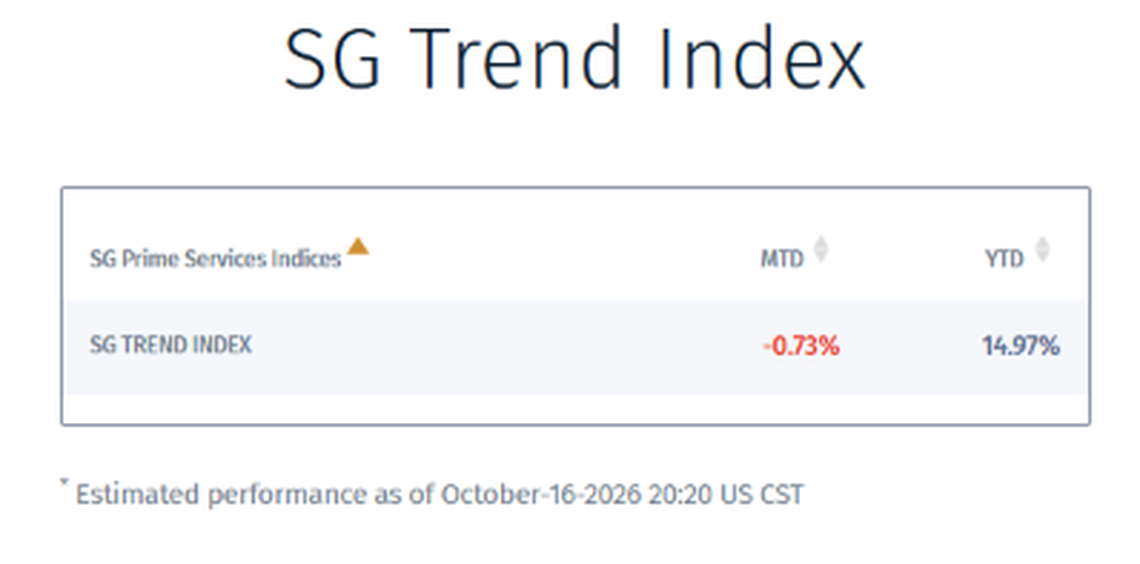
SG Trend Index: -0.77% month to date for October and +14.92% year to date as of 30 October, on SG’s estimated figure. The year-to-date figure has risen from +14.31% to +14.92%, a gain of 0.61 percentage points and the index’s first weekly gain in three weeks, recovering most of last week’s 0.66 point decline. With 30 October the last trading day of the month, the month-to-date figure now covers all twenty-two trading days of October. Set against the Barometer, the index rose while the reading fell, the reverse of last week. Over the last five weeks the Barometer has held, fallen 2, fallen 14, risen 5 and fallen 5, while the index has given back 0.33 percentage points, added 0.42, given back 1.17, given back 0.66 and added 0.61. This is the third time in five weeks that the two have moved in opposite directions. The Barometer counts trending markets, while the index records what institutional trend-following portfolios earned, and a fall in the first need not show up in the same week’s returns. The index’s recovery is consistent with an environment in which persistent declines offered opportunities for short positions, even as several established advances remained interrupted. Without the index’s underlying positions and return contributions, the precise sources of its improvement cannot be established. Across the five weeks the index has given back 1.13 percentage points.
Weekly Asset Class Snapshot
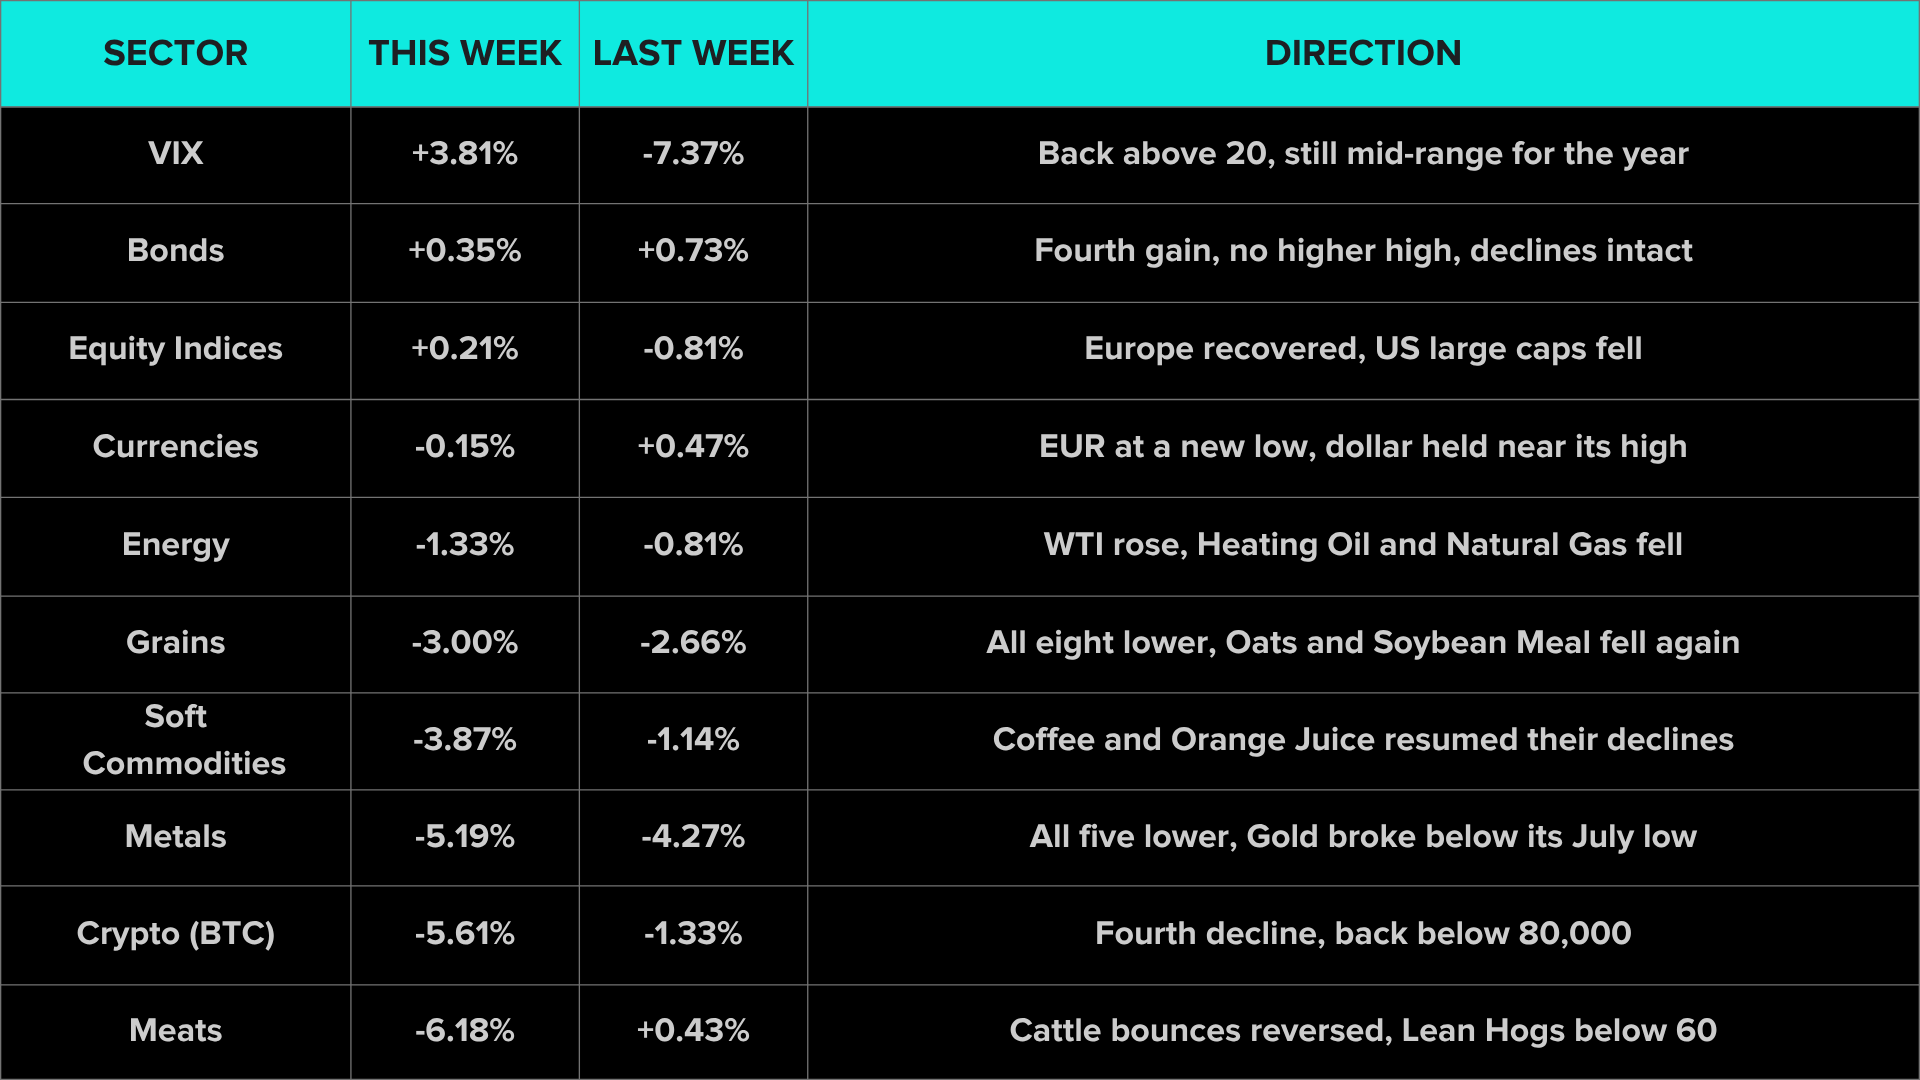
Sector averages are simple equal-weighted means of the constituent contracts in each sector.
Equity Indices (+0.21% | prev -0.81%)

Equity Indices gained 0.21% with three of seven contracts higher, the sector’s first weekly gain in four weeks and a narrow one. The DAX rose 2.58%, the second largest gain on the board, the Russell 2000 1.32% and Euro Stoxx 50 1.14%, while the Nikkei 225 fell 0.09%, the S&P 500 0.60%, the DJIA 0.91% and the Nasdaq 100 2.00%. Last week Europe and Japan led the decline while the US indices were mixed. This week Europe led the recovery and the US large-cap indices fell, with Finviz’s charts showing sharp falls in the final session. The DAX near 25,810 recovered last week’s loss, still inside the range below its late August high, and Euro Stoxx 50 near 6,120 lifted from the June levels to which its pullback had run. The Russell 2000 near 2,820 rose for a second week from the lower part of its pullback from the summer high near 3,100. The Nasdaq 100 near 28,545 fell further from its high near 31,500, the S&P 500 near 7,615 eased again from its own, and the DJIA near 51,930 slipped back below 52,000, still under its August high near 54,000. The Nikkei 225 near 62,480 held in the middle of its summer range. The advances that have run since the spring remain visible on all seven charts, but none of the seven set a high this week, and the pullback in Europe has now run for two months.
Energy (-1.33% | prev -0.81%)

Energy fell 1.33% with two of six contracts higher, a second weekly decline and a larger one. Crude Oil WTI rose 0.82% and Gasoline RBOB 0.60%, while Crude Oil Brent fell 0.20%, Ethanol 1.10%, Heating Oil 3.11% and Natural Gas 4.98%, the tenth largest move on the board. Without Natural Gas, the sector average would be close to -0.60%. WTI near 103 rose for a fourth week and holds the upper part of the range it has built since the spring, while Brent near 112 eased slightly after reaching the top of its own range last week. Heating Oil near 4.66 pulled back from the area of its high, and Gasoline RBOB near 3.11 remains inside the range below its spring high. Ethanol near 2.02 eased for a second week from the highest level on its chart. Natural Gas near 2.88 fell again within the base it has held since the summer, and the decline that has run since February remains the dominant feature of its chart. Last week the crude contracts rose sharply while Natural Gas collapsed. This week the moves were smaller, the crude advances paused rather than reversed, and Natural Gas again ran with its decline.
Metals (-5.19% | prev -4.27%)

Metals fell 5.19% with all five contracts lower for a third week, the third weakest sector on the board and a larger decline than last week’s. Copper fell 0.39%, Gold 2.72%, Palladium 6.07%, Platinum 8.09% and Silver 8.66%, the second largest decline on the board. Last week the precious metals fell further and faster, and Gold fell back to the area of its July low. This week that level gave way. Gold near 3,885 broke below its July low near 4,000 to the lowest level on its chart, extending the decline from its late winter peak. Silver near 49.14 fell below 50, extending its fall to the lowest level since the winter. Platinum near 1,435 moved further below its summer low, and Palladium near 978 fell below 1,000 to another low. Copper near 6.51 eased for a third week, a small move from close to the highest level on its chart, and the advance that has run since last autumn is intact. Four of the five moves ran with the structures beneath them for a third week. For a portfolio maintaining short exposure to the prevailing declines in the precious metals, the larger weekly falls would have contributed positively for a third week, subject to position sizing and execution, while Copper’s small decline would have been a modest cost to one following an advance that remains in place.
Soft Commodities (-3.87% | prev -1.14%)
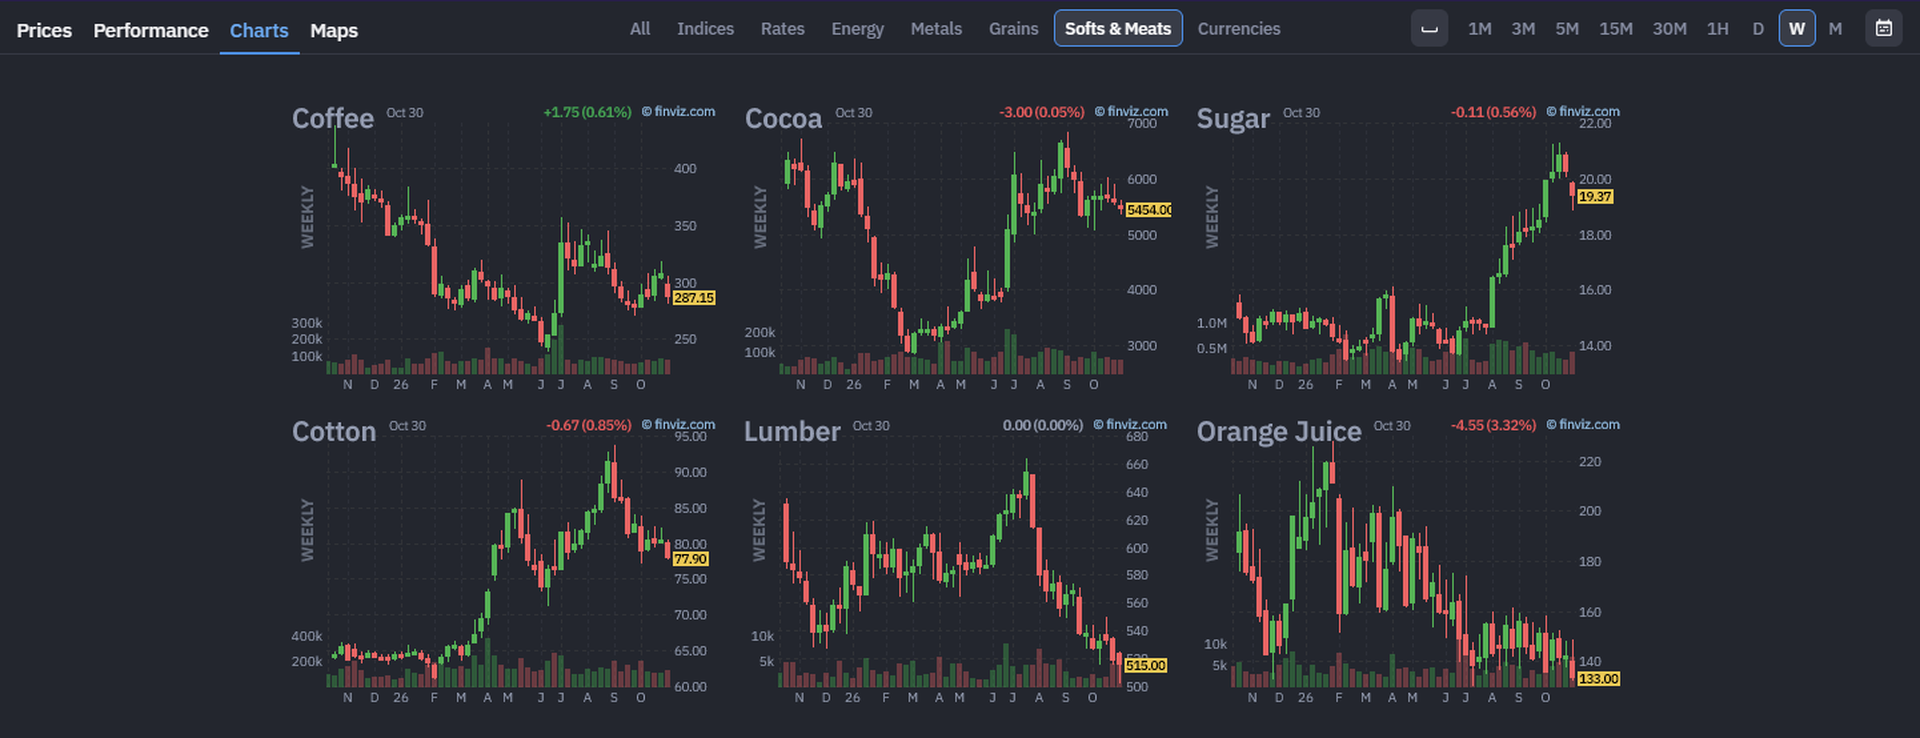
Soft Commodities fell 3.87% with five of six contracts lower and Lumber unchanged, a second weekly decline and a much larger one. Cocoa fell 2.49%, Cotton 2.96%, Sugar 4.35%, Coffee 6.59% and Orange Juice 6.83%, the fifth largest decline on the board. Coffee near 287 gave back the rebound of recent weeks and resumed the decline from its July spike. Orange Juice near 133 fell back to the lowest levels on its chart, extending the decline that has run most of the year. Sugar near 19.37 pulled back from its high for a second week, though it remains well above the area from which its breakout began and the breakout still stands. Cotton near 77.90 eased further below its August high, and Cocoa near 5,455 slipped again inside its rebound from the spring. Lumber near 515 held close to the low it set last week. Last week Sugar’s pullback would have worked against a portfolio following its advance, and the falls in Lumber and Orange Juice would have favoured one positioned with their declines. This week Sugar’s second pullback was a further cost to the advance, while the falls in Coffee and Orange Juice would have favoured a portfolio positioned with their declines.
Grains (-3.00% | prev -2.66%)

Grains fell 3.00% with all eight contracts lower, a third weekly decline and a slightly larger one. Canola fell 0.35%, Rough Rice 0.50%, Soybean Oil 1.39%, Corn 1.81%, Soybeans 2.70%, Wheat 3.44%, Soybean Meal 6.21% and Oats 7.59%, the fourth largest decline on the board. Last week the contracts near their highs pulled back further while Rough Rice extended. This week Rough Rice joined them. Rough Rice near 17.89 eased from its high, a small move against an advance that remains steep and intact. Oats near 344 gave back most of its rise to the high set three weeks ago, and Soybean Meal near 325 fell back toward the level from which its September climb began. Canola near 779 held close to last week’s level below the top of its chart, and Soybeans near 1,234 fell further from its September high. Corn near 448 fell for a fifth week, back toward the level it held before its August gap, and Wheat near 603 fell for a ninth week as it unwinds its August spike. Soybean Oil near 65.8 eased inside the range below its summer peak. Two of the eight moves, Corn and Wheat, ran with the structures beneath them. The advances in Oats and Soybean Meal have now been interrupted for three weeks, and Soybean Meal is close to the point at which a pullback becomes a test of the advance itself.
Meats (-6.18% | prev +0.43%)

Meats fell 6.18% with all three contracts lower, the weakest sector on the board. Live Cattle fell 4.40%, Feeder Cattle 3.93% and Lean Hogs 10.22%, the largest move on the board in either direction. Last week both cattle contracts resumed their bounces. This week they gave them back. Feeder Cattle near 331 and Live Cattle near 221 fell from the upper parts of their bounces, and the declines that have run from their spring highs remain intact, with no higher high on either chart. Lean Hogs near 59.00 moved to another low, extending the decline from its spring high for a fourth week and falling below 60 for the first time on its chart. For a portfolio carrying short exposure in the sector, all three contracts would have contributed positively this week, after a week in which the cattle bounces were a cost.
Bonds (+0.35% | prev +0.73%)
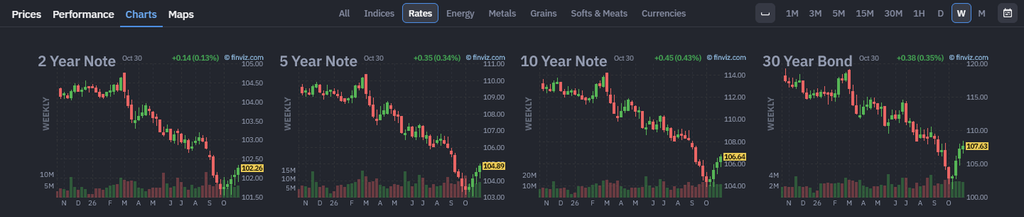
Bonds gained 0.35% with all four contracts higher, a fourth weekly gain and a smaller one. The 10 Year Note rose 0.46%, the 30 Year Bond 0.38%, the 5 Year Note 0.37% and the 2 Year Note 0.19%. For the first time in four weeks the gains did not grow with maturity: the 10 Year Note led, and the long end lifted less than it has in recent weeks. The 30 Year Bond near 107.63 and the 10 Year Note near 106.64 have recovered a larger share of their autumn falls, and the 5 Year Note near 104.89 and the 2 Year Note near 102.26 lifted further from their lows. Last week this report asked whether the bounce would become a higher high or the declines would resume. Neither has happened yet. The bounce has now run for four weeks, but none of the four charts has set a higher high, and the declines that have run since the winter peaks remain intact on all of them. For a portfolio carrying short exposure across the curve, the week would have been a cost at every maturity for a fourth week, though a smaller one than in the previous two.
Currencies (-0.15% | prev +0.47%)

Currencies fell 0.15% with four of eight contracts higher, as the dollar held its ground and the basket split. CAD rose 0.30%, GBP 0.17%, CHF 0.11% and the US Dollar Index 0.10%, while AUD fell 0.06%, EUR 0.26%, JPY 0.39% and NZD 1.14%. The Dollar Index near 101.83 held near the highest level on its chart. EUR near 1.1180 moved to the lowest level on its chart, extending the decline that has run since the summer, and CHF near 1.2184 held close to its low. AUD near 0.7026 held just above 0.70, and its climb from last year’s lows remains the firmest upward structure in the basket. CAD near 0.7170 lifted further from its summer low, and GBP near 1.3392 rose within the lower part of its range. NZD near 0.5640 gave back last week’s lift and fell back toward the bottom of its range, and JPY near 0.6366 eased inside the decline that has run all year. Last week the commodity currencies lifted and EUR and CHF slipped. This week EUR ran with its decline to a new low, NZD and JPY fell back in line with theirs, and the lifts in CAD and CHF ran against the structures beneath them.
Volatility, Crypto: The VIX rose 3.81% to near 20.2, the largest gain on the board, moving back above 20 after last week’s fall while remaining near the middle of its range for the year, well below its spring spike near 30. Market pricing reflected a week in which the European indices recovered while the US large-cap indices fell, with the sharpest falls in the final session. Bitcoin fell 5.61% to near 76,900, a fourth weekly decline and the ninth largest move on the board. The rebound from the summer lows near 60,000 has faded back below 80,000, and the decline from above 120,000 remains the dominant feature of its chart.
Top Movers

Top five up and top five down by single-week percentage move.
The two halves of the table are uneven again this week, and for a second week the declines are the larger half, this time by a wide margin and across several sectors rather than because of one move. The five largest gains range from 3.81% to 0.82%, and the five largest declines from 10.22% to 6.83%. The gainers come from three sectors. The DAX, the Russell 2000 and Euro Stoxx 50 lifted inside their pullbacks, WTI rose within its advance, and the VIX rose within its range. The losers come from four sectors. Lean Hogs, Silver and Platinum extended their declines, Orange Juice fell back toward the lows of its decline, and Oats fell further from its high. Across the ten largest moves on the board, all of them declines, eight ran with the structures beneath them, up from five a week ago. The largest moves came overwhelmingly from established declines. That is consistent with an environment in which downside trends persisted, though a sample of ten moves cannot establish the Barometer’s precise reading or account for its 5 point fall.
Portfolio View
For a portfolio positioned with the prevailing trends, the persistent declines in the precious metals, Meats, several agricultural markets and Natural Gas offered potential gains on the short side, while the advances in WTI and Copper held without adding much for long exposure aligned with them. The Barometer fell to 36%, 4 points below the Neutral band, and the SG Trend Index added 0.61 percentage points to +14.92% year to date. On the short side, Gold broke below its July low, Silver, Platinum and Palladium fell further, Lean Hogs and EUR set new lows, the cattle contracts resumed their declines, Coffee and Orange Juice fell back, and Corn and Wheat fell again. WTI rose within its advance, while Rough Rice, Sugar and Copper eased from their highs. The further pullbacks in Oats and Soybean Meal would have worked against positions following their advances, as would the rises in Bonds, CAD and CHF for positions following the prevailing declines. The net result would have depended on each portfolio’s positions, sizing and execution, which a week of prices does not reveal. The week was directional on the downside across Metals, Meats and Grains, while established advances stayed interrupted in the leading Grains and the equity indices, and established declines were interrupted again in Bonds.
Final Reflections
After a week in which breadth and trend strength moved apart, this week they fell together, and the return figure went the other way. Two of the three measures this report tracks fell and the third rose. The split is less contradictory than it looks, because each of the three measures something the others do not.
The week’s lesson sits in the gap between how many markets moved and how far the trending ones travelled. The Barometer counts trends; it does not weigh them. The declines in the precious metals and Lean Hogs were few against the breadth of the board, but each extended a structure already in place, and each was large.
1. Fewer markets rose, and fewer were trending. Breadth and trend strength fell together, while the size of the moves increased.
The five-week sequence now reads 52, 50, 36, 41 and 36. The reading sits 4 points below the Neutral band, back at its 16 October level, while its 10-day rate of change reads Falling Weakly. With declines extending and several of the year’s leading advances still interrupted, the reading gave back all of last week’s 5 point recovery.
2. The return figure rose while the Barometer fell. The index’s recovery is consistent with persistent declines offering opportunities even as established advances stalled.
For a trend-following portfolio, persistent movement in the direction of its positions creates opportunities for gains, while reversals can impose losses, and the eventual contribution depends on exposure, position sizing and execution. Eight of the ten largest moves this week ran with the structures beneath them, so the week offered more persistence than a cold reading might suggest. Without the index’s underlying positions and return contributions, the precise sources of its improvement cannot be established.
This week was a reminder that the direction of a move and its value to a trend follower are separate measurements. Silver fell 8.66%, a move that would have benefited a position aligned with its decline, while Oats fell 7.59%, a move that would have worked against a position following its advance. WTI rose 0.82% and would have benefited a position aligned with its advance, while the 10 Year Note rose 0.46% and would have worked against a position carrying short exposure in its decline. Rising markets are not good markets for a portfolio positioned against them, and falling markets are not bad ones for a portfolio positioned to fall with them. What matters each week is whether a market moved with the structure a portfolio was following.
The week ahead is therefore about whether the Barometer can hold at 36%, the low of its five-week sequence, or extends toward its late July low of 30%, and whether the 10-day rate of change, now Falling Weakly, turns up. Metals are the sector to follow: Gold has broken below its July low near 4,000, and whether the break extends or the level is reclaimed matters for the whole precious metals complex. In Grains, Soybean Meal has fallen back toward the level from which its September climb began, and whether it holds there will shape the complex. Bonds have bounced for four weeks without a higher high. The US equity indices ended the week with sharp falls in the final session, and their pullbacks from the highs remain open. And November opens with the SG Trend Index at +14.92% for the year. In each case the question is the same one it always is: does the structure persist? For trend followers, up or down was never the central question. Persistence was. The opportunity was directional, but not directionally biased.

List of Resources used in the Week in Review
Important Disclaimers
This document is directly solely to Accredited Investors, Qualified Eligible Participants, Qualified Clients and Qualified Purchasers. No investment decision should be made until prospective investors have read the detailed information in the fund offering documents of any manager mentioned in this document. This document is furnished on a confidential basis only for the use of the recipient and only for discussion purposes and is subject to amendment This document is neither advice nor a recommendation to enter into any transaction. This document is not an offer to buy or sell, nor a solicitation of an offer to buy or sell, any security or other financial instrument. This presentation is based on information obtained from sources that TopTradersUnplugged (“TTU”) (“considers to be reliable however, TTU makes no representation as to, and accepts no responsibility or liability for, the accuracy or completeness of the information. TTU has not independently verified third party manager or benchmark information, does not represent it as accurate, true or complete, makes no warranty, express or implied regarding it and shall not be liable for any losses, damages, costs or expenses relating to its adequacy, accuracy, truth, completeness or use.
All projections, valuations, and statistical analyses are provided to assist the recipient in the evaluation of the matters described herein. Such projections, valuations and analyses may be based on subjective assessments and assumptions and may use one among many alternative methodologies that produce different results accordingly, such projections, valuations and statistical analyses should not be viewed as facts and should not be relied upon as an accurate prediction of future events. There is no guarantee that any targeted performance will be achieved Commodity trading involves substantial risk of loss and may not be suitable for everyone
TTU is not and does not purport to be an advisor as to legal, taxation, accounting, financial or regulatory matters in any jurisdiction. The recipient should independently evaluate and judge the matters referred to herein. TTU does not provide advice or recommendations regarding an investor’s decision to allocate to funds or accounts managed by any manager (“or to maintain or sell investments in funds or accounts managed by any manager, and no fiduciary relationship under ERISA is created by the investor investing in funds or accounts managed by any manager, or through any communication between TTU and the investor
In reviewing this document, it should be understood that the past performance results of any asset class, or any investment or trading program set forth herein, are not necessarily indicative of any future results that may be achieved in connection with any transaction. Any persons subscribing for an investment must be able to bear the risks involved and must meet the suitability requirements relating to such investment. Some or all alternative investment programs discussed herein may not be suitable for certain investors This document is directed only to persons having professional experience in matters relating to investments. Any investment or investment activity to which this document relates is available only to such investment professionals. Persons who do not have professional experience in matters relating to investments should not rely upon this document.
This document and its contents are proprietary information of TTU and may not be reproduced or otherwise disseminated in whole or in part without TTU’s prior written consent.
This document contains simulated or hypothetical performance results that have certain inherent limitations AND SHOULD BE VIEWED FOR ILLUSTRATIVE PURPOSES. Unlike the results shown in an actual performance record, these results do not represent actual trading. HYPOTHETICAL PERFORMANCE RESULTS HAVE MANY INHERENT LIMITATIONS, SOME OF WHICH ARE DESCRIBED BELOW. NO REPRESENTATION IS BEING MADE THAT ANY ACCOUNT WILL OR IS LIKELY TO ACHIEVE PROFITS OR LOSSES SIMILAR TO THOSE SHOWN IN FACT, THERE ARE FREQUENTLY SHARP DIFFERENCES BETWEEN HYPOTHETICAL PERFORMANCE RESULTS AND THE ACTUAL RESULTS SUBSEQUENTLY ACHIEVED BY ANY PARTICULAR INVESTMENT ACCOUNT.
ONE OF THE LIMITATIONS OF HYPOTHETICAL PERFORMANCE RESULTS IS THAT THEY ARE GENERALLY PREPARED WITH THE BENEFIT OF HINDSIGHT IN ADDITION, HYPOTHETICAL TRADING DOES NOT INVOLVE FINANCIAL RISK, AND NO HYPOTHETICAL TRADING RECORD CAN COMPLETELY ACCOUNT FOR THE IMPACT OF FINANCIAL RISK IN ACTUAL TRADING FOR EXAMPLE, THE ABILITY TO WITHSTAND LOSSES OR TO ADHERE TO A PARTICULAR TRADING PROGRAM OR OTHER ASSET.
There are numerous other factors related to the markets in general or to the implementation of any specific trading program which cannot be fully accounted for in the preparation of hypothetical performance results and all of which can adversely affect actual trading results. No representation is being made that any investment will or is likely to achieve profits or losses similar to those being shown.
Most Comprehensive Guide to the Best Investment Books of All Time

Most Comprehensive Guide to the Best Investment Books of All Time
Get the most comprehensive guide to over 600 of the BEST investment books, with insights, and learn from some of the wisest and most accomplished investors in the world. A collection of MUST READ books carefully selected for you. Get it now absolutely FREE!
Get Your FREE Guide HERE!