


Trend Following - Week in Review - October 17, 2025
“A Counter-Trend Surge Amid Fragile Balance”
This Week in Trend – 17 October 2025
Welcome to This Week in Trend, your lens into the shifting dynamics of global futures markets and the evolving landscape of systematic trend following.
Due to commitments, this edition was prepared earlier than usual. It reflects conditions as of the end of the Asian futures sessions on Friday 17 October 2025. The final day of European and US sessions may alter the picture, but if the week so far is any guide, it has been a strong reversal from last week’s misfortunes.
After the turmoil of early October, markets found a degree of balance this week. The rebound across metals, bonds, and volatility instruments provided stability after a month defined by rapid swings and liquidation pressure. The tone was one of counter-trend recovery, not renewed momentum.
SG Trend Index Performance
- Month-to-date (as of Oct 17): +2.81%
- Year-to-date: +0.49%
(Previous week: +2.53% MTD | +0.21% YTD)
The SG Trend Index recovered modestly from last week’s losses as fixed income and metals strengthened. The rise in volatility added a defensive edge that helped offset energy and crypto weakness. The move hints at rebalancing rather than trend inflection, with systems stabilising after prior shocks.
TTU Trend Barometer
- Current reading: 48 percent: Neutral
- Previous reading: 48 percent
- 10-day rate of change: Falling Weakly
Trend strength remains neutral. The TTU Trend Barometer at 48 percent signals a market still in transition, where short-term reversals continue to dominate. Despite improved breadth in metals and rates, conviction remains thin and follow-through limited.
"A neutral barometer after a storm doesn’t promise calm, only a pause in direction."
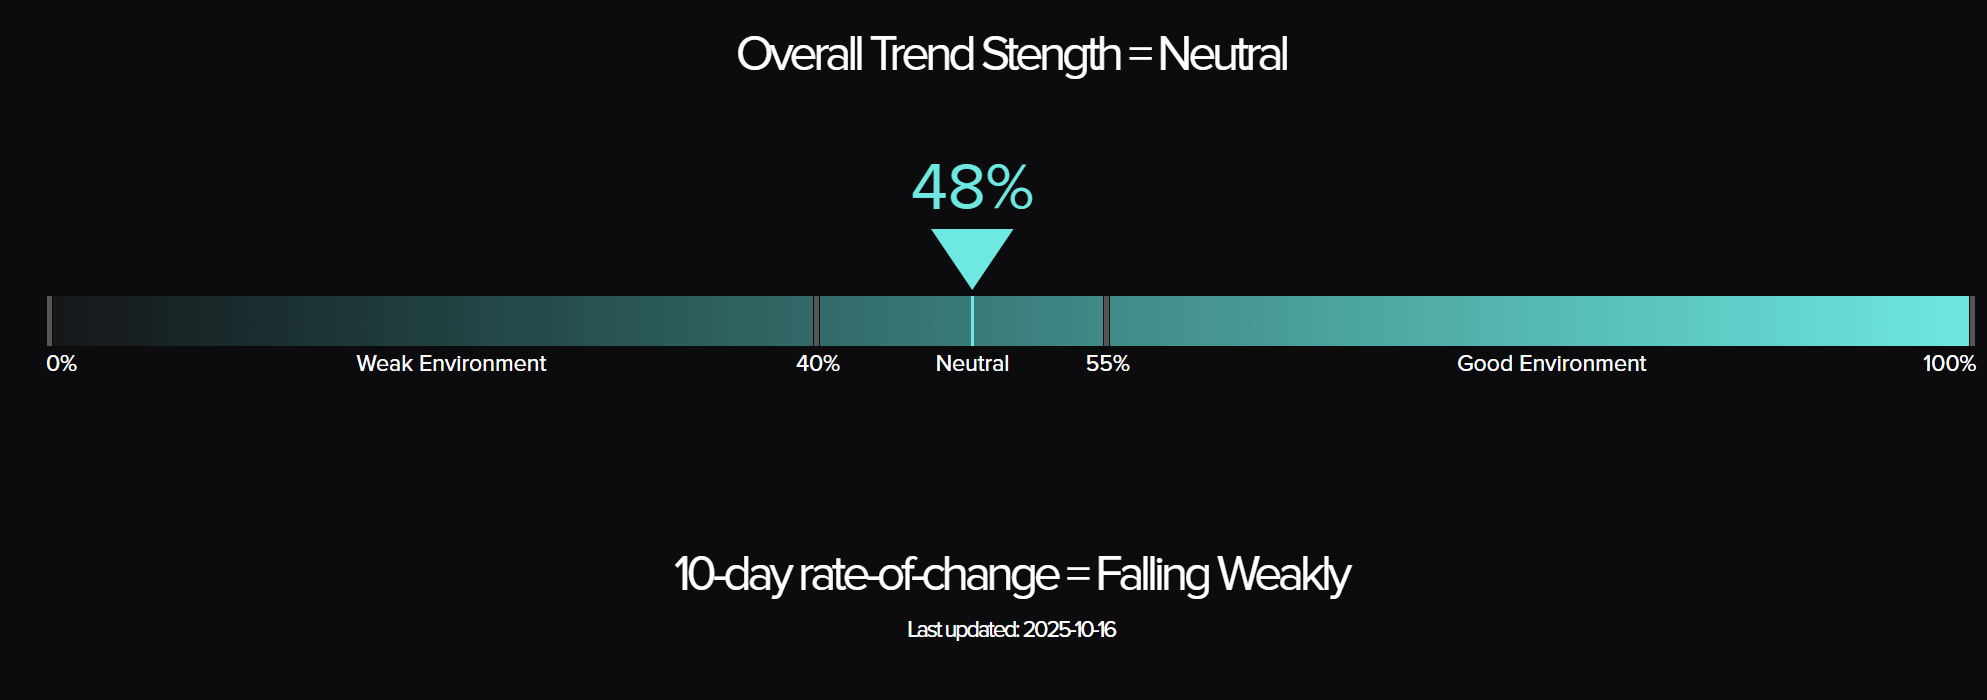
The Top Traders Unplugged (TTU) Trend Barometer is a proprietary tool that measures the percentage of markets with medium to strong trends. Similar to a thermometer, where 0 degrees Celsius equates to freezing, a TTU Trend Barometer reading below 40% indicates a “cold” environment for trend-following, while readings above 55% signal a “hotter,” more favourable trend environment.
Weekly Asset Class Snapshot
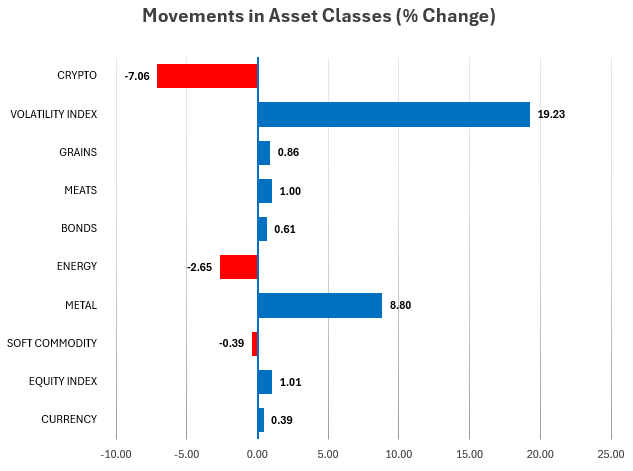
Source: Finwiz.com
- Volatility Index (+19.2% | prev +24.4%): Volatility eased from last week’s extremes but remains elevated. The rise this week signals ongoing defensive hedging and positioning caution.
- Metals (+8.8% | prev +1.7%): Strong rotation into safe-haven assets. Gold and silver surged as macro risks persisted and yields eased.
- Crypto (−7.1% | prev −7.4%): Another weak performance. Bitcoin gave back recent gains, underscoring fragile sentiment and speculative unwinding.
- Energy (−2.6% | prev −4.2%): Continued softness in crude and natural gas. Losses moderated as oil attempted to stabilise after multi-week declines.
- Softs (−0.4% | prev −4.7%): Selling pressure faded as orange juice and cocoa found footing. Position liquidation slowed notably.
- Equities (+1.0% | prev −2.7%): Rebound week. US and European indices regained some ground as panic selling faded. Still a fragile equilibrium.
- Grains (+0.9% | prev −1.4%): Mild recovery driven by short covering. The broader grain complex remains structurally soft.
- Meats (+1.0% | prev +1.9%): Steady upward trends persist in cattle. Livestock remains one of the few consistent positive sectors.
- Bonds (+0.6% | prev +0.5%): Duration continued to deliver. Lower yields provided ballast to trend portfolios.
- Currencies (+0.4% | prev −1.0%): USD eased slightly after last week’s strength, supporting commodities and metals.
Volatility remains the heartbeat of this market phase, but dispersion continues to define opportunity. Here’s how the leaders and laggards stacked up.
Performance Highlights – This Week’s Market Leaders & Laggards
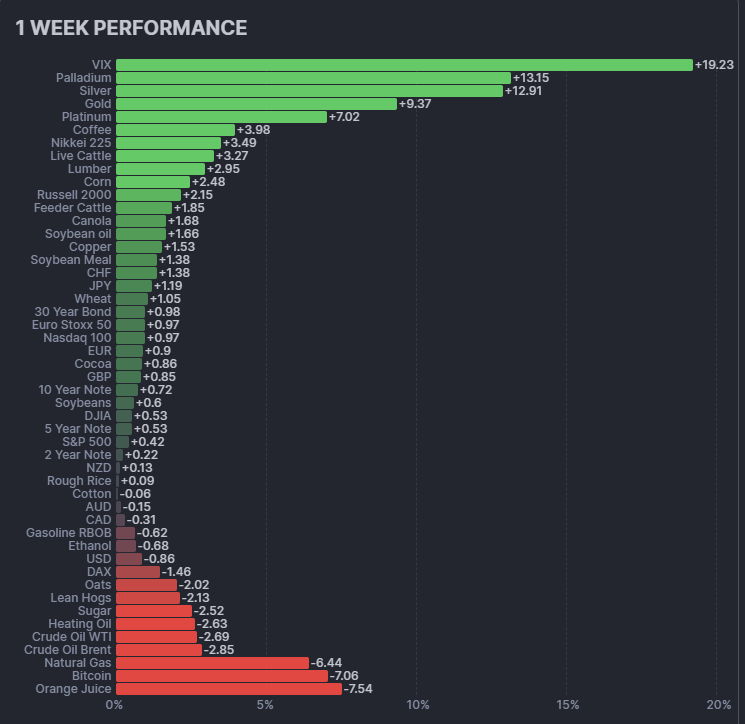
Top Market Movers
Top Gainers
Palladium +13.2%: Flight to scarcity
Supply concerns and defensive flows propelled palladium sharply higher, extending its rally and underscoring its hybrid role between precious and industrial metal.
Silver +12.9%: The twin refuge shines
Silver benefited from safe-haven rotation and the inflation hedge narrative. A breakout week across the metals complex supported broader momentum.
Gold +9.4%: The classic hedge reasserts dominance
Lower yields and persistent geopolitical risk reignited interest in gold. Trend systems remain long and added to positions as structure strengthened.
Top Losers
Orange Juice −7.5%: Mean reversion continues
Following months of overextension, softs corrected further. The pace of liquidation slowed, but the direction remains downward.
Bitcoin −7.1%: Weak hands exit
Crypto volatility remains high. Bitcoin retraced part of its September advance, aligning more closely with risk assets once again.
Natural Gas −6.4%: Seasonal weight
Rising inventories and mild weather forecasts pressured prices. Systems remain short but with reduced exposure after consecutive declines.
Portfolio View - Positioning and Impact
Equities
Global indices stabilised after last week’s reversal. US and European benchmarks regained balance but remain range-bound. Trend models held small long exposure with tightened stops.
Metals
Metals delivered the week’s strongest gains. Gold, silver, and palladium surged on renewed defensive demand. This sleeve added meaningful convexity to portfolios and cushioned risk-asset softness.
Energy
Crude and refined products drifted lower again, though the pace of decline eased. Natural gas weakness deepened, reflecting the seasonal pattern. Systems maintained light short bias.
Crypto
Crypto retraced further as volatility increased. Trend participation remains minimal as signals reset following recent turbulence.
Softs & Meats
Softs stabilised after multi-week declines, with cocoa and coffee showing early signs of consolidation. Cattle remained firm, continuing to contribute steady gains to diversified trend portfolios.
Rates & FX
Bond markets extended gains as yields eased, maintaining their role as portfolio stabilisers. The USD softened, aiding metals and commodities. Duration exposure remained beneficial.
Final Reflections – A Counter-Trend Surge Amid Fragile Balance
This week marked the first real rebound since the renewed (mini) tariff shock earlier in October. Price action across metals, bonds, and equities reflected an unwinding of panic rather than the start of a new trend regime.
Convexity delivered where it mattered most. Metals and bonds demonstrated their defensive role, absorbing the volatility that energy and crypto released. Yet, the broader environment remains broadly neutral, and trend strength is limited, although leaning in the right direction.
Three lessons stand out:
Convexity remains king. In an uncertain market, the asymmetry of returns comes from protection, not prediction.
Correlation remains conditional. Rebounds often mask hidden fragility. Asset classes still move in clusters when pressure builds.
Process remains paramount. Early signals of recovery are not confirmation of stability. Rule-based adaptability continues to define survivability.
The TTU Barometer holds near neutral and the SG Trend Index is modestly positive. As the month progresses, traders will watch whether metals maintain leadership or if volatility reasserts control. For now, the takeaway is clear: markets are balancing, not trending strongly, and the pause itself is part of the process.

List of Resources used in the Week in Review
Important Disclaimers
This document is directly solely to Accredited Investors, Qualified Eligible Participants, Qualified Clients and Qualified Purchasers. No investment decision should be made until prospective investors have read the detailed information in the fund offering documents of any manager mentioned in this document. This document is furnished on a confidential basis only for the use of the recipient and only for discussion purposes and is subject to amendment This document is neither advice nor a recommendation to enter into any transaction. This document is not an offer to buy or sell, nor a solicitation of an offer to buy or sell, any security or other financial instrument. This presentation is based on information obtained from sources that TopTradersUnplugged (“TTU”) (“considers to be reliable however, TTU makes no representation as to, and accepts no responsibility or liability for, the accuracy or completeness of the information. TTU has not independently verified third party manager or benchmark information, does not represent it as accurate, true or complete, makes no warranty, express or implied regarding it and shall not be liable for any losses, damages, costs or expenses relating to its adequacy, accuracy, truth, completeness or use.
All projections, valuations, and statistical analyses are provided to assist the recipient in the evaluation of the matters described herein. Such projections, valuations and analyses may be based on subjective assessments and assumptions and may use one among many alternative methodologies that produce different results accordingly, such projections, valuations and statistical analyses should not be viewed as facts and should not be relied upon as an accurate prediction of future events. There is no guarantee that any targeted performance will be achieved Commodity trading involves substantial risk of loss and may not be suitable for everyone
TTU is not and does not purport to be an advisor as to legal, taxation, accounting, financial or regulatory matters in any jurisdiction. The recipient should independently evaluate and judge the matters referred to herein. TTU does not provide advice or recommendations regarding an investor’s decision to allocate to funds or accounts managed by any manager (“or to maintain or sell investments in funds or accounts managed by any manager, and no fiduciary relationship under ERISA is created by the investor investing in funds or accounts managed by any manager, or through any communication between TTU and the investor
In reviewing this document, it should be understood that the past performance results of any asset class, or any investment or trading program set forth herein, are not necessarily indicative of any future results that may be achieved in connection with any transaction. Any persons subscribing for an investment must be able to bear the risks involved and must meet the suitability requirements relating to such investment. Some or all alternative investment programs discussed herein may not be suitable for certain investors This document is directed only to persons having professional experience in matters relating to investments. Any investment or investment activity to which this document relates is available only to such investment professionals. Persons who do not have professional experience in matters relating to investments should not rely upon this document.
This document and its contents are proprietary information of TTU and may not be reproduced or otherwise disseminated in whole or in part without TTU’s prior written consent.
This document contains simulated or hypothetical performance results that have certain inherent limitations AND SHOULD BE VIEWED FOR ILLUSTRATIVE PURPOSES. Unlike the results shown in an actual performance record, these results do not represent actual trading. HYPOTHETICAL PERFORMANCE RESULTS HAVE MANY INHERENT LIMITATIONS, SOME OF WHICH ARE DESCRIBED BELOW. NO REPRESENTATION IS BEING MADE THAT ANY ACCOUNT WILL OR IS LIKELY TO ACHIEVE PROFITS OR LOSSES SIMILAR TO THOSE SHOWN IN FACT, THERE ARE FREQUENTLY SHARP DIFFERENCES BETWEEN HYPOTHETICAL PERFORMANCE RESULTS AND THE ACTUAL RESULTS SUBSEQUENTLY ACHIEVED BY ANY PARTICULAR INVESTMENT ACCOUNT.
ONE OF THE LIMITATIONS OF HYPOTHETICAL PERFORMANCE RESULTS IS THAT THEY ARE GENERALLY PREPARED WITH THE BENEFIT OF HINDSIGHT IN ADDITION, HYPOTHETICAL TRADING DOES NOT INVOLVE FINANCIAL RISK, AND NO HYPOTHETICAL TRADING RECORD CAN COMPLETELY ACCOUNT FOR THE IMPACT OF FINANCIAL RISK IN ACTUAL TRADING FOR EXAMPLE, THE ABILITY TO WITHSTAND LOSSES OR TO ADHERE TO A PARTICULAR TRADING PROGRAM OR OTHER ASSET.
There are numerous other factors related to the markets in general or to the implementation of any specific trading program which cannot be fully accounted for in the preparation of hypothetical performance results and all of which can adversely affect actual trading results. No representation is being made that any investment will or is likely to achieve profits or losses similar to those being shown.
Most Comprehensive Guide to the Best Investment Books of All Time

Most Comprehensive Guide to the Best Investment Books of All Time
Get the most comprehensive guide to over 600 of the BEST investment books, with insights, and learn from some of the wisest and most accomplished investors in the world. A collection of MUST READ books carefully selected for you. Get it now absolutely FREE!
Get Your FREE Guide HERE!