


Trend Following - Week in Review - October 31, 2025

“From Fire to Fade”
This Week in Trend – 31 October 2025
Welcome to This Week in Trend, your lens into the shifting dynamics of global futures markets and the evolving landscape of systematic trend following.
This edition reflects conditions through the close of US markets on Friday 31 October 2025. The final week of October brought a clear cooling in trend strength. What began as a month of renewed momentum ended in breadth contraction, softer commodity signals, and fading alignment across asset classes.
Energy, which led the charge earlier in the month, lost its spark as follow-through stalled and leadership narrowed. Grains and select equities held firm, but weakness in metals, softs, and meats pulled the broader trend environment back toward neutral. The SG Trend Index slipped as the TTU Trend Barometer retreated sharply, confirming a market moving from ignition to exhaustion.
After several weeks of directional promise, systems faced rising dispersion and diminished conviction. The tone shifted from acceleration to consolidation, as volatility crept higher and correlation structures loosened across sectors.
SG Trend Index Performance
- Month-to-date (as of Oct 31): +1.91%
- Year-to-date: −0.39%
(Previous week: +2.04% MTD | −0.26% YTD)
The SG Trend Index edged lower as October closed, reflecting a loss of uniformity in performance. Gains in energy and grains were offset by declines in softs and metals, bringing an end to what had initially looked like a decisive recovery month. The index closed marginally positive for October, yet the late-month fade underscored how quickly momentum eroded once breadth contracted.
TTU Trend Barometer
- Current reading: 39 percent (as at Thursday 30th Oct 2025) – Moderately Weak
- Previous reading: 55 percent
- 10-day rate of change: Falling Rapidly
Trend strength deteriorated sharply this week. The TTU Trend Barometer dropped from a constructive 55 percent to 39 percent, confirming a transition into a colder environment. The pullback was driven by fading commodity and FX trends, even as select equity markets such as the Nikkei and Nasdaq held firm.
The 39 percent reading places the trend environment in the lower neutral zone, signalling that systems are finding fewer clean directional opportunities. Correlations are breaking down, participation is thinning, and volatility re-emergence is introducing noise back into portfolio returns.
“The fire that lit early October is now fading into embers.”
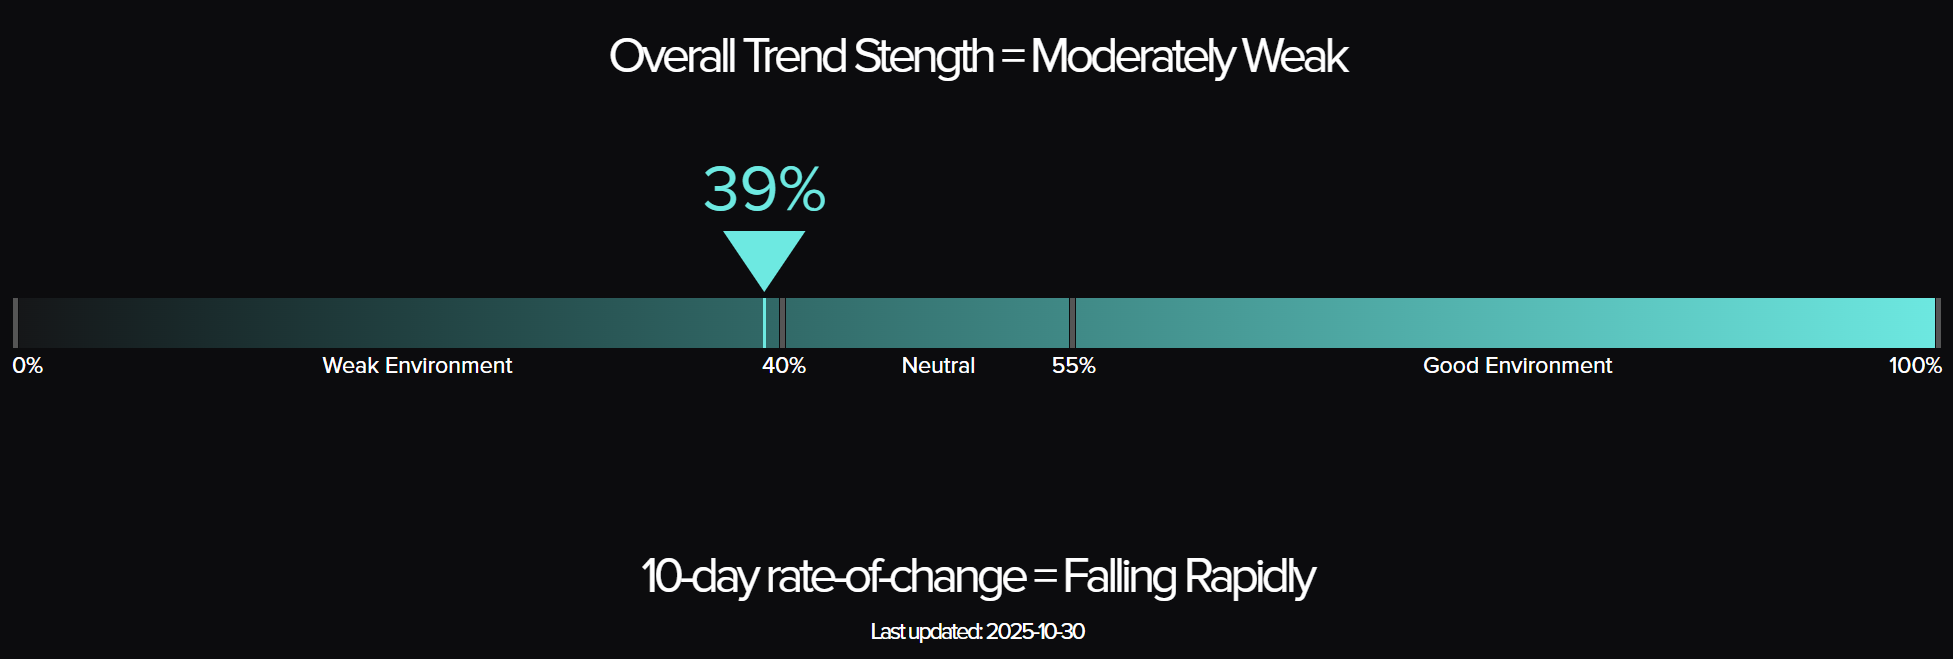
The Top Traders Unplugged (TTU) Trend Barometer is a proprietary tool that measures the percentage of markets with medium to strong trends. Similar to a thermometer, where 0 degrees Celsius equates to freezing, a TTU Trend Barometer reading below 40% indicates a “cold” environment for trend-following, while readings above 55% signal a “hotter,” more favourable trend environment.
Weekly Asset Class Snapshot
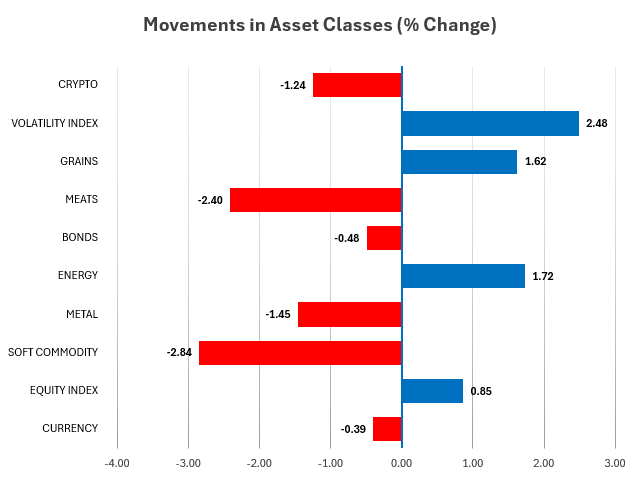
Source: Finwiz.com
- Volatility Index (+2.48% | prev −15.22%)
Volatility ticked higher after the sharp collapse a week earlier. The mild rebound in the VIX reflects renewed caution as commodity leadership faltered and equity momentum began to fragment. The tone was more hesitant than fearful, suggesting recalibration rather than panic. - Metals (−1.45% | prev −1.63%)
Metals remained under pressure for a second week. Gold and silver extended their declines while industrial metals lost traction amid a stronger US dollar and softer risk appetite. The sector has shifted decisively from contributor to laggard, weighing on trend models that had benefited from earlier strength in September and early October. - Crypto (−1.24% | prev +4.04%)
Digital assets slipped as risk appetite moderated. Bitcoin lost momentum after its recent recovery, trading within a narrower range. The decline was modest but reflects hesitation among systematic models to re-engage amid mixed signals and tightening liquidity. - Energy (+1.72% | prev +3.43%)
Energy’s rally cooled. Gains persisted but were less decisive as crude and refined products paused following two weeks of strong advances. WTI and Brent ended higher, though momentum flattened, while natural gas continued to slide. The sector remains a key source of portfolio structure but no longer the clear engine of outperformance. - Soft Commodities (−2.84% | prev −0.36%)
Softs deteriorated sharply. Orange juice, sugar, and coffee all fell, reversing last week’s stability. The group moved to the bottom of the performance table as supply normalization and weaker demand expectations weighed on prices. - Equity Index (+0.85% | prev +1.94%)
Equities extended gains but at a slower pace. The Nikkei and Nasdaq led modestly, while European indices stalled. The risk-on tone is intact yet fading, with narrowing participation across sectors. Trend systems remain long but with limited conviction. - Grains (+3.98% | prev +1.05%)
Grains were the standout performer. Soybean meal, soybeans, and wheat all surged, supported by weather-related concerns and export optimism. This shift in leadership from energy to grains marked one of the few areas where fresh directional momentum emerged. - Meats (−2.40% | prev −3.23%)
Losses persisted but moderated. Feeder and live cattle continued to retreat from recent highs, extending their correction phase. The sector remains a drag on trend portfolios, though the pace of decline is easing. - Bonds (+0.32% | prev −0.04%)
Fixed income stabilised, with modest strength across the curve. Yields edged lower as traders tempered expectations for further tightening. Duration exposure remains neutral overall but provided small diversification benefits amid mixed cross-asset moves. - Currencies (−0.46% | prev −0.29%)
FX markets stayed subdued. The US dollar regained minor strength, pressuring commodity-linked currencies. Trend alignment across the major pairs remains weak, with no dominant directional structure.
Volatility’s gentle rebound marked a change in tone from last week’s calm. Breadth narrowed further as leadership rotated away from energy into grains, while other sectors lost coherence. The overall landscape shifted from a hot, selective environment to a cooler, more fragmented one where systems are again working to find stable footing.
Performance Highlights – This Week’s Market Leaders & Laggards

Top Market Movers
Top Gainers
- Soybean Meal +9.28%: Grains Take the Baton
Soybean Meal led markets decisively this week, powering a broad agricultural surge. The advance was driven by strong feed demand, tight supply conditions, and renewed speculative interest. The move marks a clear handover of leadership from energy to grains. - Ethanol +6.55%: Biofuel Rebound Fuels Agriculture
Ethanol rallied in step with the broader grain complex, supported by rising processing margins and improved export flows. The gain highlights the re-emergence of biofuels as a structural component of the commodity upturn. - Nikkei 225 +5.48%: Asian Equities Extend Breakout
Japanese equities continued their impressive ascent, buoyed by a weaker yen and strong corporate earnings. The Nikkei’s resilience provided one of the few consistent bright spots for trend portfolios in an otherwise mixed environment.
Top Losers
- Orange Juice −8.43%: The Squeeze Breaks
After an extraordinary multi-month run, Orange Juice suffered a sharp correction. Improved crop conditions and a reduction in speculative long positioning triggered an abrupt unwind, erasing much of October’s earlier gains. - Lumber −6.42%: Demand Softens
Lumber fell for a second consecutive week as housing demand cooled and inventories rose. The sustained weakness underscores a broader loss of momentum across domestic demand-sensitive commodities. - Oats −6.23%: Grain Rotation Takes a Toll
While soybean meal and wheat surged, Oats lagged as traders rotated within the grain complex. The divergence highlights the selective nature of the current rally, where only a subset of agricultural markets is driving overall performance.
Portfolio View - Positioning and Impact
Equities
Equity markets extended their gains into a third week, but momentum began to cool. The Nikkei and Nasdaq continued to lead, while European indices such as the DAX and Euro Stoxx 50 softened. The advance was narrower in scope, with fewer sectors participating. Trend models remain modestly long across developed markets, but allocation is being trimmed as breadth declines and the volatility floor begins to rise.
Metals
Metals weakened for a second consecutive week. Gold, Silver, and Platinum all declined as real yields edged higher and safe-haven demand waned. Copper was little changed but failed to reassert leadership. The metals sleeve, once a stabilizer, became a mild detractor. Systems maintained small, long exposure but reduced leverage amid fading trend strength.
Energy
Energy’s leadership faded but did not disappear. Crude oil and refined products held slightly higher, yet the rally that dominated mid-October lost intensity. WTI and Brent remained range-bound, while Natural Gas rebounded modestly from oversold levels. Trend systems remain long but have begun to pare back exposure as price structure stabilizes and directional conviction wanes.
Crypto
Crypto markets turned softer. Bitcoin declined slightly, reversing last week’s advance as risk appetite moderated and cross-asset volatility increased. Systems maintained minimal exposure, awaiting clearer directional structure before re-engagement.
Softs & Meats
Soft commodities saw sharp reversals. Orange Juice, Sugar, and Coffee all declined, with Orange Juice leading the losses after its extended bull run broke down. Meats continued their retreat, though the pace slowed. Trend followers have reduced long exposure across both groups, transitioning from active participation to capital preservation as trends unwind.
Rates & FX
Bonds stabilized with modest gains as yields edged lower. Duration exposure provided mild offset to weakness elsewhere but remains a low-conviction sleeve. In FX, the US dollar regained slight strength against major pairs, keeping directional signals muted. Systems continue to maintain balanced, low-beta positioning in currencies pending the emergence of clearer macro structure.
Final Reflections – From Fire to Fade
This week marked a turning point as the surge that defined mid-October lost intensity. Energy, once the spark that reignited trend conviction, cooled into consolidation, while grains briefly took the lead. The broader trend environment softened as dispersion widened and alignment across systems broke down.
The SG Trend Index eased to +1.91% MTD, reflecting how early-month strength gave way to neutral performance. Gains in grains and equities were offset by reversals in softs and metals. The TTU Trend Barometer fell sharply to 39%, confirming that the strong directional structure seen two weeks ago has faded into a weaker, more uneven landscape.
Three takeaways stand out:
- Trends fade faster than they form. The strong ignition in Energy earlier in the month quickly lost momentum, reminding trend followers that persistence, not prediction, determines survival.
- Breadth drives resilience. When leadership narrows, portfolios become vulnerable to rotation shocks. The recent contraction in participation shows how fragile recovery phases can be.
- Cooling volatility hides fatigue, not strength. The modest rise in the VIX signals a market regaining variability but not yet rediscovering conviction.
The takeaway for now: October closes with fading energy, shifting leadership, and reduced portfolio coherence. The strong start cooled into consolidation. Until participation broadens again, the trend environment will remain cautious and fragmented.

List of Resources used in the Week in Review
Important Disclaimers
This document is directly solely to Accredited Investors, Qualified Eligible Participants, Qualified Clients and Qualified Purchasers. No investment decision should be made until prospective investors have read the detailed information in the fund offering documents of any manager mentioned in this document. This document is furnished on a confidential basis only for the use of the recipient and only for discussion purposes and is subject to amendment This document is neither advice nor a recommendation to enter into any transaction. This document is not an offer to buy or sell, nor a solicitation of an offer to buy or sell, any security or other financial instrument. This presentation is based on information obtained from sources that TopTradersUnplugged (“TTU”) (“considers to be reliable however, TTU makes no representation as to, and accepts no responsibility or liability for, the accuracy or completeness of the information. TTU has not independently verified third party manager or benchmark information, does not represent it as accurate, true or complete, makes no warranty, express or implied regarding it and shall not be liable for any losses, damages, costs or expenses relating to its adequacy, accuracy, truth, completeness or use.
All projections, valuations, and statistical analyses are provided to assist the recipient in the evaluation of the matters described herein. Such projections, valuations and analyses may be based on subjective assessments and assumptions and may use one among many alternative methodologies that produce different results accordingly, such projections, valuations and statistical analyses should not be viewed as facts and should not be relied upon as an accurate prediction of future events. There is no guarantee that any targeted performance will be achieved Commodity trading involves substantial risk of loss and may not be suitable for everyone
TTU is not and does not purport to be an advisor as to legal, taxation, accounting, financial or regulatory matters in any jurisdiction. The recipient should independently evaluate and judge the matters referred to herein. TTU does not provide advice or recommendations regarding an investor’s decision to allocate to funds or accounts managed by any manager (“or to maintain or sell investments in funds or accounts managed by any manager, and no fiduciary relationship under ERISA is created by the investor investing in funds or accounts managed by any manager, or through any communication between TTU and the investor
In reviewing this document, it should be understood that the past performance results of any asset class, or any investment or trading program set forth herein, are not necessarily indicative of any future results that may be achieved in connection with any transaction. Any persons subscribing for an investment must be able to bear the risks involved and must meet the suitability requirements relating to such investment. Some or all alternative investment programs discussed herein may not be suitable for certain investors This document is directed only to persons having professional experience in matters relating to investments. Any investment or investment activity to which this document relates is available only to such investment professionals. Persons who do not have professional experience in matters relating to investments should not rely upon this document.
This document and its contents are proprietary information of TTU and may not be reproduced or otherwise disseminated in whole or in part without TTU’s prior written consent.
This document contains simulated or hypothetical performance results that have certain inherent limitations AND SHOULD BE VIEWED FOR ILLUSTRATIVE PURPOSES. Unlike the results shown in an actual performance record, these results do not represent actual trading. HYPOTHETICAL PERFORMANCE RESULTS HAVE MANY INHERENT LIMITATIONS, SOME OF WHICH ARE DESCRIBED BELOW. NO REPRESENTATION IS BEING MADE THAT ANY ACCOUNT WILL OR IS LIKELY TO ACHIEVE PROFITS OR LOSSES SIMILAR TO THOSE SHOWN IN FACT, THERE ARE FREQUENTLY SHARP DIFFERENCES BETWEEN HYPOTHETICAL PERFORMANCE RESULTS AND THE ACTUAL RESULTS SUBSEQUENTLY ACHIEVED BY ANY PARTICULAR INVESTMENT ACCOUNT.
ONE OF THE LIMITATIONS OF HYPOTHETICAL PERFORMANCE RESULTS IS THAT THEY ARE GENERALLY PREPARED WITH THE BENEFIT OF HINDSIGHT IN ADDITION, HYPOTHETICAL TRADING DOES NOT INVOLVE FINANCIAL RISK, AND NO HYPOTHETICAL TRADING RECORD CAN COMPLETELY ACCOUNT FOR THE IMPACT OF FINANCIAL RISK IN ACTUAL TRADING FOR EXAMPLE, THE ABILITY TO WITHSTAND LOSSES OR TO ADHERE TO A PARTICULAR TRADING PROGRAM OR OTHER ASSET.
There are numerous other factors related to the markets in general or to the implementation of any specific trading program which cannot be fully accounted for in the preparation of hypothetical performance results and all of which can adversely affect actual trading results. No representation is being made that any investment will or is likely to achieve profits or losses similar to those being shown.
Most Comprehensive Guide to the Best Investment Books of All Time

Most Comprehensive Guide to the Best Investment Books of All Time
Get the most comprehensive guide to over 600 of the BEST investment books, with insights, and learn from some of the wisest and most accomplished investors in the world. A collection of MUST READ books carefully selected for you. Get it now absolutely FREE!
Get Your FREE Guide HERE!