


Trend Following - Week in Review - December 12, 2025

“Violence Without Follow-Through”
This Week in Trend – 12 December 2025
Welcome to This Week in Trend, your weekly view into the evolving structure of global futures markets and the behaviour of systematic trend following. This edition covers conditions through the close of US markets on Friday, 12 December 2025.
This week was characterised by powerful price moves that failed to develop into durable trend alignment. Several markets delivered sharp and decisive swings, yet the broader trend environment remained firmly neutral. Energy led the reversal. Natural gas, last week’s standout, collapsed violently and pulled the wider energy complex lower. At the same time, soft commodities and metals surged, producing striking gains without restoring broad participation. Equities softened modestly, bonds continued to drift, and volatility eased further.
Despite the intensity of individual moves, the underlying structure showed only marginal improvement. The TTU Trend Barometer ticked higher to 45 percent, keeping conditions squarely in neutral territory. The 10 day rate of change improved, but only weakly, reinforcing that trend breadth remains fragile rather than robust. Markets moved forcefully, but they did not move together.
The picture is one of violence without follow-through. Leadership rotated abruptly, reversals were swift, and price action dominated the narrative. Yet conviction failed to take hold. For trend followers, this remains an environment where discipline, patience and selectivity outweigh reaction, as structure continues to lag the speed and intensity of price.
SG Trend Index Performance
Month to date: +0.32 percent
Year to date: +0.79 percent
Last week:
• +0.34 percent MTD
• +0.81 percent YTD
This week the SG Trend Index edged slightly lower, trimming both its December and year to date gains. The change is small in magnitude, but meaningful in character. After last week’s tentative recovery, momentum stalled rather than extended.
Seven days ago the index was supported by stabilisation across several sectors, with energy strength, resilient metals and firm meats helping lift both the month and the year back into positive territory. This week that support fractured. The sharp reversal in natural gas and the broader energy complex became a meaningful drag, while gains in soft commodities and parts of the metals complex were not enough to offset the loss of leadership elsewhere.
The key difference again lies in breadth. Last week hinted at a broader base forming beneath prices. This week that base narrowed. Strength rotated aggressively rather than expanding, with only a handful of markets contributing positively while others stalled or reversed.
The SG Trend Index held close to positive territory, but it did so without reinforcement from a wider set of aligned trends. The result fits squarely with the week’s theme. Movement was forceful, but follow-through was limited. The surface shifted, yet the underlying trend structure failed to firm.
TTU Trend Barometer
Current reading: 45 percent
Previous reading: 41 percent
10 day rate of change: Rising weakly
The TTU Trend Barometer rose to 45 percent this week, marking a modest improvement from last week’s subdued reading. At face value, this suggests a slight broadening in trend participation. However, the quality of that improvement remains fragile, with gains driven by rotation rather than genuine alignment.
The lift reflects selective strength rather than systemic repair. Soft commodities and parts of the metals complex contributed positively, lifting the aggregate reading. At the same time, the violent reversal in natural gas and the broader energy complex removed a major pillar of prior trend strength. Equities, bonds and currencies remained mixed, offering little reinforcement to directional conviction.
The move from 41 percent to 45 percent highlights the central tension of the week. Some markets are re-entering trend phases, others are breaking sharply, and many remain locked in corrective or drifting regimes. The rising but weak rate of change confirms that this is not a decisive shift toward a stronger trend environment.
A reading in the mid forties still defines a neutral regime. Opportunities exist, but they are uneven and vulnerable to reversal. Structure is attempting to rebuild, yet conviction has not followed. This remains a market where movement is plentiful, but follow-through is scarce.
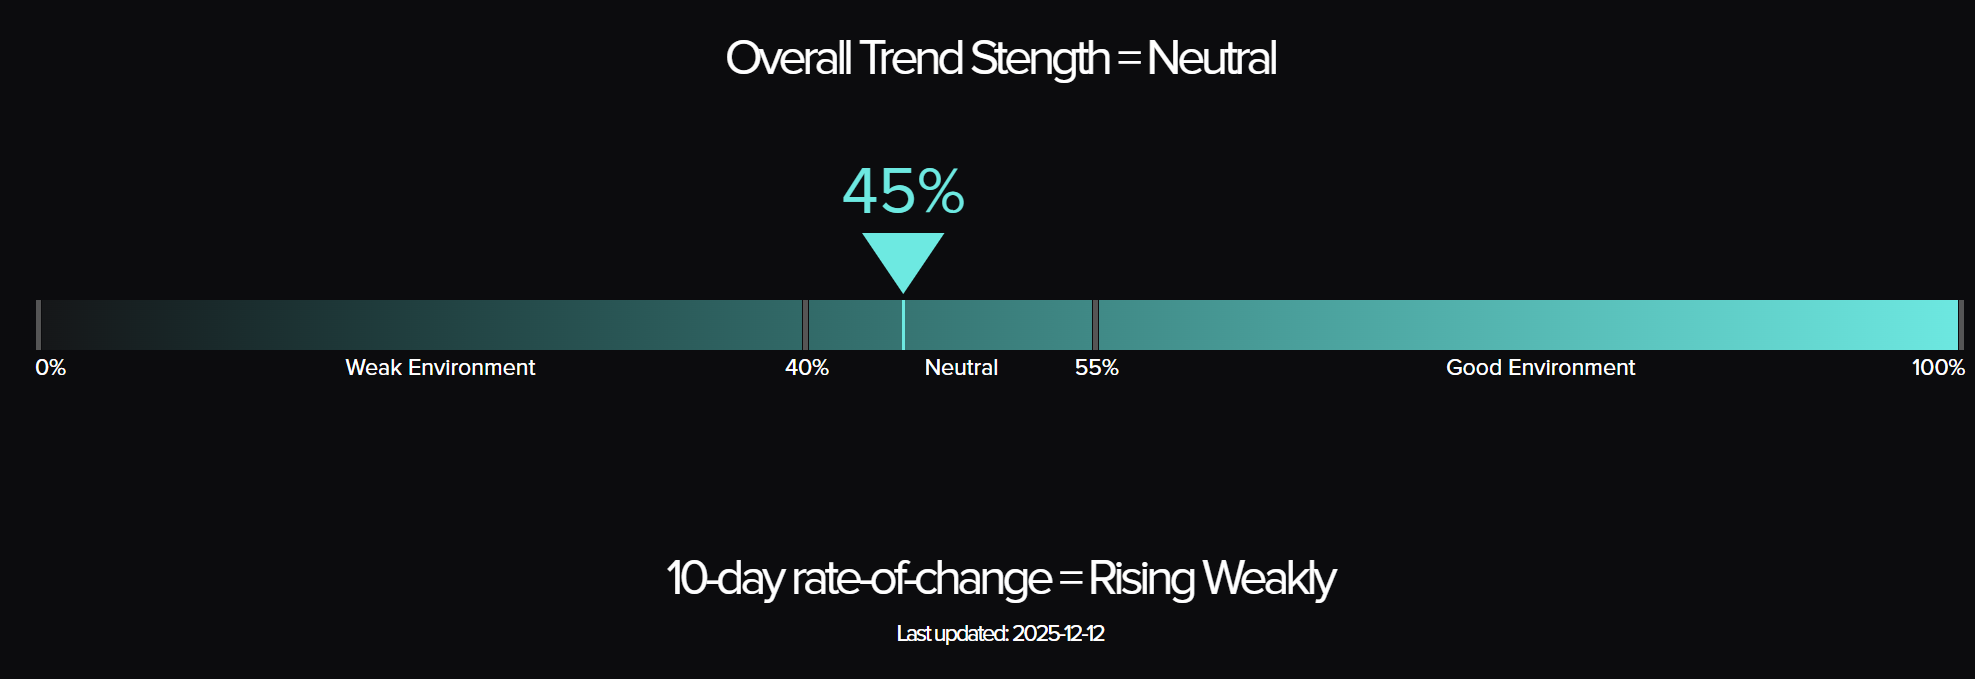
The Top Traders Unplugged (TTU) Trend Barometer is a proprietary tool that measures the percentage of markets with medium to strong trends. Similar to a thermometer, where 0 degrees Celsius equates to freezing, a TTU Trend Barometer reading below 40% indicates a “cold” environment for trend-following, while readings above 55% signal a “hotter,” more favourable trend environment.
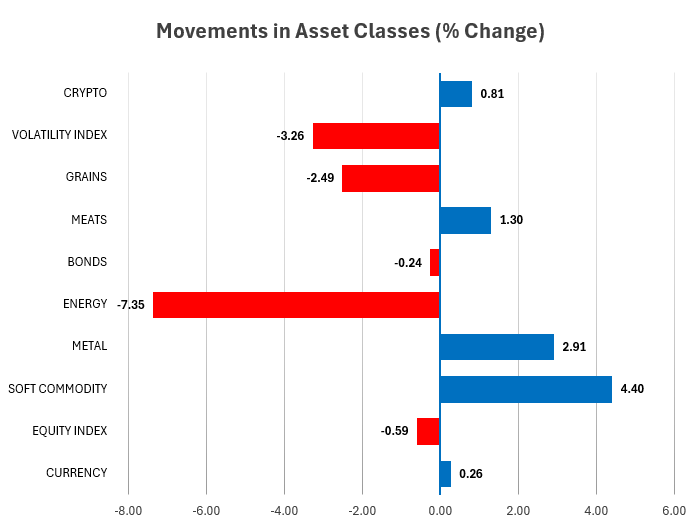
Weekly Asset Class Snapshot
Source: Finwiz.com
- Volatility Index (−3.26 percent | prev −5.30 percent)
Volatility continued to decline, though the pace slowed further. The persistent drift lower confirms that stress has eased, but the lack of any renewed spike also reflects a market absorbing sharp price moves without broad fear. Calm conditions remain, even as underlying leadership fractures. - Crypto (+0.81 percent | prev −1.80 percent)
Crypto stabilised modestly after last week’s pullback. Bitcoin edged higher, but the move lacked momentum and failed to repair structure. The complex remains range-bound and reactive, offering little in the way of sustained trend alignment. - Grains (−2.49 percent | prev −2.11 percent)
Grains weakened again, extending an already fragile structure. Corn, wheat and soy-related markets remained under pressure, reinforcing grains as one of the weakest trend clusters across the futures universe. - Meats (+1.30 percent | prev +3.50 percent)
Meats continued to contribute positively, though gains moderated compared with last week. Live cattle and feeder cattle remain structurally constructive, but momentum has softened as the complex transitions from strong impulse toward consolidation. - Bonds (−0.24 percent | prev −0.73 percent)
Bonds drifted slightly lower, remaining trapped in a broad, indecisive range. Directional conviction across the yield curve remains low, and trend signals continue to be sparse. - Energy (−7.35 percent | prev +3.01 percent)
Energy experienced a sharp reversal. Natural gas collapsed after last week’s explosive gains, dragging the entire complex lower. Crude and refined products also weakened. This was one of the most violent rotations of the week and a key contributor to the breakdown in trend continuity. - Metals (+2.91 percent | prev +0.72 percent)
Metals strengthened meaningfully, led by platinum and silver, with copper holding firm. The complex showed renewed upside energy, though the gains came amid broader market dislocation rather than coordinated trend expansion. - Soft Commodities (+4.40 percent | prev −1.40 percent)
Softs surged, driven by sharp rebounds in orange juice, cocoa and sugar. While price action was forceful, the moves largely reflect short covering and rotation rather than a clean shift into durable trend structures. - Equity Index (−0.59 percent | prev +0.74 percent)
Equities softened modestly after last week’s advance. Major indices pulled back slightly, signalling hesitation rather than outright trend failure. Uptrend structures remain intact, but momentum has clearly stalled. - Currency (+0.26 percent | prev +0.49 percent)
Currencies posted small gains, with mild strength in selective pairs. Overall alignment remains weak, and the complex continues to express balance rather than directional conviction.
Summary
This week marked a decisive rotation rather than continuation. Energy reversed violently, while soft commodities and metals surged. Grains continued to weaken, equities paused, bonds drifted and volatility declined further. Leadership changed abruptly, but trend breadth did not expand. The result is a market rich in movement yet poor in follow-through, reinforcing the need for selectivity as price action continues to outpace structural confirmation.
Performance Highlights – This Week’s Market Leaders & Laggards
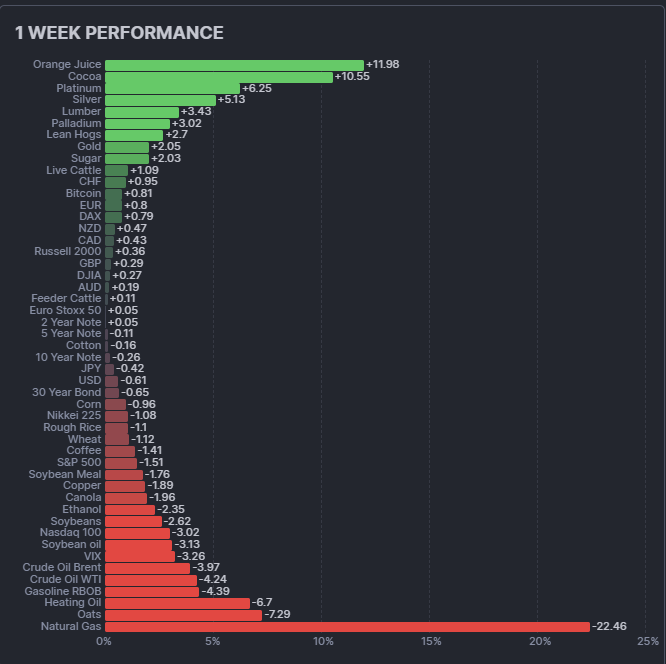
Top Market Movers
Top Gainers
- Orange Juice +11.98 percent – Violent Rebound After Prolonged Decline
Orange juice staged the strongest rally of the week, snapping back sharply after an extended period of heavy selling. The move was sudden and forceful, driven more by short covering and positioning stress than by a clean reversal in trend structure. - Cocoa +10.55 percent – Sharp Upside Rotation
Cocoa delivered a powerful upside move, reversing recent weakness with a decisive rally. While the price action was aggressive, the move appears rotational rather than a confirmed transition into a sustained trend phase. - Platinum +6.25 percent – Metals Reassert Leadership
Platinum surged as part of a broader strengthening across the metals complex. The move reinforced improving structure within precious metals, though gains occurred amid wider market dislocation rather than coordinated trend expansion. - Silver +5.13 percent – Renewed Momentum
Silver advanced strongly, extending its recent recovery. The rally added support to the metals cluster, though follow-through across other asset classes remained limited. - Lumber +3.43 percent – Cyclical Bounce
Lumber rebounded with a solid gain, reflecting renewed volatility in cyclical commodities. Structure improved modestly, but the move remains early and prone to retracement.
Top Losers
- Natural Gas −22.46 percent – Violent Trend Breakdown
Natural gas suffered a dramatic collapse, erasing a large portion of its prior gains in a single week. The move represents one of the most extreme reversals of the year and marks a clear breakdown in what had been one of the strongest trend leaders. This was the defining event of the week. - Oats −7.29 percent – Renewed Downside Pressure
Oats declined sharply, extending an already unstable structure. The move reinforced the lack of trend durability across much of the grains complex. - Heating Oil −6.70 percent – Energy Reversal Broadens
Heating oil fell hard alongside crude and refined products, confirming that weakness in energy was not isolated to natural gas alone. - Gasoline RBOB −4.39 percent – Momentum Breaks
Gasoline continued lower, adding to the broader energy unwind and contributing to the loss of trend continuity across the complex. - Crude Oil WTI −4.24 percent – Leadership Falters
WTI crude declined meaningfully, reinforcing the shift away from energy leadership and adding to losses for systems that remained long while accelerating gains for short-responsive models.
Summary
This week’s performance extremes highlight a market dominated by abrupt rotation and sharp reversals. Soft commodities and precious metals produced outsized gains, while energy experienced a severe breakdown led by natural gas. The distribution of winners and losers underscores the central theme of the week. Price moved aggressively, leadership changed suddenly, and reversals were swift. Yet these moves failed to translate into broad, durable trend alignment, leaving trend systems exposed to volatility without the benefit of follow-through.
Portfolio View - Positioning and Impact
Equities
Equities eased modestly after last week’s advance. Major indices such as the S&P 500, Nasdaq, DAX and Nikkei pulled back slightly, while Russell 2000 continued to lag. Primary uptrend structures remain intact, but momentum has stalled and recent price action reflects hesitation rather than continuation. Long exposure remained in place where trends persist, while short signals remained limited. Position sizing stayed restrained, consistent with an environment where trend strength has not expanded decisively.
Metals
Metals were a source of positive and relatively stable contribution. Platinum and silver led gains, with copper holding firm and gold remaining well supported. Trend structures across the metals complex continue to rank among the cleanest in the portfolio, supporting sustained long exposure. While momentum improved, the advance occurred in isolation rather than alongside broad market alignment, reinforcing metals as a selective leadership pocket rather than a signal of regime change.
Energy
Energy was the most volatile and rotational sector in the portfolio. Natural gas collapsed violently after last week’s explosive advance, producing one of the sharpest reversals of the year. For systems still carrying residual long exposure, exits were triggered quickly. At the same time, faster and short responsive models captured downside momentum as price broke sharply lower. Crude oil and refined products also weakened, confirming that the reversal extended across the complex.
The result was not a uniform drag, but elevated dispersion. Outcomes varied meaningfully across models depending on signal speed, directional bias and exit logic. Energy shifted from leadership to instability in a single week, generating turnover rather than persistent trend contribution.
Crypto
Crypto stabilised modestly after last week’s decline. Bitcoin edged higher but remained confined within a choppy, corrective structure. Trend signals remained weak and inconsistent, leaving most systems either flat or lightly positioned. Both long and short exposure remained limited, reflecting the lack of sustained directional conviction.
Soft Commodities and Meats
Soft commodities delivered sharp rebounds. Orange juice, cocoa and sugar delivered severe rebounds following extended declines. While the price moves were forceful, they largely reflected short covering and rapid repositioning rather than confirmed trend reversals. Short exposure was reduced quickly as price snapped higher, while longer term systems remained cautious due to limited structural confirmation.
Meats continued to provide relative stability. Live cattle and feeder cattle remain structurally constructive, though momentum softened compared with prior weeks. Exposure in this cluster remains well aligned and continues to act as a stabilising element within the portfolio.
Rates and FX
Bonds drifted lower and remain trapped in a broad, indecisive range. Trend opportunities across the curve remain scarce, and both long and short exposure stayed minimal.
Currencies posted small, mixed moves across major pairs. Directional alignment remains low, with most systems expressing FX exposure through balanced or low conviction positioning rather than sustained trends.
Summary
This week delivered sharp movement without durable alignment. Metals and selective soft commodities provided upside, while energy underwent violent reversal and rapid trend failure. Equities paused, crypto stabilised, bonds remained range bound and currencies continued to lack direction. For a long–short trend portfolio, the week was defined by dispersion, turnover and rapid signal transitions rather than persistent drawdown or smooth trend capture. Systems responded by exiting broken trends, engaging selectively on the short side, and maintaining discipline in an environment where price intensity continues to outpace structural follow-through.
Final Reflections – Violence Without Follow-Through
This week delivered a stark illustration of how quickly markets can move without building durable structure. Price action was forceful, reversals were sharp, and leadership shifted abruptly across asset classes. Yet beneath the surface, trend alignment failed to consolidate. Markets moved aggressively, but they did not move together. Intensity replaced continuity.
The defining event was the abrupt reversal in energy. Natural gas collapsed after last week’s explosive advance, triggering rapid exits and downside momentum across the complex. At the same time, soft commodities and metals surged, producing outsized gains that reflected rotation rather than coordinated trend expansion. Equities paused, bonds drifted, crypto stabilised modestly and volatility continued to ease. Movement was everywhere, but conviction was scarce.
The TTU Trend Barometer rose to 45 percent, nudging further into neutral territory. While this suggests some marginal repair in trend participation, the improvement remains fragile. The rising but weak rate of change confirms that trends are forming and breaking simultaneously rather than aligning across markets. The opportunity set remains fragmented.
Three observations define the week:
- Violence replaced persistence.
Large price moves dominated the tape, but few extended long enough to produce smooth trend capture. Reversals were swift and unforgiving. - Rotation overwhelmed leadership.
Energy broke down violently, while metals and soft commodities surged in its place. Leadership changed, but it did not stabilise. - Neutral conditions still rule.
Despite the scale of price action, the broader trend environment remains neutral. Structure lagged the intensity of movement.
This was not a quiet week. It was a volatile one. But volatility alone does not build trends. For systematic trend followers, the environment continues to reward discipline, adaptability and selectivity rather than commitment to any single narrative. Until follow-through replaces rotation, systems will continue to trade lightly, respond quickly and wait patiently for alignment to return.
Violence without follow-through creates opportunity only for processes designed to survive it.

List of Resources used in the Week in Review
Important Disclaimers
This document is directly solely to Accredited Investors, Qualified Eligible Participants, Qualified Clients and Qualified Purchasers. No investment decision should be made until prospective investors have read the detailed information in the fund offering documents of any manager mentioned in this document. This document is furnished on a confidential basis only for the use of the recipient and only for discussion purposes and is subject to amendment This document is neither advice nor a recommendation to enter into any transaction. This document is not an offer to buy or sell, nor a solicitation of an offer to buy or sell, any security or other financial instrument. This presentation is based on information obtained from sources that TopTradersUnplugged (“TTU”) (“considers to be reliable however, TTU makes no representation as to, and accepts no responsibility or liability for, the accuracy or completeness of the information. TTU has not independently verified third party manager or benchmark information, does not represent it as accurate, true or complete, makes no warranty, express or implied regarding it and shall not be liable for any losses, damages, costs or expenses relating to its adequacy, accuracy, truth, completeness or use.
All projections, valuations, and statistical analyses are provided to assist the recipient in the evaluation of the matters described herein. Such projections, valuations and analyses may be based on subjective assessments and assumptions and may use one among many alternative methodologies that produce different results accordingly, such projections, valuations and statistical analyses should not be viewed as facts and should not be relied upon as an accurate prediction of future events. There is no guarantee that any targeted performance will be achieved Commodity trading involves substantial risk of loss and may not be suitable for everyone
TTU is not and does not purport to be an advisor as to legal, taxation, accounting, financial or regulatory matters in any jurisdiction. The recipient should independently evaluate and judge the matters referred to herein. TTU does not provide advice or recommendations regarding an investor’s decision to allocate to funds or accounts managed by any manager (“or to maintain or sell investments in funds or accounts managed by any manager, and no fiduciary relationship under ERISA is created by the investor investing in funds or accounts managed by any manager, or through any communication between TTU and the investor
In reviewing this document, it should be understood that the past performance results of any asset class, or any investment or trading program set forth herein, are not necessarily indicative of any future results that may be achieved in connection with any transaction. Any persons subscribing for an investment must be able to bear the risks involved and must meet the suitability requirements relating to such investment. Some or all alternative investment programs discussed herein may not be suitable for certain investors This document is directed only to persons having professional experience in matters relating to investments. Any investment or investment activity to which this document relates is available only to such investment professionals. Persons who do not have professional experience in matters relating to investments should not rely upon this document.
This document and its contents are proprietary information of TTU and may not be reproduced or otherwise disseminated in whole or in part without TTU’s prior written consent.
This document contains simulated or hypothetical performance results that have certain inherent limitations AND SHOULD BE VIEWED FOR ILLUSTRATIVE PURPOSES. Unlike the results shown in an actual performance record, these results do not represent actual trading. HYPOTHETICAL PERFORMANCE RESULTS HAVE MANY INHERENT LIMITATIONS, SOME OF WHICH ARE DESCRIBED BELOW. NO REPRESENTATION IS BEING MADE THAT ANY ACCOUNT WILL OR IS LIKELY TO ACHIEVE PROFITS OR LOSSES SIMILAR TO THOSE SHOWN IN FACT, THERE ARE FREQUENTLY SHARP DIFFERENCES BETWEEN HYPOTHETICAL PERFORMANCE RESULTS AND THE ACTUAL RESULTS SUBSEQUENTLY ACHIEVED BY ANY PARTICULAR INVESTMENT ACCOUNT.
ONE OF THE LIMITATIONS OF HYPOTHETICAL PERFORMANCE RESULTS IS THAT THEY ARE GENERALLY PREPARED WITH THE BENEFIT OF HINDSIGHT IN ADDITION, HYPOTHETICAL TRADING DOES NOT INVOLVE FINANCIAL RISK, AND NO HYPOTHETICAL TRADING RECORD CAN COMPLETELY ACCOUNT FOR THE IMPACT OF FINANCIAL RISK IN ACTUAL TRADING FOR EXAMPLE, THE ABILITY TO WITHSTAND LOSSES OR TO ADHERE TO A PARTICULAR TRADING PROGRAM OR OTHER ASSET.
There are numerous other factors related to the markets in general or to the implementation of any specific trading program which cannot be fully accounted for in the preparation of hypothetical performance results and all of which can adversely affect actual trading results. No representation is being made that any investment will or is likely to achieve profits or losses similar to those being shown.
Most Comprehensive Guide to the Best Investment Books of All Time

Most Comprehensive Guide to the Best Investment Books of All Time
Get the most comprehensive guide to over 600 of the BEST investment books, with insights, and learn from some of the wisest and most accomplished investors in the world. A collection of MUST READ books carefully selected for you. Get it now absolutely FREE!
Get Your FREE Guide HERE!