


Trend Following - Week in Review - December 19, 2025

“Thawing Breadth, Fragile Conviction”
This Week in Trend – 19 December 2025
Welcome to This Week in Trend, your weekly view into the evolving structure of global futures markets and the behaviour of systematic trend following. This edition covers conditions through the close of US markets on Friday, 19 December 2025.
This week marked a clear shift in tone from last week’s violent rotation toward something more constructive. While conviction remains uneven, trend breadth improved modestly, and price action began to show signs of persistence rather than pure shock and reversal.
Metals emerged as the dominant leadership cluster, volatility compressed sharply, and several equity and rate markets held their structure rather than breaking down. Energy remained fragile, grains continued to struggle, and crypto retreated, but the overall picture was no longer one of disorder. Markets began to move with greater internal consistency across asset classes.
The improvement was not dramatic, but it was meaningful. For the first time in several weeks, structure started to catch up with price.
SG Trend Index Performance
Month to date: +0.53 percent
Year to date: +1.00 percent
Last week:
• +0.32 percent MTD
• +0.79 percent YTD
The SG Trend Index extended its recovery this week, adding to both December and year-to-date gains. Unlike last week, where returns were achieved amid abrupt reversals and narrow participation, this advance was supported by cleaner leadership and reduced interruption.
Metals were the primary contributor, delivering strong and persistent trends across multiple contracts. At the same time, falling volatility reduced drag from whipsaw environments, allowing existing positions to compound rather than churn.
The index did not surge, but the character of returns improved. This was less about speed and more about continuity. Gains were earned through persistence rather than rescue rallies.
TTU Trend Barometer
Current reading: 48 percent
Previous reading: 45 percent
10 day rate of change: Rising weakly
The TTU Trend Barometer rose to 48 percent, remaining within a neutral regime while continuing its gradual recovery from recent lows. This represents the strongest breadth reading in recent weeks and suggests that more markets are beginning to stabilise into emerging trend structures, though confirmation remains incomplete.
The improvement reflects broad participation rather than a single dominant theme. Metals, select equity indices, parts of the rates complex and some soft commodities all contributed positively. Importantly, this lift occurred without a volatility spike, suggesting trend formation rather than stress-driven displacement.
While 48 percent remains firmly within neutral territory, the direction of travel matters. The rising but weak rate of change suggests that trend conditions are attempting to improve rather than deteriorate.
This is an environment where opportunity is expanding, but discipline remains essential. Early regime transitions are still vulnerable to rotation.
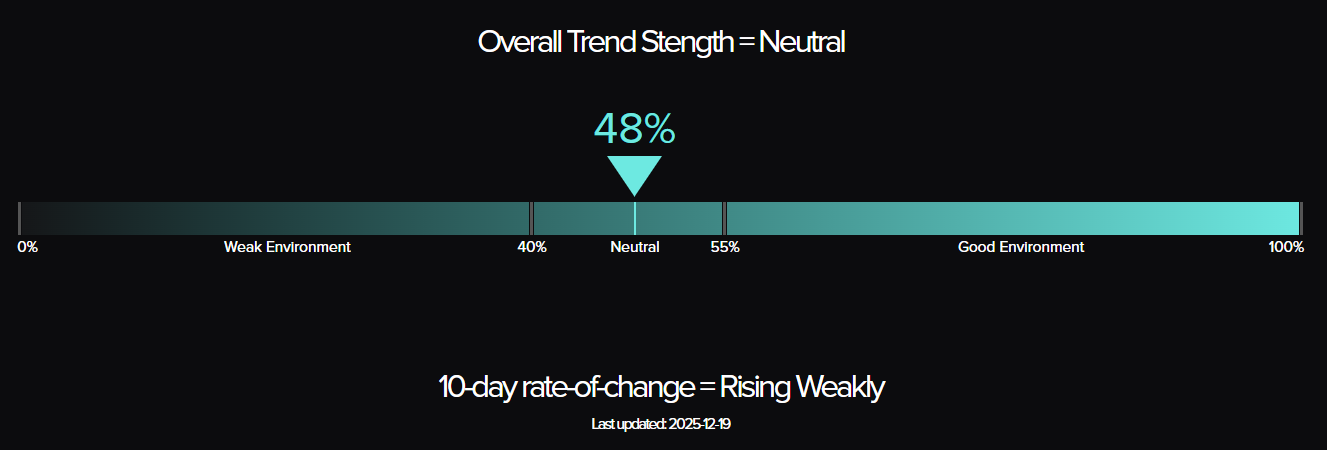
The Top Traders Unplugged (TTU) Trend Barometer is a proprietary tool that measures the percentage of markets with medium to strong trends. Similar to a thermometer, where 0 degrees Celsius equates to freezing, a TTU Trend Barometer reading below 40% indicates a “cold” environment for trend-following, while readings above 55% signal a “hotter,” more favourable trend environment.
Weekly Asset Class Snapshot
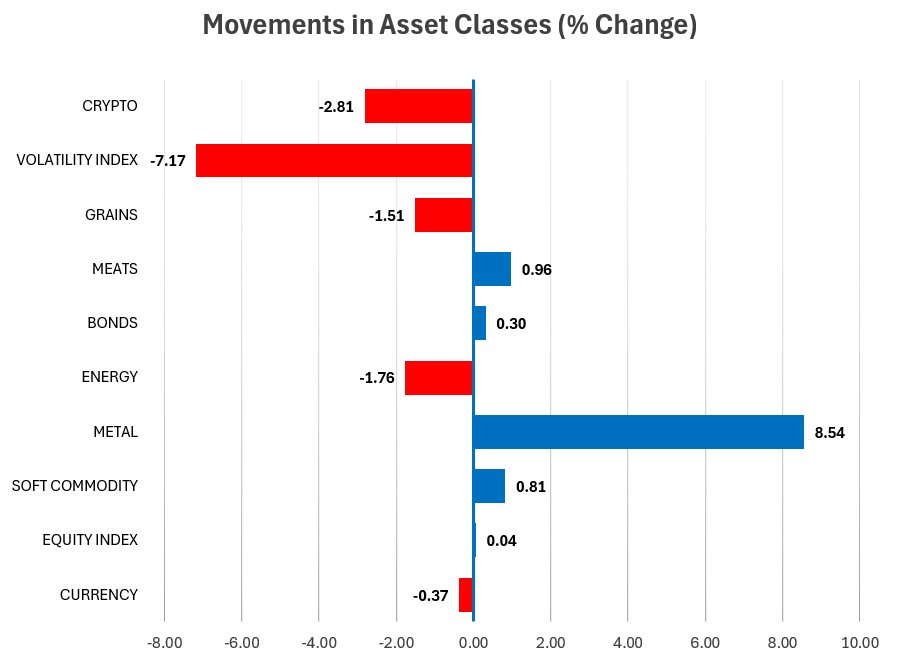
Source: Finwiz.com
- Volatility Index (−7.17 percent | prev −3.26 percent)
Volatility fell sharply, reinforcing the shift away from stress and shock. This compression supports trend persistence, particularly for slower systems that struggled during recent whipsaw conditions. - Crypto (−2.81 percent | prev +0.81 percent)
Crypto rolled over again. Bitcoin failed to hold prior gains and remains trapped in a choppy, corrective structure. Trend signals weakened further. - Grains (−1.51 percent | prev −2.49 percent)
Grains remained under pressure. Structure across soy, wheat and related markets continues to degrade, offering little in the way of sustained directional opportunity. - Meats (+0.96 percent | prev +1.30 percent)
Meats continued to behave constructively. Live cattle and feeder cattle remain structurally sound, though momentum has moderated. This cluster continues to act as a stabilising sleeve. - Bonds (+0.30 percent | prev −0.24 percent)
Rates posted modest gains and held structure. While trends remain slow and range bound, downside pressure eased and persistence improved slightly. - Energy (−1.76 percent | prev −7.35 percent)
Energy remained fragile. While the pace of decline slowed, crude and refined products failed to reassert leadership. Natural gas stabilised but remains volatile and structurally vulnerable. - Metals (+8.54 percent | prev +2.91 percent)
Metals dominated the week. Silver, platinum and palladium all extended strong upside trends, with copper holding firm and gold remaining well supported. This was the cleanest and most coordinated leadership across the futures universe. - Soft Commodities (+0.81 percent | prev +4.40 percent)
Softs were mixed. Orange juice extended higher again, while coffee and cocoa sold off sharply. The cluster remains rotational, though selective trends persist. - Equity Index (+0.04 percent | prev −0.59 percent)
Equities stabilised. Major indices held their uptrend structures despite limited weekly progress. The absence of breakdown is notable given recent volatility. - Currency (−0.37 percent | prev +0.26 percent)
Currencies drifted lower and remain largely directionless. FX continues to express balance rather than conviction.
Performance Highlights – This Week’s Market Leaders & Laggards
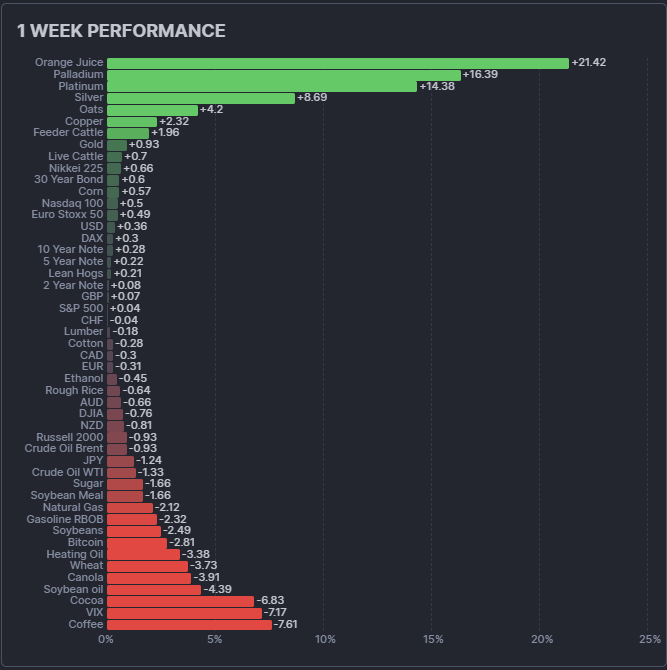
Top Market Movers
Top Gainers
- Orange Juice +21.42 percent
Orange juice extended its rebound, confirming that last week’s surge was not purely a one-day squeeze. Trend strength remains extreme, though volatility is elevated. - Palladium +16.39 percent
Palladium continued its powerful advance, reinforcing metals leadership. Structure is now firmly trend-aligned. - Platinum +14.38 percent
Platinum extended its breakout, maintaining one of the cleanest trends across all asset classes. - Silver +8.69 percent
Silver accelerated higher, adding momentum to an already well-defined uptrend.
Top Losers
- Coffee −7.61 percent
Coffee broke sharply lower, reversing prior stabilisation and reinforcing its volatile, mean-reverting character. - VIX −7.17 percent
Volatility continued to compress, supporting trend persistence elsewhere. - Cocoa −6.83 percent
Cocoa resumed its decline after last week’s rebound, confirming ongoing instability. - Soybean Oil −4.39 percent
Soybean oil weakened further, adding to the broader grain complex deterioration.
Portfolio View - Positioning and Impact
Equities
Equity exposure remained largely intact. While weekly gains were small, uptrend structures across major indices were preserved. This favours patience over rotation.
Metals
Metals were the primary positive contributor. Multiple contracts delivered sustained upside with minimal interruption. This cluster now represents the clearest expression of trend alignment in the portfolio.
Energy
Energy remained a source of uncertainty rather than opportunity. Trend exposure was reduced or rotated as leadership failed to re-establish itself. Dispersion across models remained elevated.
Soft Commodities and Meats
Soft commodities were mixed and rotational. Orange juice remained exceptional, while coffee and cocoa punished late positioning. Meats continued to provide steady, low-drama contribution.
Rates and FX
Rates stabilised modestly, improving persistence but not yet offering strong trend signals. FX exposure remained light and balanced.
Crypto
Crypto exposure was minimal. Trend signals deteriorated further, reinforcing caution.
Final Reflections – Thawing Breadth, Fragile Conviction
This week marked an important transition. Markets did not explode higher, but they stopped fighting themselves. Breadth improved modestly, volatility compressed, and leadership became more visible, though still uneven.
Three observations define the week:
- Breadth is attempting to improve.
The move toward the high forties on the TTU Trend Barometer suggests that fewer markets are breaking down simultaneously, even if broad trend alignment has yet to emerge. - Metals have assumed leadership.
This is the cleanest and most durable trend cluster currently available. - Energy remains unresolved.
Without energy confirmation, regime shifts remain fragile.
This is not yet a full trend renaissance. But it is no longer a market defined by violence without follow-through. Structure is beginning to assert itself. For systematic trend followers, this is the phase where patience, consistent sizing and respect for exits begin to matter again.
The market is warming. The only question now is whether it can hold.

List of Resources used in the Week in Review
Important Disclaimers
This document is directly solely to Accredited Investors, Qualified Eligible Participants, Qualified Clients and Qualified Purchasers. No investment decision should be made until prospective investors have read the detailed information in the fund offering documents of any manager mentioned in this document. This document is furnished on a confidential basis only for the use of the recipient and only for discussion purposes and is subject to amendment This document is neither advice nor a recommendation to enter into any transaction. This document is not an offer to buy or sell, nor a solicitation of an offer to buy or sell, any security or other financial instrument. This presentation is based on information obtained from sources that TopTradersUnplugged (“TTU”) (“considers to be reliable however, TTU makes no representation as to, and accepts no responsibility or liability for, the accuracy or completeness of the information. TTU has not independently verified third party manager or benchmark information, does not represent it as accurate, true or complete, makes no warranty, express or implied regarding it and shall not be liable for any losses, damages, costs or expenses relating to its adequacy, accuracy, truth, completeness or use.
All projections, valuations, and statistical analyses are provided to assist the recipient in the evaluation of the matters described herein. Such projections, valuations and analyses may be based on subjective assessments and assumptions and may use one among many alternative methodologies that produce different results accordingly, such projections, valuations and statistical analyses should not be viewed as facts and should not be relied upon as an accurate prediction of future events. There is no guarantee that any targeted performance will be achieved Commodity trading involves substantial risk of loss and may not be suitable for everyone
TTU is not and does not purport to be an advisor as to legal, taxation, accounting, financial or regulatory matters in any jurisdiction. The recipient should independently evaluate and judge the matters referred to herein. TTU does not provide advice or recommendations regarding an investor’s decision to allocate to funds or accounts managed by any manager (“or to maintain or sell investments in funds or accounts managed by any manager, and no fiduciary relationship under ERISA is created by the investor investing in funds or accounts managed by any manager, or through any communication between TTU and the investor
In reviewing this document, it should be understood that the past performance results of any asset class, or any investment or trading program set forth herein, are not necessarily indicative of any future results that may be achieved in connection with any transaction. Any persons subscribing for an investment must be able to bear the risks involved and must meet the suitability requirements relating to such investment. Some or all alternative investment programs discussed herein may not be suitable for certain investors This document is directed only to persons having professional experience in matters relating to investments. Any investment or investment activity to which this document relates is available only to such investment professionals. Persons who do not have professional experience in matters relating to investments should not rely upon this document.
This document and its contents are proprietary information of TTU and may not be reproduced or otherwise disseminated in whole or in part without TTU’s prior written consent.
This document contains simulated or hypothetical performance results that have certain inherent limitations AND SHOULD BE VIEWED FOR ILLUSTRATIVE PURPOSES. Unlike the results shown in an actual performance record, these results do not represent actual trading. HYPOTHETICAL PERFORMANCE RESULTS HAVE MANY INHERENT LIMITATIONS, SOME OF WHICH ARE DESCRIBED BELOW. NO REPRESENTATION IS BEING MADE THAT ANY ACCOUNT WILL OR IS LIKELY TO ACHIEVE PROFITS OR LOSSES SIMILAR TO THOSE SHOWN IN FACT, THERE ARE FREQUENTLY SHARP DIFFERENCES BETWEEN HYPOTHETICAL PERFORMANCE RESULTS AND THE ACTUAL RESULTS SUBSEQUENTLY ACHIEVED BY ANY PARTICULAR INVESTMENT ACCOUNT.
ONE OF THE LIMITATIONS OF HYPOTHETICAL PERFORMANCE RESULTS IS THAT THEY ARE GENERALLY PREPARED WITH THE BENEFIT OF HINDSIGHT IN ADDITION, HYPOTHETICAL TRADING DOES NOT INVOLVE FINANCIAL RISK, AND NO HYPOTHETICAL TRADING RECORD CAN COMPLETELY ACCOUNT FOR THE IMPACT OF FINANCIAL RISK IN ACTUAL TRADING FOR EXAMPLE, THE ABILITY TO WITHSTAND LOSSES OR TO ADHERE TO A PARTICULAR TRADING PROGRAM OR OTHER ASSET.
There are numerous other factors related to the markets in general or to the implementation of any specific trading program which cannot be fully accounted for in the preparation of hypothetical performance results and all of which can adversely affect actual trading results. No representation is being made that any investment will or is likely to achieve profits or losses similar to those being shown.
Most Comprehensive Guide to the Best Investment Books of All Time

Most Comprehensive Guide to the Best Investment Books of All Time
Get the most comprehensive guide to over 600 of the BEST investment books, with insights, and learn from some of the wisest and most accomplished investors in the world. A collection of MUST READ books carefully selected for you. Get it now absolutely FREE!
Get Your FREE Guide HERE!