


Trend Following - Week in Review - December 26, 2025

“Silent Night, Narrow Light”
This Week in Trend – 26 December 2025
Welcome to This Week in Trend, your weekly view into the evolving structure of global futures markets and the behaviour of systematic trend following. This edition covers conditions through the close of US markets on Friday, 26 December 2025.
Markets entered the Christmas week in a subdued, almost hushed state. Volatility compressed further, equity indices drifted higher without urgency, and much of the futures complex moved sideways.
Beneath that calm, leadership narrowed sharply. A small number of markets carried the entire trend-following return profile. Metals shone brightly, delivering strong, persistent trends, while participation elsewhere faded. Breadth weakened, opportunity contracted, and the market quietly concentrated its rewards.
It was a silent week in markets, illuminated by only a few strong lights.
SG Trend Index Performance
Month to date: +2.01 percent
Year to date: +2.49 percent
Last week:
• +0.53 percent MTD
• +1.00 percent YTD
The SG Trend Index delivered a decisive step higher this week, with December gains accelerating sharply and year to date performance following suit. Unlike last week’s improvement, which was accompanied by tentative breadth stabilisation, this advance occurred alongside a clear contraction in participation.
Returns were driven almost entirely by a narrow set of dominant trends rather than broad market alignment. Metals accounted for the bulk of performance, with silver, platinum and palladium extending powerful, uninterrupted advances. Gold continued to grind higher, while copper held its breakout, reinforcing the cluster’s leadership.
At the same time, continued volatility compression reduced interference across existing positions. The result was strong compounding within a small number of mature trends rather than incremental gains across a wide opportunity set. This was a week where concentration, not diversification, defined index performance.
TTU Trend Barometer
Current reading: 36 percent
Previous reading: 48 percent
10 day rate of change: Falling moderately
The TTU Trend Barometer fell sharply to 36 percent this week, moving deeper into a weak trend regime and reversing last week’s tentative improvement. This decline signals a clear contraction in shorter-term trend breadth, even as overall trend-following performance improved.
The deterioration was broad-based. Many markets that had begun to stabilise failed to transition into sustained trends. Energy, grains, soft commodities, crypto and parts of the currency complex all contributed to the decline. Outside metals, trend persistence weakened rather than strengthened.
Importantly, this drop in breadth occurred alongside continued volatility compression. The absence of stress-driven displacement confirms that this is not a disorderly environment. Instead, it reflects a market quietly withdrawing opportunity, concentrating trend strength into a shrinking subset of markets.
At 36 percent, the barometer confirms that participation is thinning, not expanding. The falling rate of change reinforces that trend formation is not improving at the margin. This is an environment where returns depend on staying aligned with existing leaders rather than anticipating a broad regime shift. Opportunity remains, but it is selective, concentrated, and unforgiving of drift.
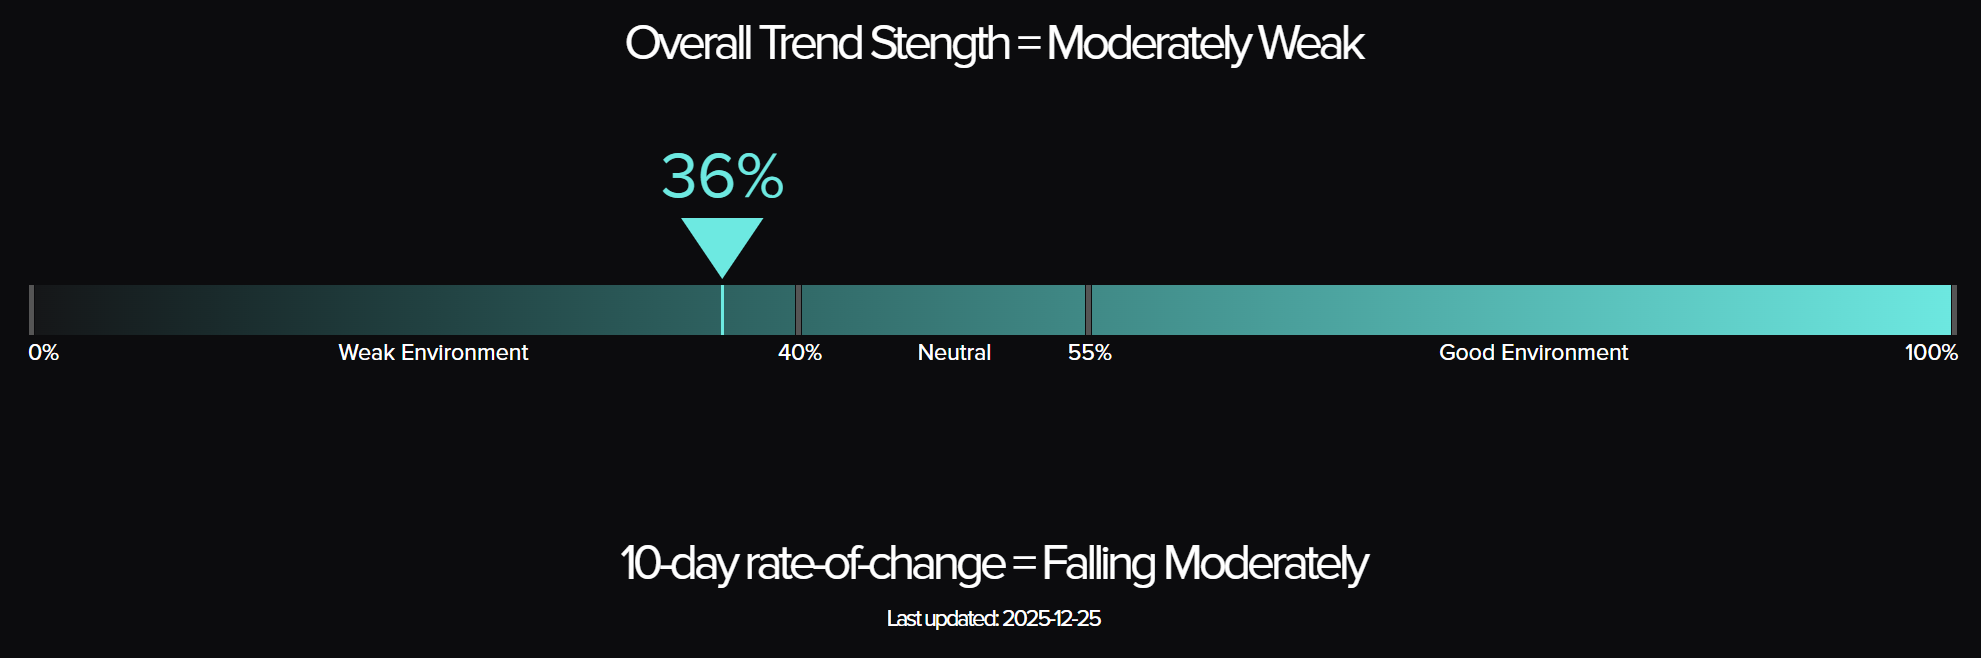
The Top Traders Unplugged (TTU) Trend Barometer is a proprietary tool that measures the percentage of markets with medium to strong trends. Similar to a thermometer, where 0 degrees Celsius equates to freezing, a TTU Trend Barometer reading below 40% indicates a “cold” environment for trend-following, while readings above 55% signal a “hotter,” more favourable trend environment.
Weekly Asset Class Snapshot
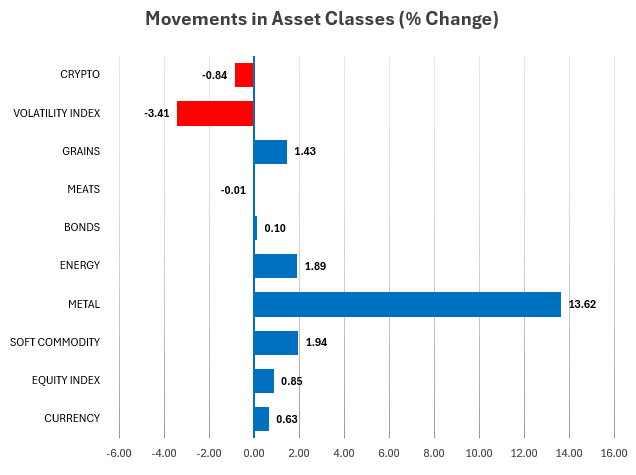
Source: Finwiz.com
- Volatility Index (−3.41 percent | prev −7.17 percent)
Volatility continued to compress, reinforcing the calm surface conditions across markets. This environment supports persistence in existing trends but offers little fuel for new trend formation. - Crypto (−0.84 percent | prev −2.81 percent)
Crypto remained under pressure. Bitcoin continues to trade in a corrective structure following its sharp reversal, with trend signals weakening further. - Grains (+1.43 percent | prev −1.51 percent)
Grains posted a modest rebound, but structure remains fragile. Moves across corn, wheat and soy appear corrective rather than trend-forming. - Meats (−0.01 percent | prev +0.96 percent)
Meats consolidated. Live and feeder cattle remain structurally intact, but momentum has slowed. The cluster continues to act as a low-volatility stabiliser rather than a return driver. - Bonds (+0.10 percent | prev +0.30 percent)
Rates stabilised further. Trends remain slow and range bound, offering persistence without conviction. - Energy (+1.89 percent | prev −1.76 percent)
Energy rebounded selectively. Natural gas surged, but crude and refined products failed to confirm broader leadership. Structural fragility remains. - Metals (+13.62 percent | prev +8.54 percent)
Metals dominated again. Silver, platinum and palladium extended powerful upside trends, with gold grinding higher and copper holding its breakout. This remains the clearest and most durable leadership cluster. - Soft Commodities (+1.94 percent | prev +0.81 percent)
Soft commodities were mixed and rotational. Coffee stabilised, while cocoa and sugar continued to weaken. Selective opportunities persist, but cluster cohesion remains low. - Equity Index (+0.85 percent | prev +0.04 percent)
Equities advanced modestly. Major indices held their uptrend structures without accelerating. The absence of breakdown continues to be the key feature. - Currency (+0.63 percent | prev −0.37 percent)
Currencies drifted higher but remain largely directionless. FX continues to express balance rather than sustained trend conviction.
Performance Highlights – This Week’s Market Leaders & Laggards
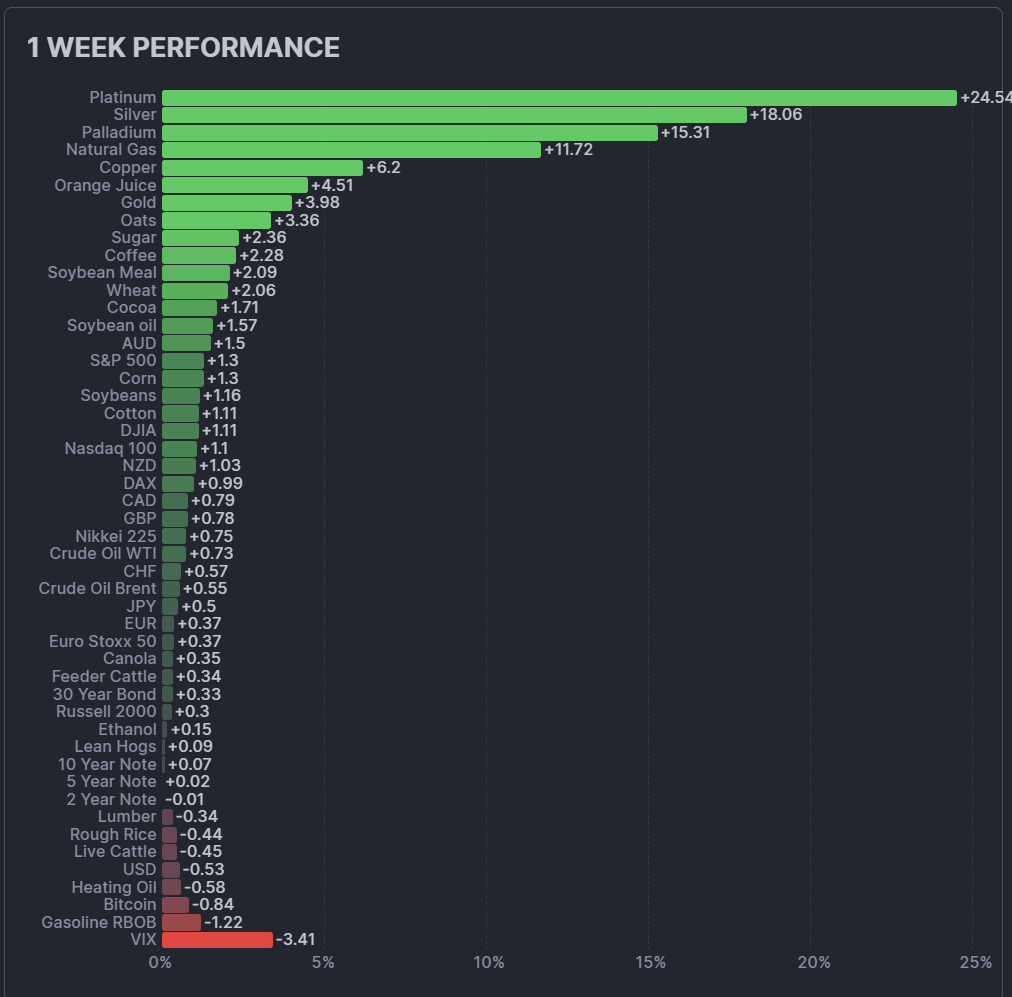
Top Market Movers
Top Gainers
- Platinum +24.54 percent
Platinum delivered the strongest move of the week, extending a powerful and uninterrupted advance. Structure remains firmly trend-aligned with little evidence of exhaustion. - Silver +18.06 percent
Silver accelerated sharply higher, reinforcing metals dominance. Momentum expanded on top of an already well-established trend. - Palladium +15.31 percent
Palladium continued its breakout, completing a coordinated metals leadership cluster marked by persistence and minimal pullback. - Natural Gas +11.72 percent
Natural gas surged again, standing out as the sole energy market showing sustained directional conviction.
Top Losers
- VIX −3.41 percent
Volatility continued to compress, reinforcing the calm surface conditions supporting existing trends. - Gasoline −1.22 percent
Gasoline weakened further, confirming the lack of cohesion across refined products. - Bitcoin −0.84 percent
Bitcoin extended its corrective phase following the recent reversal, with trend signals continuing to deteriorate. - Heating Oil −0.58 percent
Heating oil drifted lower, adding to the broader energy complex’s structural fragility.
Portfolio View - Positioning and Impact
Equities
Equity positioning remained largely unchanged. Major indices continued to hold their primary trend structures, supporting existing exposure on both the long and short side where applicable. With no decisive breakout or breakdown, patience continues to be favoured over rotation.
Metals
Metals were the dominant contributor to portfolio performance. Long exposure across silver, platinum and palladium remained firmly aligned with strong, persistent trends, while limited countertrend opportunities existed on the short side. This cluster represents the clearest expression of directional conviction in the portfolio.
Energy
Energy remained fragmented. Long exposure was selectively rewarded in natural gas, while crude and refined products continued to offer better opportunities on the short side or no exposure at all. Dispersion across models remained elevated, reinforcing the need for selective positioning rather than broad participation.
Soft Commodities and Meats
Soft commodities continued to rotate. Selective long exposure persisted in isolated markets, while short exposure remained more prominent in structurally weak contracts. Meats continued to provide steady contribution on both sides of the book, acting as a stabilising sleeve with lower volatility.
Rates and FX
Rates held in narrow ranges, supporting existing positions but generating limited incremental return. Both long and short exposure remained light due to weak trend persistence. FX continued to express balance rather than conviction, with positioning remaining small and diversified.
Crypto
Crypto exposure remained minimal. Structural deterioration favoured either short exposure or standing aside altogether, reinforcing caution in this segment.
Final Reflections – Silent Night, Narrow Light
This week delivered a powerful reminder that performance and participation do not always travel together. Markets were calm, volatility compressed further, and returns improved materially, yet the underlying opportunity set continued to narrow.
Three observations define the week:
- Breadth is contracting, not improving.
The sharp fall in the TTU Trend Barometer confirms that fewer markets are sustaining medium to strong trends. Participation is thinning even as headline performance strengthens. - Leadership is highly concentrated.
Metals remain the dominant source of trend-following returns. Outside this cluster, trend quality is sparse and inconsistent. - Quiet conditions favour persistence, not expansion.
Volatility compression has supported existing trends but has not encouraged new ones to form. This is an environment that rewards alignment with established leaders rather than anticipation of broad regime change.
This is not a broad trend renaissance. It is a selective phase where strong returns are being delivered by a small number of markets, while much of the futures universe remains dormant or rotational. For systematic trend followers, this is a period where discipline, consistent sizing, and respect for exits matter more than signal generation.
As markets settle into the final days of the year, the tone is calm, measured, and concentrated. The lights are few, but they are bright.
With that, we wish all readers a peaceful Christmas and a restorative holiday break. May the quiet of the season bring clarity, patience, and perspective as we look ahead to the year to come.

List of Resources used in the Week in Review
Important Disclaimers
This document is directly solely to Accredited Investors, Qualified Eligible Participants, Qualified Clients and Qualified Purchasers. No investment decision should be made until prospective investors have read the detailed information in the fund offering documents of any manager mentioned in this document. This document is furnished on a confidential basis only for the use of the recipient and only for discussion purposes and is subject to amendment This document is neither advice nor a recommendation to enter into any transaction. This document is not an offer to buy or sell, nor a solicitation of an offer to buy or sell, any security or other financial instrument. This presentation is based on information obtained from sources that TopTradersUnplugged (“TTU”) (“considers to be reliable however, TTU makes no representation as to, and accepts no responsibility or liability for, the accuracy or completeness of the information. TTU has not independently verified third party manager or benchmark information, does not represent it as accurate, true or complete, makes no warranty, express or implied regarding it and shall not be liable for any losses, damages, costs or expenses relating to its adequacy, accuracy, truth, completeness or use.
All projections, valuations, and statistical analyses are provided to assist the recipient in the evaluation of the matters described herein. Such projections, valuations and analyses may be based on subjective assessments and assumptions and may use one among many alternative methodologies that produce different results accordingly, such projections, valuations and statistical analyses should not be viewed as facts and should not be relied upon as an accurate prediction of future events. There is no guarantee that any targeted performance will be achieved Commodity trading involves substantial risk of loss and may not be suitable for everyone
TTU is not and does not purport to be an advisor as to legal, taxation, accounting, financial or regulatory matters in any jurisdiction. The recipient should independently evaluate and judge the matters referred to herein. TTU does not provide advice or recommendations regarding an investor’s decision to allocate to funds or accounts managed by any manager (“or to maintain or sell investments in funds or accounts managed by any manager, and no fiduciary relationship under ERISA is created by the investor investing in funds or accounts managed by any manager, or through any communication between TTU and the investor
In reviewing this document, it should be understood that the past performance results of any asset class, or any investment or trading program set forth herein, are not necessarily indicative of any future results that may be achieved in connection with any transaction. Any persons subscribing for an investment must be able to bear the risks involved and must meet the suitability requirements relating to such investment. Some or all alternative investment programs discussed herein may not be suitable for certain investors This document is directed only to persons having professional experience in matters relating to investments. Any investment or investment activity to which this document relates is available only to such investment professionals. Persons who do not have professional experience in matters relating to investments should not rely upon this document.
This document and its contents are proprietary information of TTU and may not be reproduced or otherwise disseminated in whole or in part without TTU’s prior written consent.
This document contains simulated or hypothetical performance results that have certain inherent limitations AND SHOULD BE VIEWED FOR ILLUSTRATIVE PURPOSES. Unlike the results shown in an actual performance record, these results do not represent actual trading. HYPOTHETICAL PERFORMANCE RESULTS HAVE MANY INHERENT LIMITATIONS, SOME OF WHICH ARE DESCRIBED BELOW. NO REPRESENTATION IS BEING MADE THAT ANY ACCOUNT WILL OR IS LIKELY TO ACHIEVE PROFITS OR LOSSES SIMILAR TO THOSE SHOWN IN FACT, THERE ARE FREQUENTLY SHARP DIFFERENCES BETWEEN HYPOTHETICAL PERFORMANCE RESULTS AND THE ACTUAL RESULTS SUBSEQUENTLY ACHIEVED BY ANY PARTICULAR INVESTMENT ACCOUNT.
ONE OF THE LIMITATIONS OF HYPOTHETICAL PERFORMANCE RESULTS IS THAT THEY ARE GENERALLY PREPARED WITH THE BENEFIT OF HINDSIGHT IN ADDITION, HYPOTHETICAL TRADING DOES NOT INVOLVE FINANCIAL RISK, AND NO HYPOTHETICAL TRADING RECORD CAN COMPLETELY ACCOUNT FOR THE IMPACT OF FINANCIAL RISK IN ACTUAL TRADING FOR EXAMPLE, THE ABILITY TO WITHSTAND LOSSES OR TO ADHERE TO A PARTICULAR TRADING PROGRAM OR OTHER ASSET.
There are numerous other factors related to the markets in general or to the implementation of any specific trading program which cannot be fully accounted for in the preparation of hypothetical performance results and all of which can adversely affect actual trading results. No representation is being made that any investment will or is likely to achieve profits or losses similar to those being shown.
Most Comprehensive Guide to the Best Investment Books of All Time

Most Comprehensive Guide to the Best Investment Books of All Time
Get the most comprehensive guide to over 600 of the BEST investment books, with insights, and learn from some of the wisest and most accomplished investors in the world. A collection of MUST READ books carefully selected for you. Get it now absolutely FREE!
Get Your FREE Guide HERE!