


Trend Following - Week in Review - January 16, 2026

"Silver Surges as Trends Stabilise"
This Week in Trend – 16 January 2026
Welcome to This Week in Trend, your weekly view into the evolving structure of global futures markets and the behaviour of systematic trend following. This edition covers conditions through the close of US markets on Friday, 16 January 2026.
The story of the week was silver's spectacular continuation. The precious metal surged 13.37%, building on last week's recovery and extending the bullish trend that has defined the metals complex. Trend conditions improved meaningfully, with the TTU Barometer climbing back into neutral territory after weeks of weakness.
Equities delivered a mixed picture: small caps rallied strongly with the Russell 2000 up over 2%, while large-cap tech struggled, with the Nasdaq 100 down nearly 1%. Bitcoin joined the metals rally, surging 5.81%. Meanwhile, the grains complex diverged sharply: soybean oil jumped 5.68% while corn and soybean meal collapsed over 4% each.
This was a week of divergence within asset classes rather than broad directional moves.
SG Trend Index Performance
- Month to date: +4.97 percent
- Year to date: +4.97 percent
Last week:
- Month to date: +1.96 percent
- Year to date: +1.96 percent
The SG Trend Index surged nearly 3% this week, bringing month-to-date performance to an impressive +4.97%. This represents a significant acceleration from last week's +1.96% reading, driven primarily by the metals rally and broadening trend participation.
The improvement validates the thesis that last week's recovery was not a dead-cat bounce but the beginning of genuine trend reassertion. Systematic strategies that maintained discipline through January's early volatility are now being rewarded with meaningful gains.
TTU Trend Barometer
- Current reading: 45 percent
- Previous reading: 36 percent
- 10-day rate of change: Steady
The TTU Trend Barometer jumped to 45%, recovering from last week's 36% reading and moving back into neutral territory. The "Overall Trend Strength" indicator now reads "Neutral," a meaningful improvement from the prior week's "Moderately Weak" assessment.
This 9-percentage-point increase aligns with the strong performance seen in the SG Trend Index and suggests that trend participation is finally broadening. The rate of change has stabilised to "Steady," ending the concerning decline that characterised recent weeks.
At 45% with a steady rate of change, the barometer describes an environment that is neither hostile nor highly favourable for trend-following. Conditions have improved from challenging to workable, but sustained readings above 55% would signal a truly supportive environment.
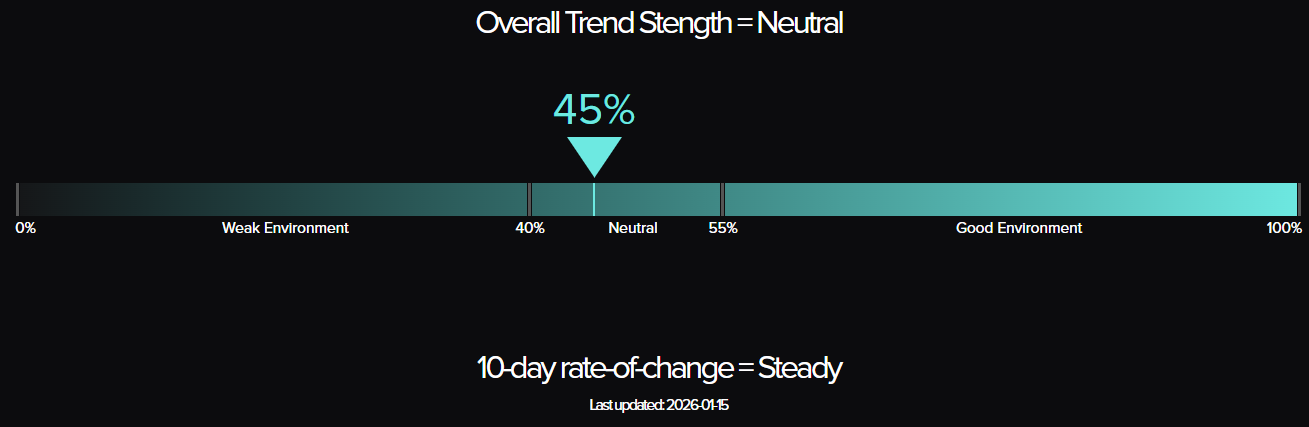
The Top Traders Unplugged (TTU) Trend Barometer is a proprietary tool that measures the percentage of markets with medium to strong trends. Similar to a thermometer, where 0 degrees Celsius equates to freezing, a TTU Trend Barometer reading below 40% indicates a “cold” environment for trend-following, while readings above 55% signal a “hotter,” more favourable trend environment.
Weekly Asset Class Snapshot
| ASSET CLASS | % MOVE | PREV |
| Crypto | +5.81% | +0.50% |
| Metal | +3.09% | +7.52% |
| Volatility Index | +3.06% | +0.14% |
| Meats | +1.02% | +0.39% |
| Soft Commodity | +0.94% | −0.73% |
| Energy | +0.29% | −0.28% |
| Equity Index | +0.21% | +2.99% |
| Grains | +0.08% | +2.54% |
| Currency | −0.05% | −0.53% |
| Bonds | −0.23% | +0.13% |
Source: Finwiz.com
- Crypto (+5.81 percent | prev +0.50 percent): Bitcoin surged over 5.8%, breaking out of its recent consolidation near $90,000. The move higher brings prices back toward $95,000 and suggests renewed bullish momentum after weeks of rangebound trading.
- Metal (+3.09 percent | prev +7.52 percent): Metals remained the dominant theme, though leadership shifted within the complex. Silver continued its explosive run with another 13.37% gain, while gold added 2.23%. Palladium reversed last week's rebound, falling 1.27%, and copper declined nearly 1%.
- Volatility Index (+3.06 percent | prev +0.14 percent): The VIX surged over 3%, a notable move that reflects the increasing uncertainty in equity markets. With large-cap indices under pressure, the rise in implied volatility is consistent with defensive positioning.
- Meats (+1.02 percent | prev +0.39 percent): Lean hogs continued their strong run with a 3.58% gain, lifting the sector average despite weakness in cattle. The divergence within the complex continues, with hogs in an established uptrend while cattle struggle to find direction.
- Soft Commodity (+0.94 percent | prev −0.73 percent): Softs reversed their recent weakness, led by lumber's 7.79% surge. Orange juice added 2.38%, and sugar gained 0.67%. However, cocoa extended its decline with another 4.81% drop, and coffee fell 0.71%.
- Energy (+0.29 percent | prev −0.28 percent): Energy posted modest gains on average, but the sector remained divergent. Heating oil led with a 4.54% gain, Brent crude added 1.42%, and WTI rose 0.41%. Natural gas continued its decline, down 1.89%, while ethanol fell 2.85%.
- Equity Index (+0.21 percent | prev +2.99 percent): Equities delivered a split decision. The Russell 2000 surged 2.12%, Euro Stoxx 50 added 0.63%, and Nikkei 225 gained 0.27%. However, the Nasdaq 100 fell 0.99%, the DJIA dropped 0.35%, and the S&P 500 declined 0.39%. Small caps outperformed large caps decisively.
- Grains (+0.08 percent | prev +2.54 percent): Grains were the most divergent sector of the week. Soybean oil surged 5.68% and rough rice gained 3.41%, but corn collapsed 4.66% and soybean meal dropped 4.54%. The average masks extreme dispersion within the complex.
- Currency (-0.05 percent | prev −0.53 percent): Currency markets were mixed but largely unchanged. The NZD was the strongest, up 0.36%, while the EUR was the weakest, down 0.34%. The US dollar edged higher, but FX trends remain shallow overall.
- Bonds (-0.23 percent | prev +0.13 percent): Bonds declined across the curve, with the 10-year note down 0.36% and the 30-year bond off 0.24%. Rising yields reflect continued hawkish Fed expectations and provide limited opportunity for trend followers.
Performance Highlights – This Week’s Market Leaders & Laggards
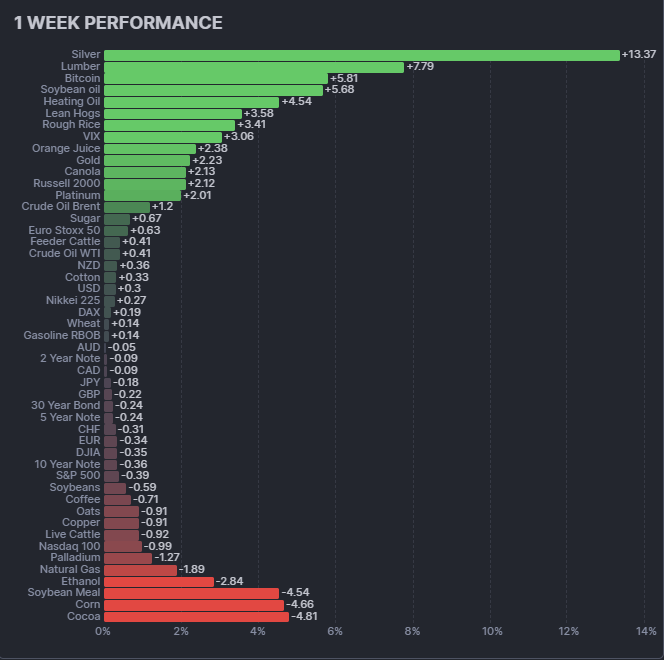
Top Market Movers
Top Gainers
- Silver +13.37 percent: Silver extended its blistering rally for a second consecutive week, surging to new highs above $89. The metal has now gained over 25% in the first two weeks of January, validating the powerful uptrend that emerged in late 2025.
- Lumber +7.79 percent: Lumber reversed sharply higher after recent weakness, posting its best week in months. The bounce suggests technical support has held and a new leg higher may be developing.
- Bitcoin +5.81 percent: Bitcoin broke out of its consolidation pattern, reclaiming the $95,000 level. The move suggests the digestion period is complete and the broader uptrend is resuming.
- Soybean Oil +5.68 percent: Soybean oil emerged as the standout performer in the grains complex, diverging sharply from the weakness in corn and soybean meal. The move extends a nascent uptrend.
Top Losers
- Cocoa −4.81 percent: Cocoa's decline continued for another week, extending what has become a brutal downtrend. The contract has now fallen from over $12,000 to approximately $5,000 since the peak.
- Corn −4.66 percent: Corn collapsed, reversing the prior week's gains and resuming its downtrend. The move highlights the continued pressure on the grain complex.
- Soybean Meal −4.54 percent: Soybean meal followed corn lower, demonstrating the stark divergence from soybean oil within the soy complex. The spread trade remains highly volatile.
- Ethanol −2.85 percent: Ethanol declined sharply, continuing to underperform the broader energy complex. The weakness reflects the grain price pressure flowing through to corn-based fuels.
Portfolio View - Positioning and Impact
Metals
Metals remained the primary contributor for the second consecutive week. Silver's continued surge rewarded long exposure handsomely, though the pullback in palladium and copper introduced some drag. The concentration of gains in silver underscores the importance of position sizing within the complex.
Equities
Equity positioning delivered mixed results. Small-cap exposure through the Russell 2000 contributed positively, but large-cap positions, particularly in tech-heavy indices, faced headwinds. The rotation from growth to value suggests portfolio balance between size factors is critical.
Energy
Energy positions performed well overall, with heating oil and crude oil longs offsetting continued weakness in natural gas. The sector's divergent behaviour requires careful management of individual position exposure.
Grains
Grains positioning faced challenges due to extreme divergence. Soybean oil longs delivered strong gains, but corn and soybean meal positions faced significant adverse movement. The spread dynamics within the complex require careful monitoring.
Soft Commodities
Soft commodity positioning improved this week, with lumber's surge providing unexpected gains. Cocoa short exposure, where held, continued to perform well as the contract's decline accelerated.
Rates and FX
Rates and currencies offered limited contribution. Bond positions faced modest losses as yields continued their rise, while FX trends remained too shallow to generate meaningful returns.
Crypto
Bitcoin's breakout rewarded long exposure with a solid week of gains. The move validates allocation to the digital asset space as trend conditions improve.
Final Reflections – Silver Surges as Trends Stabilise
The third week of January delivered confirmation that the trend environment is genuinely improving, not just bouncing.
Three observations define the week:
- Trend breadth is expanding: The TTU Barometer's jump from 36% to 45% signals that trend participation is broadening beyond the metals complex. This improvement in breadth is essential for sustained trend-following performance.
- Divergence within asset classes dominates: The grains complex exemplifies this week's theme—soybean oil up 5.68% while corn collapsed 4.66%. Within equities, small caps surged while tech struggled. These divergences reward selective positioning over broad beta exposure.
- Silver remains the story: Back-to-back weeks of double-digit or near double-digit gains have made silver the undisputed leader of this young year. The trend is powerful, but the velocity of gains also warrants respect for the inevitable corrections that lie ahead.
This was a week of trend stabilisation and selective opportunity. For systematic trend followers, the message is clear: conditions are improving, but the environment still rewards precision over aggression.
Silver surges. Trends stabilise. The opportunities are expanding.

List of Resources used in the Week in Review
Important Disclaimers
This document is directly solely to Accredited Investors, Qualified Eligible Participants, Qualified Clients and Qualified Purchasers. No investment decision should be made until prospective investors have read the detailed information in the fund offering documents of any manager mentioned in this document. This document is furnished on a confidential basis only for the use of the recipient and only for discussion purposes and is subject to amendment This document is neither advice nor a recommendation to enter into any transaction. This document is not an offer to buy or sell, nor a solicitation of an offer to buy or sell, any security or other financial instrument. This presentation is based on information obtained from sources that TopTradersUnplugged (“TTU”) (“considers to be reliable however, TTU makes no representation as to, and accepts no responsibility or liability for, the accuracy or completeness of the information. TTU has not independently verified third party manager or benchmark information, does not represent it as accurate, true or complete, makes no warranty, express or implied regarding it and shall not be liable for any losses, damages, costs or expenses relating to its adequacy, accuracy, truth, completeness or use.
All projections, valuations, and statistical analyses are provided to assist the recipient in the evaluation of the matters described herein. Such projections, valuations and analyses may be based on subjective assessments and assumptions and may use one among many alternative methodologies that produce different results accordingly, such projections, valuations and statistical analyses should not be viewed as facts and should not be relied upon as an accurate prediction of future events. There is no guarantee that any targeted performance will be achieved Commodity trading involves substantial risk of loss and may not be suitable for everyone
TTU is not and does not purport to be an advisor as to legal, taxation, accounting, financial or regulatory matters in any jurisdiction. The recipient should independently evaluate and judge the matters referred to herein. TTU does not provide advice or recommendations regarding an investor’s decision to allocate to funds or accounts managed by any manager (“or to maintain or sell investments in funds or accounts managed by any manager, and no fiduciary relationship under ERISA is created by the investor investing in funds or accounts managed by any manager, or through any communication between TTU and the investor
In reviewing this document, it should be understood that the past performance results of any asset class, or any investment or trading program set forth herein, are not necessarily indicative of any future results that may be achieved in connection with any transaction. Any persons subscribing for an investment must be able to bear the risks involved and must meet the suitability requirements relating to such investment. Some or all alternative investment programs discussed herein may not be suitable for certain investors This document is directed only to persons having professional experience in matters relating to investments. Any investment or investment activity to which this document relates is available only to such investment professionals. Persons who do not have professional experience in matters relating to investments should not rely upon this document.
This document and its contents are proprietary information of TTU and may not be reproduced or otherwise disseminated in whole or in part without TTU’s prior written consent.
This document contains simulated or hypothetical performance results that have certain inherent limitations AND SHOULD BE VIEWED FOR ILLUSTRATIVE PURPOSES. Unlike the results shown in an actual performance record, these results do not represent actual trading. HYPOTHETICAL PERFORMANCE RESULTS HAVE MANY INHERENT LIMITATIONS, SOME OF WHICH ARE DESCRIBED BELOW. NO REPRESENTATION IS BEING MADE THAT ANY ACCOUNT WILL OR IS LIKELY TO ACHIEVE PROFITS OR LOSSES SIMILAR TO THOSE SHOWN IN FACT, THERE ARE FREQUENTLY SHARP DIFFERENCES BETWEEN HYPOTHETICAL PERFORMANCE RESULTS AND THE ACTUAL RESULTS SUBSEQUENTLY ACHIEVED BY ANY PARTICULAR INVESTMENT ACCOUNT.
ONE OF THE LIMITATIONS OF HYPOTHETICAL PERFORMANCE RESULTS IS THAT THEY ARE GENERALLY PREPARED WITH THE BENEFIT OF HINDSIGHT IN ADDITION, HYPOTHETICAL TRADING DOES NOT INVOLVE FINANCIAL RISK, AND NO HYPOTHETICAL TRADING RECORD CAN COMPLETELY ACCOUNT FOR THE IMPACT OF FINANCIAL RISK IN ACTUAL TRADING FOR EXAMPLE, THE ABILITY TO WITHSTAND LOSSES OR TO ADHERE TO A PARTICULAR TRADING PROGRAM OR OTHER ASSET.
There are numerous other factors related to the markets in general or to the implementation of any specific trading program which cannot be fully accounted for in the preparation of hypothetical performance results and all of which can adversely affect actual trading results. No representation is being made that any investment will or is likely to achieve profits or losses similar to those being shown.
Most Comprehensive Guide to the Best Investment Books of All Time

Most Comprehensive Guide to the Best Investment Books of All Time
Get the most comprehensive guide to over 600 of the BEST investment books, with insights, and learn from some of the wisest and most accomplished investors in the world. A collection of MUST READ books carefully selected for you. Get it now absolutely FREE!
Get Your FREE Guide HERE!