


Trend Following - Week in Review—February 13, 2026

"Bonds Rise and Grains Hold as Equities Falter and Risk Sentiment Shifts"
This Week in Trend – 13 February 2026
Welcome to This Week in Trend, your weekly view into the evolving structure of global futures markets and the behaviour of systematic trend following. This edition covers conditions through the close of US markets on Friday, 13 February 2026.
The story of the week was a shift in risk sentiment. US equities faltered, with the S&P 500 falling 1.47%, Nasdaq 100 dropping 1.43%, and the DJIA declining 1.27%, while the VIX surged 9.89%. Meanwhile, bonds rallied meaningfully across the curve, with the 30-year bond gaining 1.98% and the 10-year note rising 0.95%. The Japanese yen strengthened 2.79% as safe-haven demand returned. The week had a distinctly risk-off character.
Grains extended their positive run for a second week, led by wheat (+3.59%), soybean oil (+3.16%), and oats (+2.98%). Soft commodities presented a sharply mixed picture: orange juice surged 15.83% in a dramatic reversal of last week's 24.75% collapse, while cocoa crashed 14.30% and sugar fell 2.53%. Gold continued its march higher with a 1.34% gain, extending to fresh all-time highs above $5,063. Bitcoin's decline decelerated sharply to -2.03%, a significant improvement from last week's -16.46% plunge.
The trend environment deteriorated materially. The TTU Barometer fell from 55% to 43%, breaching the critical 55% threshold and dropping into "Neutral" territory for the first time since January. The 10-day rate of change shifted to "Falling Moderately," indicating that trend breakdowns are now outpacing new trend formation at a meaningful pace. The SG Trend Index improved to +1.09% month-to-date, with the year-to-date reading advancing to +5.85% — a notable divergence between fund performance and underlying trend conditions.
This was a week of risk rotation and trend deterioration. Defensive assets led. Cyclical assets lagged. Systematic fund performance held up, but the environment beneath it weakened significantly.
SG Trend Index Performance
Month to date: +1.09 percent
Year to date: +5.85 percent
Last week:
Month to date: -0.43 percent
Year to date: +4.26 percent
The SG Trend Index recovered strongly in the second week of February, climbing from -0.43% to +1.09% month-to-date. The year-to-date reading advanced to +5.85%, building on January’s +4.76% foundation and confirming that 2026 continues to reward systematic trend-following strategies.
The recovery was driven by several favourable developments: continued strength in gold and precious metals, the bond rally benefiting long duration positions, and yen appreciation rewarding short-dollar exposure. The stabilisation in Bitcoin, falling only 2.03% versus last week’s 16.46% plunge, also reduced portfolio drag. Energy’s continued decline was modest enough (-1.18% sector average) to avoid the severe whipsaw losses seen in the prior two weeks. The SG Index's swing from negative to positive within a single week demonstrates the rapid rotation and recovery characteristic of diversified trend-following portfolios, though the deteriorating TTU Barometer suggests this resilience will be tested in the weeks ahead.
TTU Trend Barometer
Current reading: 43 percent
Previous reading: 55 percent
10-day rate of change: Falling Moderately
The TTU Trend Barometer fell 12 percentage points from 55% to 43%, breaching the critical 55% threshold and dropping firmly into "Neutral" territory. This is the most significant weekly deterioration since the barometer sat at 45% in mid-January, and it reverses the recovery that had lifted conditions from that level to 68% and back. The barometer has now given back all of the gains from the January surge and then some.
The 10-day rate of change shifted from "Falling Weakly" to "Falling Moderately," indicating that trend breakdowns are accelerating rather than stabilising. Last week's reading of 55% sat right at the boundary between "Strong" and neutral. The risk flagged in that report — that further deterioration would push conditions into the neutral zone where trend-following historically faces headwinds — has now materialised. The barometer did not hold. It broke lower decisively.
The decline reflects the cumulative impact of several weeks of sector rotation and trend disruption. Energy trends have broken down. Soft commodity trends remain in disarray. US equity trends are now weakening. The meats sector reversed sharply. While bonds, gold, the yen, and grains are establishing or extending trends, these emerging opportunities have not been sufficient to offset the broader erosion in trend quality across the full futures universe.
At 43% with moderately falling momentum, the barometer sends a cautionary message. The environment has shifted from supportive to neutral, a zone where systematic trend-following strategies historically generate lower returns and face higher whipsaw risk. The divergence between the falling barometer and the positive SG Trend Index (+1.09% MTD) is notable — fund performance is holding up better than the underlying trend conditions suggest. This divergence rarely persists. Either new trends must emerge quickly to stabilise the barometer, or portfolio returns are likely to come under pressure in the weeks ahead.
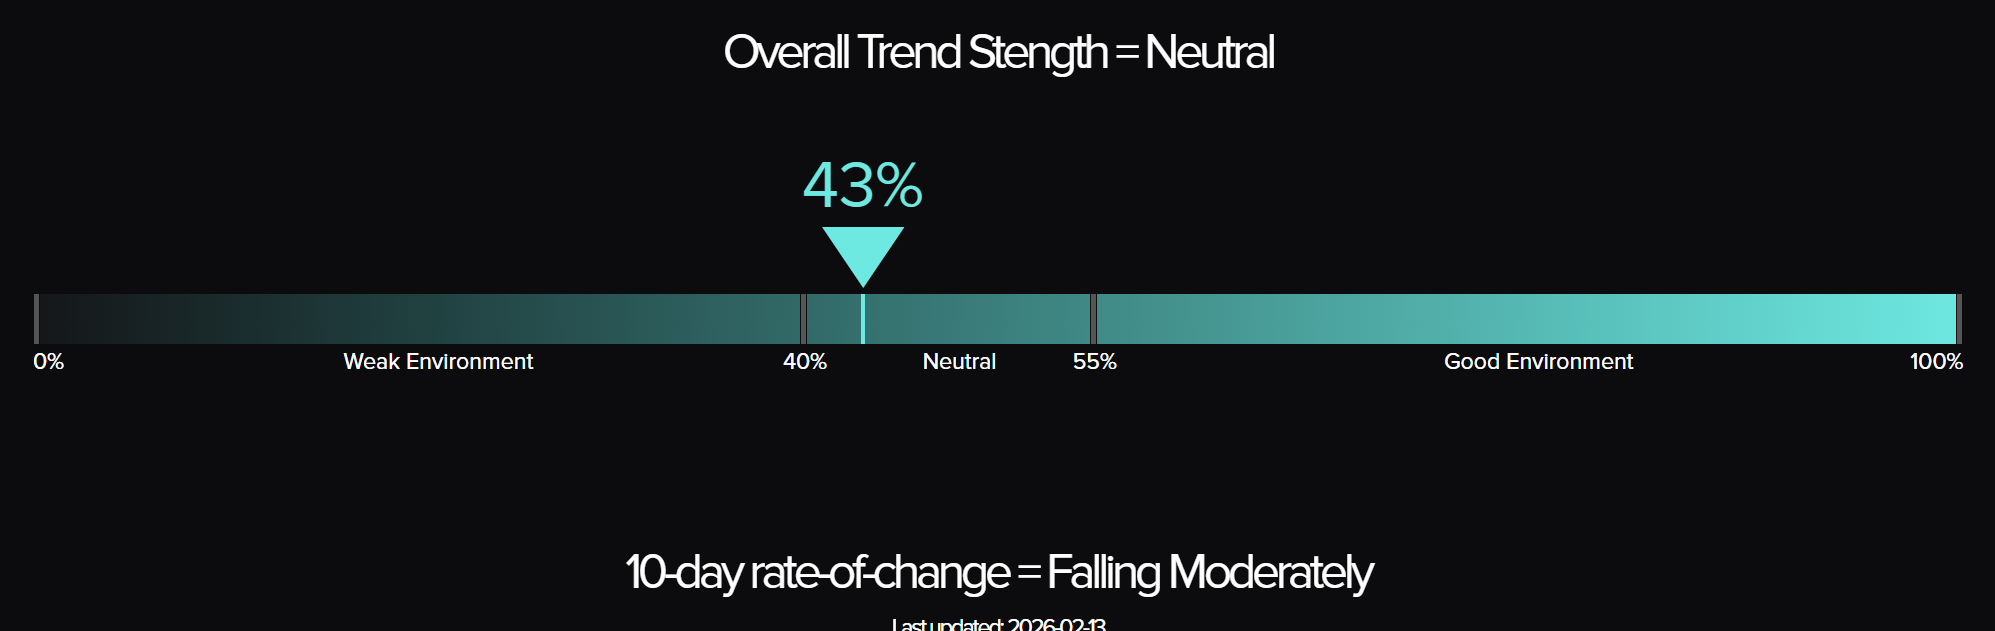
The Top Traders Unplugged (TTU) Trend Barometer is a proprietary tool that measures the percentage of markets with medium to strong trends. Similar to a thermometer, where 0 degrees Celsius equates to freezing, a TTU Trend Barometer reading below 40% indicates a “cold” environment for trend-following, while readings above 55% signal a “hotter,” more favorable trend environment.
Weekly Asset Class Snapshot
| Asset Class | % Move | Prev |
| Volatility Index | +9.89% | +0.48% |
| Grains | +1.38% | +1.59% |
| Soft Commodity | +1.01% | −6.52% |
| Bonds | +0.91% | +0.19% |
| Currency | +0.52% | −0.35% |
| Equity Index | −0.10% | +1.36% |
| Metal | −0.37% | +0.67% |
| Energy | −1.18% | −4.68% |
| Meats | −1.97% | +1.70% |
| Crypto | −2.03% | −16.46% |
Source: Finviz.com
Volatility Index (+9.89 percent | prev +0.48 percent)
The VIX surged 9.89%, the week’s most dramatic sector move on a percentage basis and a sharp acceleration from last week’s modest 0.48% gain. Implied volatility spiked as US equities sold off, with the index pushing above the 21 level. The weekly chart shows the VIX bouncing off recent lows and printing a strong bullish candle, suggesting equity market anxiety is rising meaningfully. The VIX surge is consistent with the broad shift toward risk-off positioning seen across asset classes this week.
Grains (+1.38 percent | prev +1.59 percent)
Grains posted a second consecutive positive week, though with a shift in internal leadership. Wheat led the complex with a 3.59% gain, reversing last week’s 1.53% decline. Soybean oil surged 3.16% and oats gained 2.98%. Soybean meal added 1.84% and soybeans rose 1.59%, continuing the soybean complex’s strength. Corn gained a modest 0.35% and canola edged up 0.41%. Rough rice was the lone decliner at -1.87%. The weekly charts show wheat attempting to stabilise near the 549 level after an extended decline, while soybeans continue to consolidate above 1,134. The breadth of grain strength, with seven of eight components positive, is encouraging for trend formation in the agricultural space.
Soft Commodity (+1.01 percent | prev −6.52 percent)
Soft commodities posted their first positive sector average in four weeks, though the headline number masks extreme divergence within the complex. Orange juice surged 15.83%, staging a dramatic rebound after last week’s devastating 24.75% collapse. Coffee gained 3.11%, reversing last week’s 10% decline. Cotton added 1.73% and lumber rose 2.22%. However, cocoa crashed 14.30%, extending its brutal downtrend and hitting levels near 3,663 – the contract has now fallen roughly 70% from its 2024 highs. Sugar declined 2.53%. The sector remains deeply bifurcated. The OJ bounce is notable but follows an enormous decline and does not yet signal trend reversal. Cocoa’s accelerating downtrend continues to dominate the sector’s narrative.
Bonds (+0.91 percent | prev +0.19 percent)
Bonds posted their strongest week in months, with gains accelerating sharply from last week’s marginal +0.19%. The 30-year bond led with a 1.98% gain, followed by the 10-year note (+0.95%), the 5-year note (+0.54%), and the 2-year note (+0.15%). The steepening pattern, with longer duration outperforming, is consistent with a flight-to-quality bid as equity markets weakened. The weekly charts show all four instruments printing constructive green candles, with the 30-year bond at 117.78 and the 10-year note pushing to 113.19. This marks a fourth consecutive week of gains for the bond complex, and the trend is beginning to establish itself more clearly. For trend followers, the bond sector is transitioning from consolidation to potential trend opportunity.
Currency (+0.52 percent | prev −0.35 percent)
Currencies reversed last week’s modest decline against the US dollar, with the dollar weakening 0.70% on the index. The Japanese yen was the standout, surging 2.79% as safe-haven flows accelerated amid the equity selloff. Swiss franc gained 0.86%, followed by Australian dollar (+0.79%), euro (+0.37%), New Zealand dollar (+0.33%), Canadian dollar (+0.25%), and British pound (+0.19%). The yen’s strength is particularly notable – the weekly chart shows the currency breaking higher from recent consolidation near the 0.6567 level. The broad dollar weakness supports commodity prices and aligns with the risk-off rotation visible across other asset classes. Currency trends are becoming more directional, offering clearer signals for systematic strategies.
Equity Index (−0.10 percent | prev +1.36 percent)
Equities posted a mixed but net negative week, reversing last week’s broad gains. The sector was sharply divided between international and US markets. The Nikkei 225 continued its strong run with a 1.95% gain, and the DAX added 0.65%. However, US indices declined across the board: the S&P 500 fell 1.47%, Nasdaq 100 dropped 1.43%, DJIA lost 1.27%, and Russell 2000 declined 0.93%. The Euro Stoxx 50 slipped marginally at -0.13%. The weekly charts show US indices pulling back from recent highs, with the S&P 500 at 6,845 and the Nasdaq at 24,773. The Nikkei’s chart remains constructive, pushing above 57,550. The divergence between international strength and US weakness creates a complex positioning environment for equity trend followers.
Metal (−0.37 percent | prev +0.67 percent)
Metals posted a marginally negative week overall, though the internal picture was decidedly mixed. Gold continued to advance with a 1.34% gain, extending to fresh all-time highs above $5,063 – a remarkable achievement that extends the precious metal’s powerful multi-year bull trend. Silver gained 1.38%, building on gold’s momentum. However, platinum fell 1.06%, copper declined 1.34%, and palladium dropped 2.17%, keeping the industrial metals under pressure. The weekly charts tell a compelling story: gold’s parabolic advance continues unabated, silver is trending higher alongside gold, but copper and palladium remain range-bound. The precious-industrial divergence reflects the broader risk-off tone, with safe-haven metals outperforming cyclical ones.
Energy (−1.18 percent | prev −4.68 percent)
Energy declined for a second consecutive week, though the selling pressure moderated significantly from last week’s sharp -4.68%. Natural gas continued lower with a 5.23% decline, extending the reversal from its historic January rally, though the pace of decline has eased considerably from last week’s 21.41% plunge. Gasoline RBOB fell 2.16%, heating oil declined 1.05%, and crude oil WTI lost 1.04%, with Brent off 0.44%. Ethanol was the lone gainer at +1.85%. The weekly charts show crude oil settling near $62.81 for WTI and $67.73 for Brent, consolidating in a range. Natural gas at $3.10 remains well above the 2025 lows despite the two-week correction. The energy sector appears to be finding a floor after the violent January reversal.
Meats (−1.97 percent | prev +1.70 percent)
Meats reversed sharply after last week’s positive performance, dragged down by a 6.81% collapse in lean hogs. Live cattle gained 1.42% and feeder cattle was marginally negative at -0.51%, but the hog decline overwhelmed the cattle strength. The weekly chart for lean hogs shows a sharp bearish candle breaking below recent support at 91.33, suggesting the trend may be reversing after the strong run from mid-2025 lows. Live cattle at 240.40 continues to trade near historic highs, and feeder cattle at 362.88 remains in a well-established uptrend despite this week’s pause. The cattle trends remain intact; the hog reversal bears close monitoring.
Crypto (−2.03 percent | prev −16.46 percent)
Bitcoin’s decline decelerated dramatically, falling only 2.03% compared to last week’s brutal 16.46% plunge. Prices are stabilising near the $68,980 level, well below December’s highs but above the worst-case scenarios the prior week’s momentum suggested. The weekly chart shows the selling pressure easing, with a smaller-bodied candle replacing the large bearish bars of recent weeks. For systematic trend followers, the question is whether this represents genuine stabilisation or merely a pause before further declines. The trend remains firmly bearish, but the pace of deterioration has slowed materially. Most trend-following systems would now be flat or short, with any long exposure having been exited during the prior weeks’ decline.
Performance Highlights – This Week’s Market Leaders & Laggards
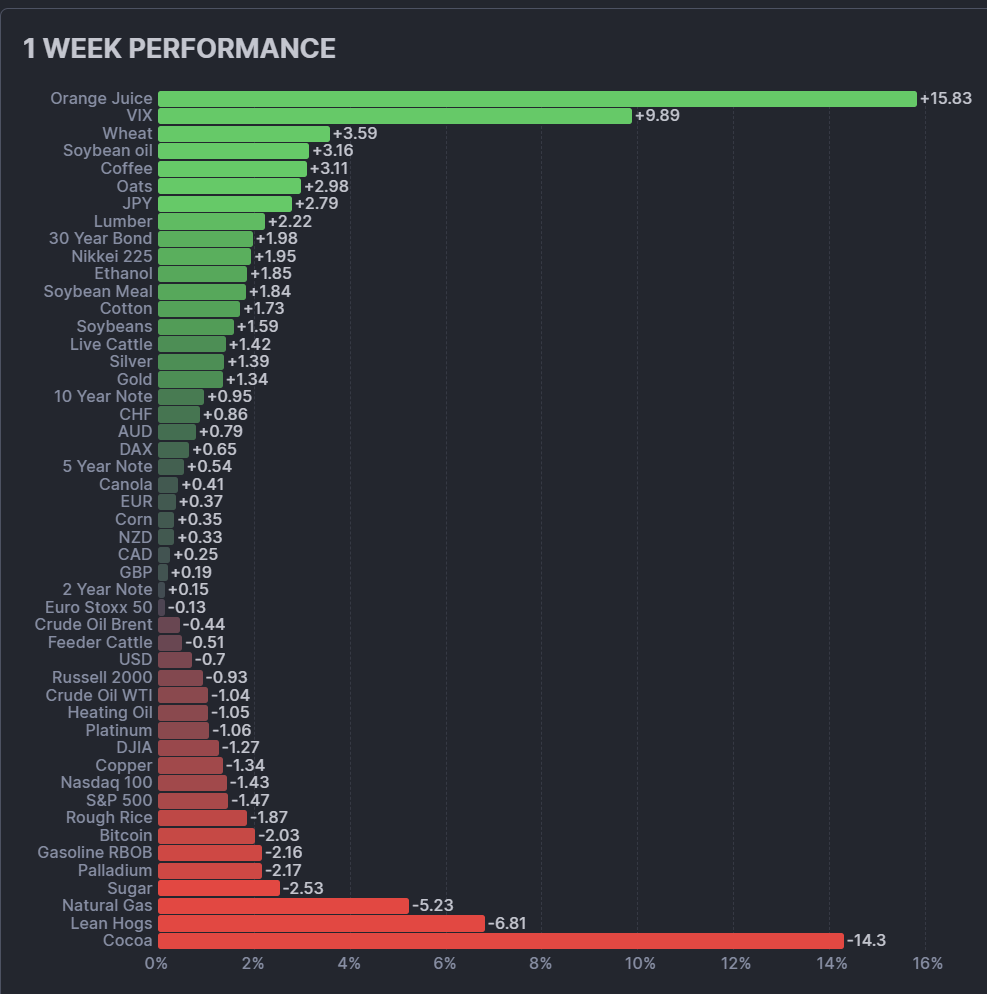
Source: Finviz.com
Top Market Movers
Top Gainers
1. Orange Juice +15.83 percent
Orange juice staged a dramatic rebound after last week’s devastating 24.75% collapse. The bounce, while impressive in percentage terms, recovers only a portion of the prior week’s decline and occurs within the context of a deeply established downtrend. The weekly chart at 182.80 shows the contract remains far below its 2024 highs. This is a relief rally within a bear market rather than a trend reversal. The volatility underscores the extreme conditions in the citrus market.
2. VIX +9.89 percent
The VIX surged as US equity markets sold off, jumping to around 21.20 on the weekly chart. The sharp rise from last week’s subdued +0.48% signals a genuine shift in risk sentiment. Rising implied volatility alongside falling equities is the classic risk-off pattern. The VIX’s movement validates the defensive positioning visible in bonds and the yen this week.
3. Wheat +3.59 percent
Wheat reversed last week’s 1.53% decline with a strong 3.59% gain, supported by supply concerns and export demand. The weekly chart shows prices at 549, attempting to form a base after an extended decline from the 2024 highs. While the longer-term trend remains bearish, the consecutive weeks of grain sector strength suggest the agricultural complex may be entering a more constructive phase.
4. Soybean Oil +3.16 percent
Soybean oil posted a second consecutive strong week, building on last week’s 3.40% gain. The weekly chart shows prices at 57.17, stabilising within its recent range. Biofuel demand and tightening global vegetable oil supplies continue to support the complex. The soybean sector’s persistent strength is one of the more constructive trends developing in the agricultural space.
Top Losers
1. Cocoa −14.30 percent
Cocoa’s collapse accelerated dramatically, falling 14.30% and taking the contract to around 3,663 on the weekly chart. The decline continues the brutal bear market that has seen prices fall approximately 70% from their 2024 highs. Improved West African production forecasts and weakening demand are driving the relentless selling. The weekly chart shows no sign of stabilisation, with the accelerating downtrend suggesting further losses ahead. For trend followers, the short cocoa trade has been one of 2026’s most profitable positions.
2. Lean Hogs −6.81 percent
Lean hogs suffered a sharp reversal, falling 6.81% after last week’s 2.94% gain. The weekly chart at 91.33 shows the contract breaking below recent support, potentially signalling a trend change after the strong rally from mid-2025 lows. Seasonal weakness and rising herd numbers may be pressuring prices. The severity of the decline warrants caution for long positioning in the hog market.
3. Natural Gas −5.23 percent
Natural gas continued to decline for a second straight week, though the 5.23% drop was far less dramatic than last week’s 21.41% plunge. At $3.10, the contract remains well above the 2025 lows but has given back a substantial portion of the historic January rally. The weekly chart shows the correction moderating, with a smaller bearish candle suggesting selling pressure is waning. The two-week cumulative decline of approximately 25% from peak levels highlights the extreme volatility in natural gas.
4. Sugar −2.53 percent
Sugar extended its decline with a 2.53% loss, pushing to 13.55 on the weekly chart. The contract continues to trade near multi-year lows as abundant global supply weighs on prices. The established downtrend shows no signs of reversal, with the weekly chart confirming persistent selling pressure. Sugar’s weakness adds to the challenging environment for the broader soft commodity complex.
Portfolio View - Positioning and Impact
Bonds positioning delivered the week’s strongest systematic returns. Long exposure across the curve generated meaningful gains, with the 30-year bond’s 1.98% rise providing the largest contribution. The 10-year note’s 0.95% gain and the 5-year note’s 0.54% rise added further. The steepening pattern and fourth consecutive week of gains are beginning to establish a trend that systematic models can exploit with increasing confidence. Duration exposure is being rewarded.
Metals positioning was mixed but net positive for precious metals-focused portfolios. Long gold exposure continued to compound returns as the metal pushed above $5,063. Silver longs also contributed positively with a 1.38% gain. However, platinum and copper positions detracted, and palladium longs generated losses. The precious-industrial divergence continues to favour portfolios with heavier gold and silver weighting. Gold’s trend remains the single most consistent opportunity across all asset classes.
Equity positioning faced a challenging week with significant regional divergence. Long Nikkei 225 exposure was the standout contributor with a 1.95% gain, and DAX longs added modestly. However, long US equity positions detracted across the board, with S&P 500 (-1.47%), Nasdaq 100 (-1.43%), and DJIA (-1.27%) all weighing on performance. The VIX surge created headwinds for net long equity exposure. The international-domestic split presents a positioning challenge – systematic models may be generating conflicting signals between Japanese/European strength and US weakness.
Currency positioning benefited from dollar weakness and yen strength. Long JPY exposure was the standout contributor with a 2.79% gain, the strongest single-currency move of the week. Long CHF and AUD positions also added positively. Short USD positioning, where held, generated returns across most pairs. The reversal of last week’s dollar strength validates longer-term currency trends and rewards trend-following strategies that maintained short-dollar exposure through the prior week’s noise.
Grains positioning continued to generate positive returns for a second consecutive week. Long wheat exposure contributed meaningfully with a 3.59% gain, alongside soybean oil (+3.16%) and oats (+2.98%). Soybean meal and soybeans longs also added. The only detractor was rough rice at -1.87%. The broad-based strength with seven of eight components positive reinforces the value of diversified grain exposure for systematic portfolios.
Energy positioning faced continued but moderating headwinds. Natural gas exposure detracted with a further 5.23% decline, though the impact was far less severe than last week’s 21.41% plunge. Crude oil, heating oil, and gasoline positions also detracted modestly. Ethanol provided a small offset at +1.85%. The reduced selling pressure suggests the worst of the energy reversal may be passing, but the sector remains a drag on portfolio performance.
Soft commodity positioning generated highly varied results depending on exposure. Short cocoa positions, where held, were extremely profitable as the contract crashed 14.30%. However, long coffee and cotton positions contributed positively this week with 3.11% and 1.73% gains respectively. Orange juice’s 15.83% bounce would have benefited any remaining long exposure, though most systematic models likely exited during the prior weeks’ decline. The sector demands careful position management given the extreme volatility in individual contracts.
Bitcoin exposure was a modest detractor at -2.03%, a dramatic improvement from last week’s devastating -16.46% impact. Most trend-following systems would now be flat or short the digital asset, reducing portfolio drag. The deceleration in selling provides relief for systematic strategies, though the trend remains firmly bearish.
Final Reflections – Bonds Rise and Grains Hold as Equities Falter and Risk Sentiment Shifts
The second week of February delivered a clear shift in market character. Risk-off replaced risk-on. Defensive assets led. Cyclical assets lagged. And the trend environment broke lower.
Three observations define the week:
- The risk-off rotation is creating new trend opportunities, but not fast enough. Bonds rallied meaningfully for a fourth consecutive week. The yen surged 2.79%. Gold extended to all-time highs above $5,063. The VIX jumped nearly 10%. These are not random moves — they form a coherent pattern of defensive positioning that systematic trend followers can exploit. But the TTU Barometer's 12-point decline from 55% to 43% tells us that these emerging trends are not replacing broken ones at sufficient pace. The opportunity set is narrowing even as individual opportunities strengthen.
- The trend environment has breached a critical threshold. The fall below 55% into neutral territory is the development that was flagged as the key risk last week. It has now materialised. At 43% with moderately falling momentum, the barometer sits in the zone where trend-following historically faces headwinds — more whipsaw, lower conviction, reduced payoff. The January recovery from 45% to 68% has been entirely erased. Energy breakdowns, soft commodity disarray, weakening US equities, and the sharp meats reversal have collectively overwhelmed the positive contributions from bonds, gold, currencies, and grains.
- Fund performance and trend conditions are diverging — and that divergence demands attention. The SG Trend Index's improvement to +1.09% MTD and +5.85% YTD demonstrates that diversified portfolios are still capturing returns from the rotation. This is the good news. The cautionary note is that positive fund performance against a deteriorating trend backdrop rarely persists. Either the barometer stabilises as new trends in bonds, currencies, and gold mature, or portfolio returns will come under pressure. The next two to three weeks will determine which path prevails.
The SG Trend Index's year-to-date reading of +5.85% provides a cushion, but the margin for error has narrowed considerably. The environment now demands selectivity, disciplined position sizing, and respect for the signal the barometer is sending.
Risk rotates. Trends deteriorate. Discipline becomes the edge.

List of Resources used in the Week in Review
Important Disclaimers
This document is directly solely to Accredited Investors, Qualified Eligible Participants, Qualified Clients and Qualified Purchasers. No investment decision should be made until prospective investors have read the detailed information in the fund offering documents of any manager mentioned in this document. This document is furnished on a confidential basis only for the use of the recipient and only for discussion purposes and is subject to amendment This document is neither advice nor a recommendation to enter into any transaction. This document is not an offer to buy or sell, nor a solicitation of an offer to buy or sell, any security or other financial instrument. This presentation is based on information obtained from sources that TopTradersUnplugged (“TTU”) (“considers to be reliable however, TTU makes no representation as to, and accepts no responsibility or liability for, the accuracy or completeness of the information. TTU has not independently verified third party manager or benchmark information, does not represent it as accurate, true or complete, makes no warranty, express or implied regarding it and shall not be liable for any losses, damages, costs or expenses relating to its adequacy, accuracy, truth, completeness or use.
All projections, valuations, and statistical analyses are provided to assist the recipient in the evaluation of the matters described herein. Such projections, valuations and analyses may be based on subjective assessments and assumptions and may use one among many alternative methodologies that produce different results accordingly, such projections, valuations and statistical analyses should not be viewed as facts and should not be relied upon as an accurate prediction of future events. There is no guarantee that any targeted performance will be achieved Commodity trading involves substantial risk of loss and may not be suitable for everyone
TTU is not and does not purport to be an advisor as to legal, taxation, accounting, financial or regulatory matters in any jurisdiction. The recipient should independently evaluate and judge the matters referred to herein. TTU does not provide advice or recommendations regarding an investor’s decision to allocate to funds or accounts managed by any manager (“or to maintain or sell investments in funds or accounts managed by any manager, and no fiduciary relationship under ERISA is created by the investor investing in funds or accounts managed by any manager, or through any communication between TTU and the investor
In reviewing this document, it should be understood that the past performance results of any asset class, or any investment or trading program set forth herein, are not necessarily indicative of any future results that may be achieved in connection with any transaction. Any persons subscribing for an investment must be able to bear the risks involved and must meet the suitability requirements relating to such investment. Some or all alternative investment programs discussed herein may not be suitable for certain investors This document is directed only to persons having professional experience in matters relating to investments. Any investment or investment activity to which this document relates is available only to such investment professionals. Persons who do not have professional experience in matters relating to investments should not rely upon this document.
This document and its contents are proprietary information of TTU and may not be reproduced or otherwise disseminated in whole or in part without TTU’s prior written consent.
This document contains simulated or hypothetical performance results that have certain inherent limitations AND SHOULD BE VIEWED FOR ILLUSTRATIVE PURPOSES. Unlike the results shown in an actual performance record, these results do not represent actual trading. HYPOTHETICAL PERFORMANCE RESULTS HAVE MANY INHERENT LIMITATIONS, SOME OF WHICH ARE DESCRIBED BELOW. NO REPRESENTATION IS BEING MADE THAT ANY ACCOUNT WILL OR IS LIKELY TO ACHIEVE PROFITS OR LOSSES SIMILAR TO THOSE SHOWN IN FACT, THERE ARE FREQUENTLY SHARP DIFFERENCES BETWEEN HYPOTHETICAL PERFORMANCE RESULTS AND THE ACTUAL RESULTS SUBSEQUENTLY ACHIEVED BY ANY PARTICULAR INVESTMENT ACCOUNT.
ONE OF THE LIMITATIONS OF HYPOTHETICAL PERFORMANCE RESULTS IS THAT THEY ARE GENERALLY PREPARED WITH THE BENEFIT OF HINDSIGHT IN ADDITION, HYPOTHETICAL TRADING DOES NOT INVOLVE FINANCIAL RISK, AND NO HYPOTHETICAL TRADING RECORD CAN COMPLETELY ACCOUNT FOR THE IMPACT OF FINANCIAL RISK IN ACTUAL TRADING FOR EXAMPLE, THE ABILITY TO WITHSTAND LOSSES OR TO ADHERE TO A PARTICULAR TRADING PROGRAM OR OTHER ASSET.
There are numerous other factors related to the markets in general or to the implementation of any specific trading program which cannot be fully accounted for in the preparation of hypothetical performance results and all of which can adversely affect actual trading results. No representation is being made that any investment will or is likely to achieve profits or losses similar to those being shown.
Most Comprehensive Guide to the Best Investment Books of All Time

Most Comprehensive Guide to the Best Investment Books of All Time
Get the most comprehensive guide to over 600 of the BEST investment books, with insights, and learn from some of the wisest and most accomplished investors in the world. A collection of MUST READ books carefully selected for you. Get it now absolutely FREE!
Get Your FREE Guide HERE!