


Trend Following - Week in Review— March 6, 2026

"Energy Erupts as Equity Stress Mounts and Metals Reverse Hard"
This Week in Trend – 6 March 2026
Welcome to This Week in Trend, your weekly view into the evolving structure of global futures markets and the behaviour of systematic trend following. This edition covers conditions through the close of US markets on Friday, 6 March 2026.
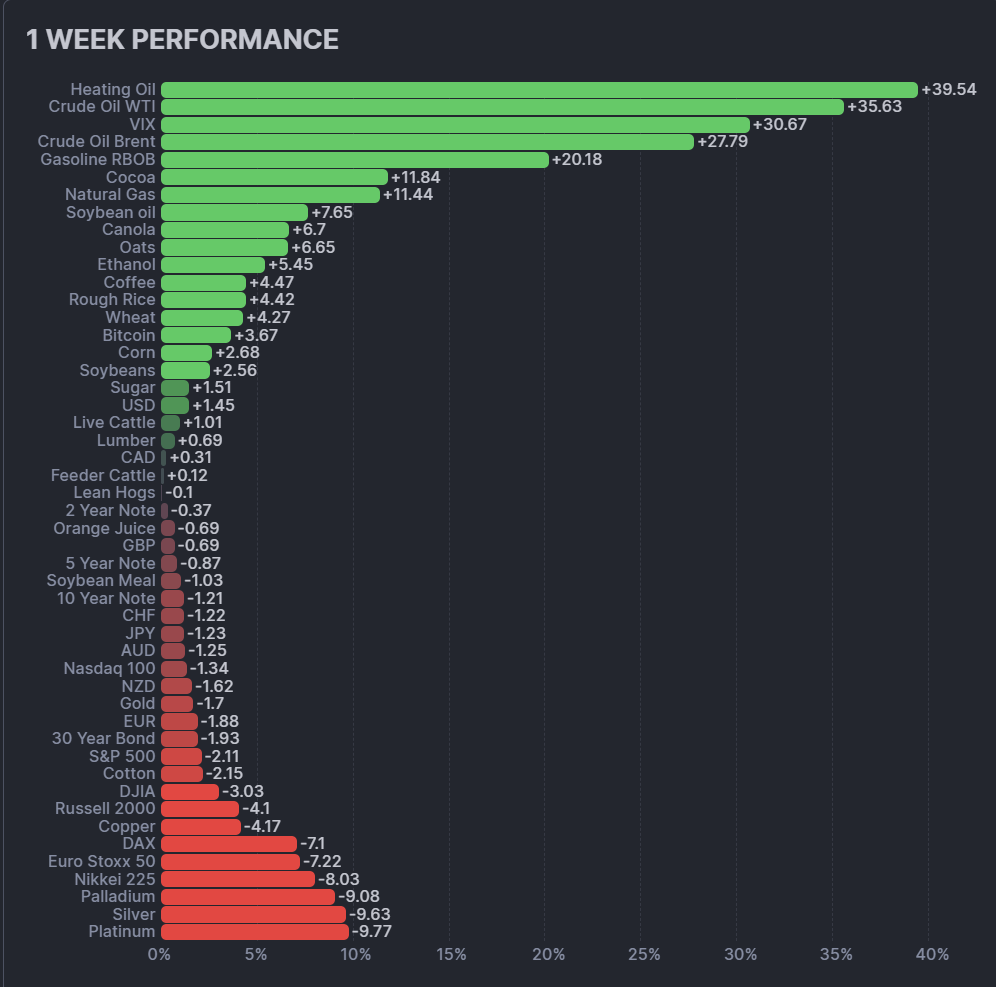
The story of the week was a dramatic sector reversal. Energy exploded higher with heating oil surging 39.54%, the single best performer across all 49 assets, and crude oil WTI soaring 35.63%, the second best. Crude oil Brent advanced 27.42%. Gasoline RBOB jumped 20.18%. Every energy contract finished higher, producing a sector average of +22.61%, by far the strongest sectoral performance of the year. The VIX spiked 30.67%, signalling a significant increase in equity market anxiety. Grains advanced for a fifth consecutive week, led by soybean oil at +7.65% and oats at +6.65%. Soft commodities recovered to positive territory at +2.61%, with cocoa bouncing 11.84% after weeks of collapse.
Metals reversed sharply from last week's leadership. Platinum collapsed 9.77%, the worst performer across all 49 assets. Silver dropped 9.63% and palladium fell 9.08%. Copper declined 4.17% and gold slipped 1.70%. Every metal finished lower, producing a sector average of -6.87%, the starkest single-week reversal of any sector in 2026. Equity indices were broadly negative: the DAX fell 7.10%, Euro Stoxx 50 lost 7.22%, and Nikkei 225 dropped 8.03%. US indices were also in the red, with the Russell 2000 declining 4.10% and the DJIA losing 3.03%. Bonds fell across all four maturities. Currencies were mixed, with the USD gaining 1.45% while most majors declined.
The trend environment showed a meaningful improvement. The TTU Barometer rose from 45% to 55%, reclaiming the critical threshold that separates the neutral zone from "Strong" territory. The 10-day rate of change registered "Rising Weakly," confirming directional improvement with measured rather than explosive momentum. The SG Trend Index declined to -2.19% month-to-date while the year-to-date reading slipped to +6.41%, as the powerful metals gains from last week reversed and equity weakness created headwinds. The dramatic energy surge is likely to have substantially offset equity losses in systematic portfolios, though the net impact will depend heavily on sector positioning.
This was a week of violent sector rotation. Energy dominated. Metals collapsed. Equities fell sharply. But the barometer reclaimed the 55% threshold, returning the environment to "Strong" territory and providing a constructive foundation for the weeks ahead. Systematic managers navigating these abrupt reversals required discipline in both position sizing and risk management.
SG Trend Index Performance
Month to date: -2.19 percent
Year to date: +6.41 percent
Last week:
Month to date: +3.46 percent
Year to date: +8.33 percent
The SG Trend Index declined from +3.46% to -2.19% month-to-date in a single week, a reversal of nearly 5.65 percentage points. The year-to-date reading fell from +8.33% to +6.41%. The March reading reflects the collision of powerful sector trends: the extraordinary energy surge, potentially the week's largest positive contributor, was offset by the brutal metals reversal, broad equity weakness, and bond declines. The net result was negative, erasing all of February's month-to-date progress and then some.
The week illustrates the challenge of violent sector rotation for systematic trend-following strategies. Portfolios that captured last week's metals leadership now faced sharp drawdowns in those same positions. Energy's extraordinary gains, with heating oil surging 39.54% and WTI advancing 35.63%, provided a powerful counterbalance for managers with established long energy exposure. The note is valid: the energy surge is likely to have substantially offset equity losses, making actual manager outcomes highly dependent on sector positioning entering the week.
The year-to-date cushion at +6.41% remains meaningful and reflects the strong foundation built in January and February. The extraordinary start to 2026 provides systematic managers with significant buffer against the kind of whipsaw conditions this week produced. The month-to-date reading of -2.19% means March has started as a corrective month, though the barometer's recovery to 55% provides a more constructive backdrop than the month-to-date figure alone suggests.
TTU Trend Barometer
Current reading: 55 percent
Previous reading: 61 percent
10-day rate of change: Rising Weakly
The TTU Trend Barometer fell from 61% to 55%, retreating from the upper reaches of "Very Strong" territory but landing precisely at the critical 55% threshold that defines the boundary between the neutral zone and a "Strong" environment. The 10-day rate of change registered "Rising Weakly," a constructive signal that reflects the energy complex's powerful contributions generating positive trend momentum even as the barometer's overall level pulled back from last week's heights. The barometer's ability to hold the 55% threshold despite a week of violent sector rotation is a meaningful signal of underlying resilience in trend conditions.
The week's sector rotation explains the barometer's movement clearly. Last week's surge to 61% was driven principally by metals' explosive gains generating strong trend signals across multiple timeframes. This week, those same metals trends reversed sharply, compressing the signals that had pushed the barometer higher. Simultaneously, the energy complex erupted with extraordinary percentage moves, beginning to establish new trend signals across petroleum markets. The net effect: metals trend signals weakened materially while new energy trend signals are forming, and the balance of the two landed the barometer exactly at the 55% line.
At precisely 55% with weakly rising momentum, the barometer sits at a pivotal level. This is not the deeply constructive 61% of last week, but it is a materially better reading than the 52% that the barometer showed before Niels' updated calculation. The 55% threshold is the line that separates neutral from "Strong" territory, and holding it after a week of this magnitude carries genuine significance. For systematic strategies, the environment is characterised as one with sufficient trend breadth to support directional positioning, provided managers apply appropriate risk management given the volatility exhibited across sectors this week.
The barometer's trajectory over recent weeks reveals a pattern of oscillation around key levels: 68% in late January, declining to 43%, recovering to 61%, and now settling at 55% after a week of violent rotation. The 55% landing reflects the energy complex's new directional momentum holding the barometer at the threshold even as metals have corrected. If energy trends sustain their momentum and metals find support, the path back toward 61% and beyond remains open. "Rising Weakly" momentum confirms that conditions are improving, not deteriorating.
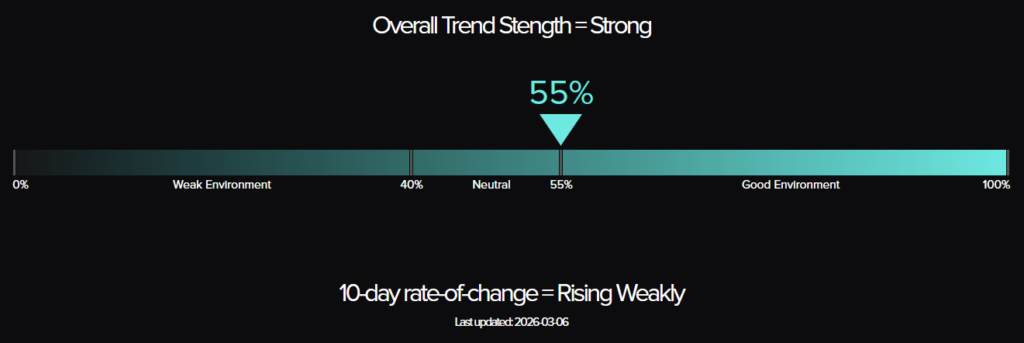
The Top Traders Unplugged (TTU) Trend Barometer is a proprietary tool that measures the percentage of markets with medium to strong trends. Similar to a thermometer, where 0 degrees Celsius equates to freezing, a TTU Trend Barometer reading below 40% indicates a “cold” environment for trend-following, while readings above 55% signal a “hotter,” more favorable trend environment.
Weekly Asset Class Snapshot
| Asset Class | % Move | Prev |
|---|---|---|
| Energy | +22.61% | +1.08% |
| Volatility Index | +30.67% | +2.04% |
| Grains | +4.47% | +1.59% |
| Soft Commodities | +2.61% | -1.12% |
| Crypto | +3.67% | -3.32% |
| Meats | +0.34% | -1.88% |
| Currency | -0.89% | +0.20% |
| Bonds | -1.10% | +0.70% |
| Metals | -6.87% | +5.65% |
| Equity Index | -4.70% | +0.12% |
Source: Finviz.com
Energy (+22.61 percent | prev +1.08 percent)
Energy produced the most explosive single-week sector performance of 2026, with an average gain of +22.61% that dwarfs any prior weekly reading this year. Heating oil led all 49 assets with a 39.54% surge. The weekly chart shows the contract at 3.6508, a dramatic move with outsized volume confirmation. Crude oil WTI soared 35.63% to 81.27, the second-best performer across all markets, with the weekly chart printing a massive bullish candle that reclaims territory from the prior trend. Crude oil Brent advanced 27.42% to 93.67, equally decisive. Gasoline RBOB jumped 20.18% to 2.7577, and natural gas gained 11.44% to 3.1820, reversing its multi-week corrective trend with a strong weekly candle. Ethanol added 5.45% to 1.8875. Every energy contract finished higher.
The breadth and magnitude of these moves are extraordinary and demand context. Percentage moves of 20% to 40% in a single week for major liquid futures contracts reflect supply-side shock dynamics or significant positioning unwinds rather than the steady directional trend accumulation that systematic trend-following thrives on. The weekly charts confirm the explosive nature: heating oil and WTI charts show near-vertical weekly candles that extend dramatically above prior price action. For trend-following systems, the question is not whether these moves are tradeable in retrospect, but whether they represent the beginning of a durable new energy uptrend or a volatility spike that will require careful re-entry discipline.
Bonds (-1.10 percent | prev +0.70 percent)
Bonds reversed last week's recovery, with all four maturities declining. The 30-year bond fell 1.93% to 116.09, with the weekly chart showing a pullback from the recent recovery highs. The 10-year note declined 1.21% to 112.36 and the 5-year note dropped 0.87% to 109.13. The 2-year note was the least affected at -0.37%, ending at 104.23. The weekly charts across the curve show corrective candles that give back a portion of February's gains. The bond market's decline in the context of surging energy prices is consistent with inflationary concerns reasserting themselves: if energy prices remain elevated, the inflation expectations that had been moderating may require reassessment.
For systematic trend-following systems, the bond complex presented conflicting signals this week. The long positions built during February's constructive advance are now facing counter-trend pressure. The broader uptrend from the January lows remains intact on the longer-term charts, but the weekly pattern shows deterioration that will require monitoring. Whether the energy-driven inflationary narrative develops into a sustained bond bear trend or proves transient is a key question for March.
Soft Commodity (+2.61 percent | prev -1.12 percent)
Soft commodities recovered to positive territory this week, with the sector average improving significantly from -1.12% to +2.61%. Cocoa reversed its multi-week collapse with an 11.84% bounce to 3230.8 on the weekly chart, a notable if tentative signal after weeks of relentless decline. The weekly chart shows a strong green candle following a prolonged bear move, though it is too early to determine whether this marks the end of the downtrend or a temporary relief rally within it. Coffee gained 4.47% to 294.15, rebounding from recent weakness. Sugar rose 1.51% to 14.09. Lumber added a modest 0.69% to 587. Cotton fell 2.15% to 64.21, the only decliner in the sector. Orange juice slipped 0.69% to 182.06.
The sector's improvement is encouraging but fragile. Cocoa's bounce is the dominant contributor, and the history of the past several weeks demonstrates that single-week reversal candles in this market have not necessarily marked sustained turning points. The weekly chart at 3230.8 remains far below the highs of 2024 and the collapse from above 10,000 is only partially retraced. For systematic approaches, the soft commodity complex continues to require patient positioning and careful signal interpretation.
Metals (-6.87 percent | prev +5.65 percent)
Metals suffered a dramatic week-over-week reversal, collapsing from last week's sector-leading +5.65% to this week's worst sector performance at -6.87%. Platinum was the worst performer across all 49 assets, declining 9.77% to 2151.8 on the weekly chart. Silver fell 9.63% to 84.70, reversing a significant portion of last week's explosive 12.42% surge. Palladium dropped 9.08% to 1657.0. Copper declined 4.17% to 5.8375. Gold was the most resilient, falling 1.70% to 5181.3, maintaining its weekly chart structure above key support levels.
The reversal is particularly sharp given last week's performance. Silver's round-trip from +12.42% to -9.63% within two weeks, and platinum's move from +9.08% to -9.77%, illustrates the volatility risk embedded in the metals complex even within an uptrend. The weekly charts show significant corrective candles, but the broader trend structures established since early 2026 remain largely intact for gold, which continues to hold near its all-time highs at 5181.3. Silver and platinum charts show the corrective week as a sharp pullback within a longer uptrend rather than a trend reversal, but the magnitude demands monitoring. For systematic trend-following systems, the sharp drawdown in metals positions this week was a significant drag, partially offset by energy gains where exposure existed.
Meats (+0.34 percent | prev -1.88 percent)
Meats produced a marginal positive week, recovering from last week's -1.88% decline. Live cattle edged up 1.01% to 234.33, with the weekly chart showing a modest recovery candle after two weeks of weakness. Feeder cattle added a small 0.12% to 351.48. Lean hogs declined 0.10% to 95.68, ending the week essentially flat. The sector average of +0.34% reflects a lack of strong directional conviction across the meats complex. The weekly charts for cattle show prices attempting to stabilise near recent lows, with the prior uptrend structure still visible on the longer timeframes but under pressure from the recent two-week correction. Lean hogs continue to consolidate in a narrow range. The meats sector is in a transitional phase, offering limited systematic trending opportunities in either direction.
Grains (+4.47 percent | prev +1.59 percent)
Grains posted a fifth consecutive positive week, with the sector average accelerating from +1.59% to +4.47% and participation broadening across the complex. Soybean oil led at +7.65% to 66.47 on the weekly chart, extending its breakout with another strong candle. Canola gained 6.70% to 749.90. Oats jumped 6.65% to 339.96. Ethanol added 5.45% within the energy sector, but broader agricultural strength was evident across the grain complex. Rough rice rose 4.42% to 11.22. Wheat surged 4.27% to 618.25 on the weekly chart, continuing its recovery from the recent lows. Corn added 2.68% to 460.75. Soybeans gained 2.56% to 1201.7. Soybean meal rose a modest 1.03% to 317.48, the smallest gain within the complex but still positive.
The fifth consecutive positive week is a significant development for systematic trend-following strategies. The weekly charts across the grains complex show an increasingly constructive picture: wheat's recovery toward 618.25, corn's steady climb, soybean oil's breakout extension, and canola's strong advance all suggest genuine multi-week trend formation. Seven of eight grain components finished higher. The breadth and consistency of the grains rally makes it one of the most reliable sectoral trends currently active. For systematic managers, the grains sector is delivering the kind of steady, broad-based directional movement that generates strong trend signals across multiple timeframes.
Equity Index (-4.70 percent | prev +0.12 percent)
Equity indices delivered their worst collective week of 2026, with the sector average declining 4.70% and significant losses across both US and European markets. The DAX fell 7.10% on the weekly chart, Euro Stoxx 50 dropped 7.22%, and Nikkei 225 declined 8.03%, reversing last week's leadership comprehensively. US indices were broadly lower: the Russell 2000 fell 4.10%, the DJIA lost 3.03%, the S&P 500 declined 2.11%, and the Nasdaq 100 dropped 1.34%. The VIX spiked 30.67% to 30.67, the most significant single-week volatility expansion since early 2026 and a clear signal of elevated market stress.
The weekly charts across equity indices show significant corrective candles that break below recent consolidation ranges. The DAX and Euro Stoxx 50 charts show the sharpest drops in several months, raising questions about whether the European equity uptrend that had been a reliable trend-following source remains intact. Nikkei 225's 8.03% decline is equally notable given last week's 2.73% recovery. For systematic trend-following systems, the equity complex has shifted from a neutral to a negative signal environment across most indices in a single week. Whether this represents a correction within a broader uptrend or the beginning of a more sustained reversal will determine whether long positions should be reduced or maintained.
Currency (-0.89 percent | prev +0.20 percent)
Currencies reverted to negative territory as dollar strength reasserted itself against most majors. The USD gained 1.45% on the weekly chart, rising to 98.75 and strengthening from its recent downtrend. This dollar recovery is notable: the weekly chart shows the USD index attempting to form a base after its sustained decline through 2025 and early 2026. If the energy surge is sustaining dollar demand through commodity pricing channels, the reversal may have further to run. The EUR fell 1.88% to 1.1623. The NZD declined 1.62%. The AUD dropped 1.25%. JPY fell 1.23% and CHF declined 1.22%, giving back recent safe-haven gains. GBP lost 0.69%. The CAD was the most resilient at +0.31%, with the Canadian dollar benefiting from its commodity linkage to the surging energy complex.
The weekly charts show broad-based dollar recovery and corresponding weakness in the major pairs. The USD chart's attempted base formation at 98.75 contrasts with the trend-following signals that had been pointing to sustained dollar weakness. For systematic managers with long EUR, GBP, and AUD positioning built during the recent USD downtrend, this week's reversal created meaningful headwinds. The currency sector's contribution to systematic portfolios shifted from slightly positive to negative, and the sustainability of the USD recovery will be a key driver of currency positioning in the weeks ahead.
Bitcoin fell 3.67% to 68400 on the weekly chart, extending its downtrend as the cryptocurrency market declined in sympathy with broader risk-off sentiment. The weekly chart continues to show the bear trend that has characterised crypto in 2026, with lower highs and lower lows across each consolidation phase. For trend-following systems, short or flat exposure to Bitcoin remains the appropriate systematic response to continued weakness.
Volatility Index (+30.67 percent | prev +2.04 percent)
The VIX surged 30.67% to approximately 30.67, a dramatic expansion in volatility expectations that reflects the week's broad market stress. The move from approximately 20.55 to 30.67 represents a decisive break above the 25 level that separates normal market volatility from elevated anxiety. The sharp equity declines across all major indices, combined with the energy price explosion and metals collapse, created conditions for a significant spike in implied volatility. At 30.67, the VIX is now in territory that historically corresponds to genuine market uncertainty rather than routine consolidation. For systematic strategies, the VIX's spike is both a signal of portfolio stress and a reminder that managing position sizing through high-volatility environments is critical to long-term performance.
Performance Highlights – This Week’s Market Leaders & Laggards
Source: Finviz.com
Top Market Movers
Top Gainers
1. Heating Oil +39.54 percent
Heating oil surged 39.54% to 3.6508 on the weekly chart, the best single-asset performance across all 49 markets and one of the largest weekly percentage moves in a major futures contract in recent years. The weekly candle is extraordinary in both magnitude and volume, extending far beyond any prior weekly range in the recent chart history. The move reflects acute supply-side dynamics rather than the gradual trend accumulation that systematic strategies prefer, but the scale of the move would have generated significant profits for any strategy with established long exposure. The critical question for trend-following systems is whether this explosive move marks the beginning of a new sustained uptrend or a volatility event that will be partially retraced.
2. Crude Oil WTI +35.63 percent
Crude oil WTI soared 35.63% to 81.27, the second-best performer across all 49 assets. The weekly chart shows a massive recovery candle that reclaims multi-month range territory in a single week. The move aligns with heating oil's surge, reflecting the same energy market dynamics that drove the entire petroleum complex higher. WTI's recovery above 80 is technically significant, representing a level that had been tested and broken to the downside in recent months. The magnitude of the weekly move suggests either a fundamental supply shock or a significant short-covering event, both of which create opportunities and risks for systematic positioning.
3. VIX +30.67 percent
The VIX rose 30.67% to approximately 30.67, making it the third-best performer by percentage across all 49 assets. While VIX gains represent portfolio stress rather than trend-following profits in the traditional sense, the magnitude of the spike confirms the week's risk-off character. A VIX level above 30 has historically corresponded to periods of genuine market dislocation and represents an environment where systematic risk management is paramount.
4. Crude Oil Brent +27.42 percent
Crude oil Brent gained 27.42% to 93.67, reinforcing the extraordinary breadth of the energy surge. With Brent at 93.67 and WTI at 81.27, the spread dynamics confirm that both crude benchmarks participated fully in the week's move. The weekly chart shows Brent reclaiming levels not seen since late 2025, and the scale of the candle would generate strong trend signals across all systematic timeframes. Brent's recovery above 90 is a technically significant development that adds credibility to the energy trend thesis.
Top Losers
1. Platinum -9.77 percent
Platinum suffered the worst performance across all 49 assets, declining 9.77% to 2151.8 on the weekly chart. The reversal from last week's +9.08% gain to this week's -9.77% drop illustrates the volatility embedded in the precious metals complex. The weekly chart shows a sharp corrective candle that gives back more than the prior week's gains in a single session. While the broader uptrend structure visible on the chart since late 2025 is not yet definitively broken, the back-to-back volatility of +9.08% and -9.77% creates significant noise for systematic signal generation.
2. Silver -9.63 percent
Silver declined 9.63% to 84.70, reversing a significant portion of last week's extraordinary 12.42% surge. The weekly chart at 84.70 shows silver pulling back from the highs reached last week, with the corrective candle notable in both size and the reduction in volume relative to last week's surge. The two-week round trip illustrates the difficulty of holding positions in high-volatility trending markets. The longer-term chart structure for silver remains constructive, with prices well above the moving averages established during the 2026 advance, but the week-to-week volatility demands careful risk management.
3. Nikkei 225 -8.03 percent
Nikkei 225 dropped 8.03%, reversing last week's 2.73% recovery with a decisive corrective candle. The Japanese equity market's sharp decline reflects both domestic factors and the global risk-off sentiment that drove the VIX to 30.67. The weekly chart shows the Nikkei breaking below recent consolidation support, raising questions about the broader Asian equity uptrend. For trend-following systems with long Nikkei positioning, the week's move creates a meaningful drawdown from what had been a well-established trend.
4. Euro Stoxx 50 -7.22 percent
Euro Stoxx 50 fell 7.22%, and the DAX dropped 7.10%, making European equities the two worst non-metals performers of the week. The weekly charts for both indices show sharp corrective candles that break below the consolidation ranges that had formed over the prior three weeks. The simultaneous weakness in European and Japanese indices suggests a globally coordinated risk-off episode rather than region-specific factors. For systematic managers who had built long European equity exposure during February's constructive period, this week created significant position-level drawdowns.
Portfolio View - Positioning and Impact
Energy positioning was the dominant systematic contributor this week, and potentially the decisive one for performance. Long heating oil exposure produced a 39.54% gain at the position level. Long WTI crude added 35.63% and Brent contributed 27.42%. Gasoline RBOB added 20.18% and natural gas, reversing its corrective trend, gained 11.44%. Ethanol added 5.45%. For managers with established long petroleum exposure entering the week, the energy complex would have been the single largest positive contributor in months, potentially offsetting the combined drag from metals, equities, bonds, and currencies. The extent of this offset is the defining characteristic of this week's systematic performance, and the observation made before building this report holds: the energy surge likely substantially offset equity losses in portfolios with appropriate exposure.
Metals positioning was the week's primary detractor. Long platinum exposure lost 9.77%, long silver gave back 9.63%, and palladium declined 9.08%. Copper fell 4.17%. Gold, the most resilient, declined only 1.70%, limiting losses on the most widely held metals position. The sector average of -6.87% means metals was the worst-performing sector across all asset classes, a stark reversal from last week's +5.65% leadership. For managers who held the full metals complex entering the week, the drawdown was significant. The net metals contribution was deeply negative.
Equity positioning was broadly negative across all regions. Short or flat positions in equities would have been the correct systematic stance, but most trend-following systems would have maintained some long equity exposure given February's constructive signals. The DAX at -7.10%, Euro Stoxx 50 at -7.22%, Nikkei 225 at -8.03%, Russell 2000 at -4.10%, and DJIA at -3.03% all created meaningful position-level drawdowns. The only partial offset within equities was the VIX spike, which benefits inverse volatility-sold strategies rather than direct trend-following.
Bonds positioning was a modest detractor. Long 30-year bond exposure lost 1.93%, the 10-year note declined 1.21%, and shorter maturities were minimally negative. The bond drawdown was material but manageable relative to the energy gains and metals losses elsewhere in the portfolio.
Grains positioning generated positive returns for a fifth consecutive week. Long soybean oil (+7.65%), canola (+6.70%), and oats (+6.65%) were the primary contributors. Wheat (+4.27%), rough rice (+4.42%), corn (+2.68%), and soybeans (+2.56%) all added modestly. Soybean meal (+1.03%) was the smallest contributor but remained positive. The consistent five-week positive grains contribution underscores the sector's reliability as a portfolio diversifier, delivering steady gains across a complex and volatile week elsewhere in global markets.
Currency positioning was a moderate negative. Long EUR (-1.88%), NZD (-1.62%), AUD (-1.25%), JPY (-1.23%), and CHF (-1.22%) all detracted as the USD recovered. The CAD (+0.31%) was the sole currency with a positive contribution, benefiting from Canada's energy market linkage. Bitcoin declined 3.67%, adding to the negative contribution from the crypto segment. Soft commodity positioning generated mixed results, with cocoa's 11.84% bounce providing relief for any short positions that had been covered, while cotton's -2.15% and orange juice's -0.69% were minor drags.
Final Reflections: Energy Erupts as Equity Stress Mounts and Metals Reverse Hard
The first week of March delivered the most dramatic sector rotation of 2026. Energy erupted to extraordinary heights. Metals reversed sharply from last week's leadership. Equities fell across all major markets and the VIX broke above 30. And yet the TTU Barometer, updated through Friday, held precisely at the 55% threshold, the line that defines a "Strong" trend environment. That resilience, in the context of this week's turbulence, is the most important signal in the report.
Three observations define the week:
1. Energy's extraordinary surge is the defining development, but its trend-following implications are nuanced.
Heating oil's 39.54% surge and WTI's 35.63% advance are the largest weekly percentage moves in major energy futures in recent memory. For managers with established long energy positioning, the gains were exceptional and potentially the difference between a difficult week and a positive one. However, moves of this magnitude in liquid futures markets typically reflect supply shocks, forced short-covering, or positioning unwinds rather than the gradual trend accumulation that generates sustainable systematic signals. The barometer's "Rising Weakly" rather than "Rising Rapidly" reading confirms this nuance: the energy moves are registering as positive trend contributions but not yet as the kind of deeply established multi-week trend momentum that the highest barometer readings require. Systematic managers will need to assess whether energy trends have genuinely reset at higher price levels or whether a portion of this week's move will retrace. Discipline in position sizing is critical.
2. The metals reversal is sharp but does not yet negate the 2026 uptrend, and the barometer's 55% hold confirms this.
Silver's decline from 94.39 to 84.70, platinum's drop to 2151.8, and palladium's 9.08% decline are significant corrective moves. But the barometer holding at 55% despite a full metals complex reversal is a powerful statement about the breadth of trend conditions across the other 44 markets. Gold's relative resilience at 5181.3, holding near its all-time highs, is a critical anchor. The broader metals uptrend that drove February's exceptional performance remains visible on the charts even after this week's correction. The energy surge has partially replaced the trend signals that metals temporarily surrendered. For systematic trend-following systems, the appropriate response is to maintain existing trend positions while monitoring for confirmation signals rather than exiting on a single corrective week. The barometer at 55% supports this patient approach.
3. The barometer holding at 55% through violent rotation is the week's most constructive signal.
The TTU Barometer began the week at 61%, absorbed the full impact of the metals collapse, the equity rout, and the bond decline, and landed at exactly 55%. This is not a coincidence of rounding. It reflects the genuine compensating contribution of energy trends beginning to form alongside the persistent strength in grains, now on their fifth consecutive positive week, and the partial recovery in soft commodities. The environment has not deteriorated despite a week that would have tested many portfolios. It has held its ground at the threshold of "Strong" territory. The SG Trend Index's year-to-date position of +6.41% means 2026 remains a strong year despite the week's setback. The foundation built in January and February provides meaningful buffer. With the barometer at 55% and momentum weakly rising, the environment supports continued systematic positioning with appropriate risk management.
Energy erupts. Metals correct. Equity stress rises. The barometer holds. Discipline remains the edge.

List of Resources used in the Week in Review
Important Disclaimers
This document is directly solely to Accredited Investors, Qualified Eligible Participants, Qualified Clients and Qualified Purchasers. No investment decision should be made until prospective investors have read the detailed information in the fund offering documents of any manager mentioned in this document. This document is furnished on a confidential basis only for the use of the recipient and only for discussion purposes and is subject to amendment This document is neither advice nor a recommendation to enter into any transaction. This document is not an offer to buy or sell, nor a solicitation of an offer to buy or sell, any security or other financial instrument. This presentation is based on information obtained from sources that TopTradersUnplugged (“TTU”) (“considers to be reliable however, TTU makes no representation as to, and accepts no responsibility or liability for, the accuracy or completeness of the information. TTU has not independently verified third party manager or benchmark information, does not represent it as accurate, true or complete, makes no warranty, express or implied regarding it and shall not be liable for any losses, damages, costs or expenses relating to its adequacy, accuracy, truth, completeness or use.
All projections, valuations, and statistical analyses are provided to assist the recipient in the evaluation of the matters described herein. Such projections, valuations and analyses may be based on subjective assessments and assumptions and may use one among many alternative methodologies that produce different results accordingly, such projections, valuations and statistical analyses should not be viewed as facts and should not be relied upon as an accurate prediction of future events. There is no guarantee that any targeted performance will be achieved Commodity trading involves substantial risk of loss and may not be suitable for everyone
TTU is not and does not purport to be an advisor as to legal, taxation, accounting, financial or regulatory matters in any jurisdiction. The recipient should independently evaluate and judge the matters referred to herein. TTU does not provide advice or recommendations regarding an investor’s decision to allocate to funds or accounts managed by any manager (“or to maintain or sell investments in funds or accounts managed by any manager, and no fiduciary relationship under ERISA is created by the investor investing in funds or accounts managed by any manager, or through any communication between TTU and the investor
In reviewing this document, it should be understood that the past performance results of any asset class, or any investment or trading program set forth herein, are not necessarily indicative of any future results that may be achieved in connection with any transaction. Any persons subscribing for an investment must be able to bear the risks involved and must meet the suitability requirements relating to such investment. Some or all alternative investment programs discussed herein may not be suitable for certain investors This document is directed only to persons having professional experience in matters relating to investments. Any investment or investment activity to which this document relates is available only to such investment professionals. Persons who do not have professional experience in matters relating to investments should not rely upon this document.
This document and its contents are proprietary information of TTU and may not be reproduced or otherwise disseminated in whole or in part without TTU’s prior written consent.
This document contains simulated or hypothetical performance results that have certain inherent limitations AND SHOULD BE VIEWED FOR ILLUSTRATIVE PURPOSES. Unlike the results shown in an actual performance record, these results do not represent actual trading. HYPOTHETICAL PERFORMANCE RESULTS HAVE MANY INHERENT LIMITATIONS, SOME OF WHICH ARE DESCRIBED BELOW. NO REPRESENTATION IS BEING MADE THAT ANY ACCOUNT WILL OR IS LIKELY TO ACHIEVE PROFITS OR LOSSES SIMILAR TO THOSE SHOWN IN FACT, THERE ARE FREQUENTLY SHARP DIFFERENCES BETWEEN HYPOTHETICAL PERFORMANCE RESULTS AND THE ACTUAL RESULTS SUBSEQUENTLY ACHIEVED BY ANY PARTICULAR INVESTMENT ACCOUNT.
ONE OF THE LIMITATIONS OF HYPOTHETICAL PERFORMANCE RESULTS IS THAT THEY ARE GENERALLY PREPARED WITH THE BENEFIT OF HINDSIGHT IN ADDITION, HYPOTHETICAL TRADING DOES NOT INVOLVE FINANCIAL RISK, AND NO HYPOTHETICAL TRADING RECORD CAN COMPLETELY ACCOUNT FOR THE IMPACT OF FINANCIAL RISK IN ACTUAL TRADING FOR EXAMPLE, THE ABILITY TO WITHSTAND LOSSES OR TO ADHERE TO A PARTICULAR TRADING PROGRAM OR OTHER ASSET.
There are numerous other factors related to the markets in general or to the implementation of any specific trading program which cannot be fully accounted for in the preparation of hypothetical performance results and all of which can adversely affect actual trading results. No representation is being made that any investment will or is likely to achieve profits or losses similar to those being shown.
Most Comprehensive Guide to the Best Investment Books of All Time

Most Comprehensive Guide to the Best Investment Books of All Time
Get the most comprehensive guide to over 600 of the BEST investment books, with insights, and learn from some of the wisest and most accomplished investors in the world. A collection of MUST READ books carefully selected for you. Get it now absolutely FREE!
Get Your FREE Guide HERE!