


Trend Following - Week in Review— March 13, 2026
"Energy Rules as Metals Retreat and Equities Extend Their Slide"
This Week in Trend – 13 March 2026
Welcome to This Week in Trend, your weekly view into the evolving structure of global futures markets and the behaviour of systematic trend following. This edition covers conditions through the close of US markets on Friday, 13 March 2026.
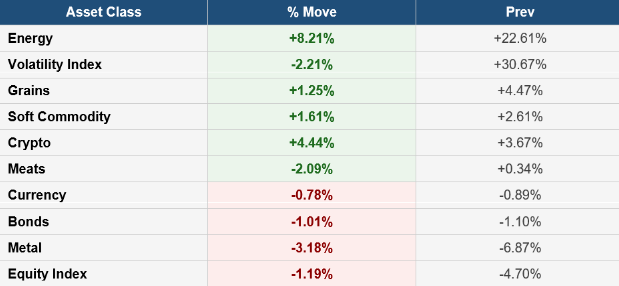
Energy extended its dominance for a second consecutive week. Crude oil Brent led all 49 assets with a gain of 11.27%, followed by heating oil at +10.83% and gasoline RBOB at +10.73%. Crude oil WTI advanced 8.59%. Natural gas declined 1.73% and ethanol slipped 0.66%, but every petroleum contract finished the week higher, delivering a clean sweep across crude and refined products and producing an energy sector average of +8.21%, by far the strongest sector of the week. Orange juice surged 10.57%, the fourth-best performer across all markets. Oats jumped 10.34%, the fifth best. Grains posted a sixth consecutive positive week, with the sector averaging +1.25%. Soft commodities averaged +1.61%, with cotton up 2.57%, cocoa up 2.07%, and sugar rising 1.91%. Bitcoin recovered 4.44%.
Metals extended their retreat from last week. Palladium fell 4.97%, the worst performer across all 49 assets. Platinum declined 4.65% and silver dropped 3.52%. Gold slipped 1.88% and copper lost 0.86%. Every metal finished lower for a second consecutive week, producing a sector average of -3.18%. Equity indices were broadly negative for a second week: the DJIA fell 1.93%, S&P 500 declined 1.59%, Nasdaq 100 dropped 1.11%, Russell 2000 lost 1.80%, and Nikkei 225 declined 1.54%. European indices were mixed, with the DAX falling 0.45% while Euro Stoxx 50 eked out a marginal gain of 0.12%. Bonds were lower across all four maturities. Most currencies fell against a recovering USD.
The trend environment showed a constructive recovery. The TTU Barometer rose from 55% to 57%, holding above the critical 55% threshold and confirming the environment remains in "Strong" territory. The 10-day rate of change registered "Falling Weakly," a note of caution that momentum is easing at the margins even as the overall level holds constructive. The SG Trend Index improved to -1.53% month-to-date while the year-to-date reading sits at +7.13%, a marginal recovery reflecting the contribution of energy gains alongside the continued challenge of negative equity and metals exposure. Energy gains in systematic portfolios likely provided a meaningful counterweight to equity and metals losses, though net outcomes depend on sector weightings.
Energy led for a second straight week. Metals extended their decline. Equities continued lower. But the barometer rose to 57%, holding above the 55% threshold that defines a "Strong" environment. The consistent energy strength is building genuine trend signals, and the barometer's resilience above the threshold is the week's most important signal for systematic managers.
SG Trend Index Performance
Month to date: -1.53 percent
Year to date: +7.13 percent
Last week:
Month to date: -2.19 percent
Year to date: +6.41 percent
The SG Trend Index moved from -2.19% to -1.53% month-to-date, a modest improvement of 0.66 percentage points as energy gains partially offset continuing headwinds from metals and equities. The year-to-date reading of +7.13% represents a small recovery from last week's +6.41%, confirming that energy's second consecutive strong week is contributing positively to systematic performance even as the broader environment remains challenged. March continues to run negative month-to-date, though the trajectory shows tentative stabilisation.
The dynamic this week is an incremental one compared to last week's violent rotation. Energy's sustained strength, with Brent leading at +11.27% and the sector averaging +8.21%, is consolidating into genuine trend signals across petroleum markets. The metals retreat is moderating in magnitude from last week's brutal reversal, but the direction remains consistently negative: palladium down 4.97%, platinum down 4.65%, silver down 3.52%, gold down 1.88%. Systematic portfolios with established long energy and flat or short metals exposure navigated the week relatively well, though continued equity weakness across most indices remains a drag.
The year-to-date reading of +7.13% remains a strong foundation built during January and February. The March month-to-date figure of -1.53% confirms the corrective character of the month so far, though the marginal improvement from last week's -2.19% suggests stabilisation rather than deterioration. The barometer's revised reading of 57% reinforces the SG index's recovery, confirming that energy trends are generating genuine breadth and portfolio contribution in the current environment.
TTU Trend Barometer
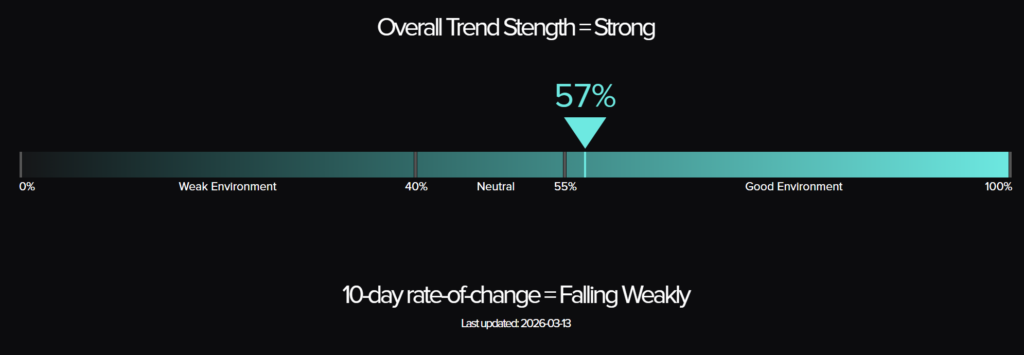
Current reading: 57 percent
Previous reading: 55 percent
10-day rate of change: Falling Weakly
The TTU Trend Barometer rose from 55% to 57%, holding above the critical 55% threshold and confirming that the environment remains in "Strong" territory for a second consecutive week. The 10-day rate of change registered "Falling Weakly," a cautionary note that trend breadth momentum is easing at the margins. Last week the barometer held the 55% line despite violent sector rotation. This week, with the updated reading confirming 57%, the barometer has not only held but marginally extended its position above the threshold that defines a constructive trend environment.
The barometer's resilience above 55% reflects the genuine compensating contribution of energy trends. Two consecutive weeks of extraordinary petroleum gains are generating strong trend signals across multiple timeframes, and those signals are providing the breadth that the metals retreat and equity weakness are eroding. Energy is building: the sector average of +8.21% this week, following last week's +22.61%, is establishing the kind of durable directional momentum that sustains barometer readings above the threshold. Metals are eroding: palladium, platinum, and silver have declined in both of the past two weeks, compressing the signals that drove the barometer higher in February. The net balance has settled at 57%, a reading that reflects genuine trend breadth rather than a marginal hold.
At 57% with weakly falling momentum, the barometer sits just above the 55% threshold in "Strong" territory. The "Falling Weakly" rate of change is a signal worth monitoring: it confirms that trend breadth is not expanding from here and that the barometer could slip back below 55% if energy momentum fades or metals weakness broadens further. But at 57%, the environment is classified as strong, and that classification carries genuine significance for systematic positioning. The appropriate response is continued directional exposure with disciplined risk management, not defensiveness.
The barometer's trajectory over recent weeks shows a pattern of oscillation: 68% in late January, declining to 43%, recovering to 61%, retreating to 55% last week, and now recovering to 57% with the updated reading. The initial reading reflected the raw pressure from metals and equities. The revised 57% reflects the genuine contribution of energy trend signals providing sufficient breadth to hold the environment in strong territory. If energy trends continue to strengthen and metals find support at current levels, the path toward 61% and beyond remains open. "Falling Weakly" momentum means the barometer is not accelerating higher from here, but at 57% the foundation is constructive and systematic positioning remains fully warranted.
The Top Traders Unplugged (TTU) Trend Barometer is a proprietary tool that measures the percentage of markets with medium to strong trends. Similar to a thermometer, where 0 degrees Celsius equates to freezing, a TTU Trend Barometer reading below 40% indicates a “cold” environment for trend-following, while readings above 55% signal a “hotter,” more favorable trend environment.
Weekly Asset Class Snapshot
Source: Finviz.com
Energy (+8.21 percent | prev +22.61 percent)
Energy extended last week's extraordinary breakout, with the sector averaging +8.21% for a second consecutive week of powerful gains. Crude oil Brent led all 49 assets at +11.27%, reaching 103.89 on the weekly chart. Heating oil added 10.83% to 3.9902 and gasoline RBOB advanced 10.73% to 3.0653. Crude oil WTI gained 8.59% to 99.31, pushing through the 99 level with solid volume. Natural gas declined 1.73% to 3.1320, the only energy contract in the red, reversing a portion of last week's gains. Ethanol was essentially flat at -0.66% to 1.8750.
The weekly charts across the energy complex paint a consistently bullish picture. WTI at 99.31 is approaching the technically significant 100 level, and Brent at 103.89 has already cleared it. Heating oil and gasoline RBOB charts both show strong continuation candles building on last week's explosive moves, with prices well above short-term moving averages. Two consecutive weeks of broad-based energy gains are establishing the kind of multi-week trend structure that systematic strategies require. For trend-following systems, the energy sector is now generating strong signals across multiple timeframes. Natural gas remains the outlier: its chart at 3.1320 shows a volatile multi-year pattern of spikes and reversals, and last week's recovery was not sustained this week.
Bonds (-1.01 percent | prev -1.10 percent)
Bonds declined for a second consecutive week, extending the corrective move across the yield curve. The 30-year bond fell 2.12% to 113.75 on the weekly chart, the weakest performer in the complex. The 10-year note dropped 0.92% to 111.48 and the 5-year note declined 0.65% to 108.55. The 2-year note was the most resilient, falling only 0.34% to 103.93. The weekly charts show the bond complex in an established short-term downtrend, with each of the past two weeks printing lower. Elevated energy prices, with WTI approaching 100 and Brent above it, are reinforcing inflationary concerns and keeping pressure on bond prices.
For systematic trend-following systems, a second consecutive week of bond declines is a meaningful signal that the short-term trend in fixed income has shifted. The longer-term weekly charts show the 30-year bond at 113.75 giving back significant ground from its recent highs. The yield curve is steepening as longer maturities lead the decline. Whether the energy complex's sustained strength develops into a durable inflationary trend that keeps bond prices under pressure will be a defining question for portfolio positioning in the weeks ahead.
Soft Commodity (+1.61 percent | prev +2.61 percent)
Soft commodities maintained positive territory for a second consecutive week, though the sector average eased from +2.61% to +1.61%. Orange juice surged 10.57% to 198.45, the fourth-best performer across all 49 assets and the standout mover in the sector. Cotton gained 2.57% to 65.80. Cocoa added 2.07% to 3298.0, extending last week's bounce and showing tentative signs of base formation after its prolonged decline. Sugar rose 1.91% to 14.41 and lumber advanced 2.30% to 598.00. Coffee fell 2.78% to 285.15, the only decliner, continuing its corrective trend on the weekly chart.
Orange juice's 10.57% surge is the dominant story in soft commodities this week. The weekly chart at 198.45 shows a powerful breakout candle extending well above recent consolidation. Cocoa's second consecutive positive week at 3298.0 is building a tentative base structure after the prolonged decline from the 2024 highs: the weekly chart is showing higher lows for the first time in months. Coffee's continued weakness at 285.15 is the sector's drag, with the chart displaying a downtrend that has not yet shown signs of reversal. For systematic strategies, orange juice and the recovering softs are generating nascent positive signals while coffee remains a source of counter-trend pressure.
Metal (-3.18 percent | prev -6.87 percent)
Metals declined for a second consecutive week, though the magnitude of losses moderated from last week's severe reversal. Palladium was the week's worst performer across all 49 assets, falling 4.97% to 1561.0 on the weekly chart. Platinum declined 4.65% to 2024.5 and silver dropped 3.52% to 80.65. Gold fell 1.88% to 5023.1, with the weekly chart showing a corrective candle but maintaining position well above its longer-term moving averages. Copper declined 0.86% to 5.6750.
Two consecutive weeks of metals declines are creating a clear short-term downtrend in the precious metals complex. Palladium at 1561.0 and platinum at 2024.5 are both extending their corrections meaningfully. Silver at 80.65 has now given back a substantial portion of the gains it built over the prior several weeks. Gold remains the most resilient: at 5023.1 it holds above the 5000 level and its weekly chart structure, while corrective, shows a market in a longer-term uptrend that is undergoing a pullback rather than a reversal. Copper at 5.6750 has declined modestly but holds within its broader trading range. For systematic trend-following systems, the sustained metals weakness is compressing profitable long positions built during February's strong advance.
Meats (-2.09 percent | prev +0.34 percent)
Meats reversed their marginal recovery with a negative week across all three contracts. Live cattle fell 1.57% to 230.85 on the weekly chart, continuing the corrective move from recent highs. Feeder cattle declined 2.42% to 343.73, the larger loss of the cattle pair and the worst performer within the meats complex this week. Lean hogs dropped 2.27% to 93.33, extending a downtrend that has now been in place for several weeks. The sector average of -2.09% reflects broad weakness across the complex. The weekly charts for both cattle contracts show continued corrective pressure following the extended uptrend of 2025 and early 2026. Lean hogs' chart at 93.33 shows a deteriorating trend structure with lower highs and lower lows becoming established. For systematic strategies, the meats sector is generating negative signals across all three contracts.
Grains (+1.25 percent | prev +4.47 percent)
Grains extended their positive run to a sixth consecutive week, though the sector average moderated from +4.47% to +1.25% as participation narrowed. Oats led the complex at +10.34% to 374.50, the fifth-best performer across all 49 assets. Soybean meal gained 1.73% to 322.20 and corn added 1.47% to 467.00. Rough rice rose 1.38% to 11.38. Soybeans advanced 2.04% to 1223.7 and soybean oil gained 1.29% to 67.43. Canola added 1.22% to 728.80. Wheat declined 0.49% to 613.25, a modest pullback after last week's strong advance. The sector's positive streak remains intact, though the moderation in the average reflects a rotation of leadership rather than broad deterioration.
A sixth consecutive positive week in grains confirms the sector as one of the most consistent trend-following opportunities currently active. Seven of eight grain contracts finished higher this week. The weekly charts show oats' strong breakout at 374.50, corn's steady climb to 467.00, and soybeans building a recovery structure at 1223.7. Wheat's modest pullback to 613.25 is a pause rather than a reversal given its strong recent advance. The consistency of six straight positive weeks generates robust multi-week trend signals across most grain contracts. For systematic strategies, grains remain a reliable source of positive contribution in an otherwise mixed environment.
Equity Index (-1.19 percent | prev -4.70 percent)
Equity indices extended their decline for a second consecutive week, though losses moderated from last week's severe selloff. The sector average of -1.19% reflects continued broad weakness with some pockets of relative resilience. The DJIA fell 1.93% to 46511 on the weekly chart and the S&P 500 declined 1.59% to 6625.2. The Russell 2000 dropped 1.80% to 2474.4 and the Nasdaq 100 fell 1.11% to 24335. Nikkei 225 declined 1.54% to 53100. Euro Stoxx 50 was the notable outperformer, eking out a marginal gain of +0.12% to 5690.0. The DAX fell 0.45% to 23327. The VIX declined 2.21% to 26.60, a modest easing of volatility following last week's spike to above 30.
The weekly charts across equity indices show two consecutive weeks of corrective candles establishing a clear short-term downtrend in most major markets. The S&P 500 at 6625.2 and the DJIA at 46511 are both sustaining losses that challenge the medium-term uptrend structure. The Russell 2000's continued weakness at 2474.4 is notable as small-cap indices often lead broader market direction. Euro Stoxx 50's marginal green candle at 5690.0 offers a small divergence from the broadly negative picture. The VIX at 26.60 remains elevated by historical standards even after this week's modest decline, confirming that market anxiety persists. For systematic trend-following systems, the equity sector is generating increasingly negative signals across most major indices.
Currency (-0.78 percent | prev -0.89 percent)
Currencies were broadly negative for a second consecutive week, with most major pairs continuing to weaken against the dollar. The USD gained 1.40% to 100.16 on the weekly chart, pushing through the 100 level, a psychologically significant threshold. EUR fell 1.45% to 1.1467. NZD declined 1.86% to 0.5795 and AUD dropped 0.30% to 0.6973. JPY fell 1.17% to 0.6311 and CHF declined 1.75% to 1.2763. GBP lost 1.08% to 1.3220 and CAD fell 1.02% to 0.7319. The dollar's move through 100 is notable on the weekly chart: after an extended downtrend through 2025 and early 2026, the USD index is now building a two-week base at a technically significant level.
The weekly charts across currency pairs show the USD strengthening and most major currencies forming lower lows after two consecutive down weeks. The EUR at 1.1467, GBP at 1.3220, and AUD at 0.6973 are all showing corrective weekly candles. For systematic managers who built long positions in these currencies during the USD's extended downtrend, two consecutive weeks of losses represent a meaningful reversal of recent positive contributions. The USD's break above 100 on the weekly chart is a signal that deserves monitoring: if sustained, it may indicate the dollar's trend has shifted from down to up.
Bitcoin recovered 4.44% to 71495 on the weekly chart, the first positive week in several after the prolonged downtrend. The weekly chart at 71495 shows a reversal candle emerging from oversold territory, though the broader trend structure of lower highs and lower lows established over the past several months remains intact. For trend-following systems, a single week of recovery is insufficient to generate a buy signal after a sustained downtrend: the appropriate systematic response is to monitor for confirmation of a genuine trend change before establishing long exposure.
Volatility Index (-2.21 percent | prev +30.67 percent)
The VIX declined 2.21% to 26.60 this week, a modest easing from last week's spike above 30. At 26.60, implied volatility remains elevated relative to the conditions that prevailed through much of 2025 and early 2026, and the weekly chart shows the VIX consolidating at a high level rather than returning to a low-volatility regime. The marginal decline suggests that equity market anxiety is stabilising rather than intensifying following last week's sharp selloff. For systematic strategies, a VIX above 25 continues to signal an elevated-volatility environment where position sizing discipline and risk management remain priorities.
Performance Highlights – This Week’s Market Leaders & Laggards
Source: Finviz.com
Top Market Movers
Top Gainers
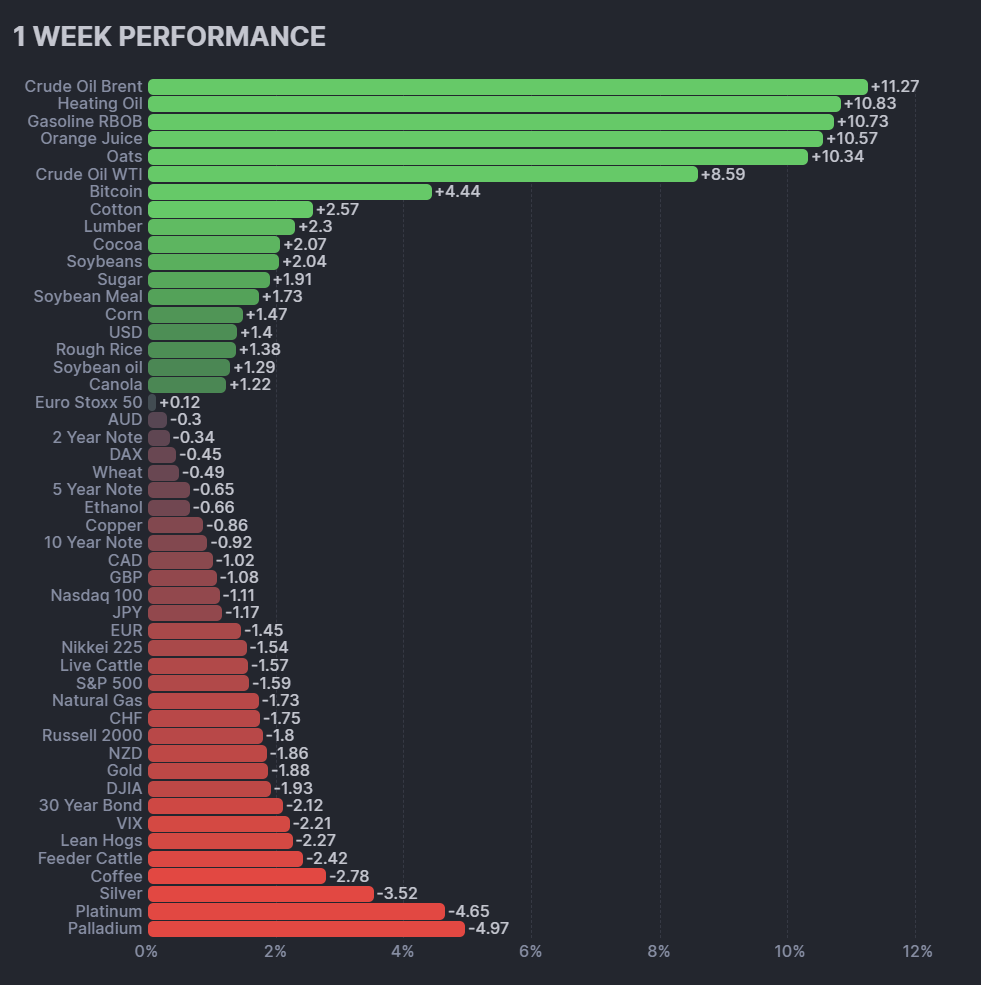
1. Crude Oil Brent +11.27 percent
Crude oil Brent led all 49 assets with an 11.27% gain, reaching 103.89 on the weekly chart. This is the second consecutive week of significant gains for Brent, extending last week's explosive breakout. The weekly chart at 103.89 shows a strong continuation candle building on top of last week's surge, with price now well above all short-term moving averages. Two consecutive weeks of leadership in Brent confirm that the energy trend has genuine momentum rather than the one-week spike characteristics of a volatility event. For systematic strategies, the weekly chart structure is generating strong long trend signals across multiple timeframes.
2. Heating Oil +10.83 percent
Heating oil gained 10.83% to 3.9902, the second-best performer across all 49 assets and its second week among the top performers. The weekly chart at 3.9902 is approaching the psychologically significant 4.0000 level, with strong volume confirming the move. Two consecutive weeks of double-digit percentage gains in heating oil represent an extraordinary run that is establishing strong multi-week trend signals. The contract's correlation with Brent crude confirms that the petroleum complex's strength is broad-based rather than isolated to a single market.
3. Orange Juice +10.57 percent
Orange juice surged 10.57% to 198.45, the standout mover outside the energy complex and the fourth-best performer across all 49 assets. The weekly chart at 198.45 shows a powerful breakout candle pushing toward the 200 level. The move follows a period of consolidation and represents a significant development for the soft commodity trend picture. For systematic strategies, orange juice's sharp weekly gain is generating a positive trend signal that had been absent in this market for several weeks.
4. Oats +10.34 percent
Oats jumped 10.34% to 374.50, the fifth-best performer across all 49 assets and the standout mover in the grains complex. The weekly chart at 374.50 shows a strong breakout candle extending well above recent consolidation. Oats' surge is the latest in six consecutive positive weeks for the grains sector and confirms the breadth of the agricultural trend. For systematic managers, the grains complex continues to deliver consistent positive contributions, with oats' breakout adding momentum to an already well-established sector trend.
Top Losers
1. Palladium -4.97 percent
Palladium fell 4.97% to 1561.0 on the weekly chart, the worst performer across all 49 assets and its second consecutive week of significant losses. The palladium weekly chart shows a clear short-term downtrend establishing with lower highs and lower closes over the past two weeks. From the highs reached in February, palladium has given back a substantial portion of its gains. For systematic strategies, two consecutive weeks of declining prices are generating increasingly negative trend signals.
2. Platinum -4.65 percent
Platinum declined 4.65% to 2024.5, falling below the technically significant 2050 level on the weekly chart. The move continues last week's sharp reversal and confirms that the precious metals complex correction is broad-based rather than concentrated in a single contract. Two consecutive down weeks in platinum are compressing the strong trend signals this market generated through February's advance. The weekly chart structure shows a corrective pattern, with recent highs now acting as resistance.
3. Silver -3.52 percent
Silver dropped 3.52% to 80.65, its second consecutive week of meaningful losses after last week's -9.63% reversal. The weekly chart at 80.65 shows silver consolidating below the highs reached in February, with the corrective structure becoming more defined. Despite the two-week decline, silver remains above its longer-term moving averages, and the broader uptrend established through early 2026 is not yet definitively broken. For systematic strategies, the two-week decline is creating drawdown from profitable long positions but has not yet triggered reversal signals on longer timeframes.
4. Coffee -2.78 percent
Coffee fell 2.78% to 285.15, the fourth-worst performer across all 49 assets and the largest decliner in the soft commodity complex. The weekly chart at 285.15 shows a sustained downtrend that has now been in place for several months, with no sign of reversal emerging. Coffee is the only soft commodity contract moving in the opposite direction to the sector's otherwise positive week, underscoring the divergence between the recovering softs and this market's persistent weakness. For systematic strategies, coffee is generating consistently negative trend signals and represents the clearest short-side opportunity in the soft commodity complex.
Portfolio View - Positioning and Impact
Energy positioning was the primary positive contributor for a second consecutive week. Long crude oil Brent exposure gained 11.27% and long WTI added 8.59%. Heating oil contributed 10.83% and gasoline RBOB added 10.73%. Natural gas was the only detractor within energy at -1.73%. The energy sector average of +8.21% makes petroleum long positions the most reliable positive contributor in the portfolio across the past two weeks. For managers with established long energy exposure, the complex continues to deliver meaningful gains that offset headwinds elsewhere. The sustained nature of the energy move, now spanning two weeks, confirms trend signal quality rather than a one-week volatility spike.
Metals positioning was the week's primary detractor for a second consecutive week. Long palladium exposure lost 4.97%, long platinum gave back 4.65%, and long silver declined 3.52%. Gold fell 1.88% and copper dropped 0.86%. The sector average of -3.18% means the metals complex has detracted in each of the past two weeks. Cumulative losses in metals positions since last week's reversal are significant for managers who maintained full exposure. Gold remains the most resilient position in the sector, holding above 5000 and limiting the drag on the most widely held metals trade.
Equity positioning was negative across most regions for a second consecutive week. The DJIA declined 1.93%, S&P 500 dropped 1.59%, Russell 2000 fell 1.80%, and Nasdaq 100 lost 1.11%. Nikkei 225 declined 1.54%. The DAX fell a modest 0.45% and Euro Stoxx 50 eked out +0.12%, providing marginal relief in European exposure. The VIX declined 2.21% to 26.60, a small positive for any volatility-related exposure. Two consecutive weeks of equity weakness are generating negative trend signals across most major indices. Systematic managers who reduced equity exposure after last week's severe selloff were rewarded; those maintaining full long exposure faced a second week of drawdown.
Bonds positioning was a negative contributor for a second consecutive week. Long 30-year bond exposure lost 2.12%, the 10-year note declined 0.92%, and the 5-year note fell 0.65%. The 2-year note was the most resilient at -0.34%. The sustained bond weakness, with two consecutive down weeks across the yield curve, is consistent with the energy-driven inflationary backdrop keeping rates elevated. Bond positions that had been generating positive returns through February are now in drawdown.
Grains positioning generated positive returns for a sixth consecutive week. Long oats contributed +10.34%, the standout performer in the complex. Soybeans added 2.04%, soybean meal gained 1.73%, and corn contributed 1.47%. Rough rice added 1.38%, soybean oil gained 1.29%, and canola contributed 1.22%. Wheat declined a modest 0.49%, the only detractor. Six consecutive positive weeks in grains makes this sector the most consistent positive contributor in systematic portfolios across 2026, providing steady diversifying returns even as energy and metals generate volatility.
Currency positioning was a negative contributor for a second consecutive week. Long EUR (-1.45%), CHF (-1.75%), GBP (-1.08%), NZD (-1.86%), JPY (-1.17%), AUD (-0.30%), and CAD (-1.02%) all detracted as the USD strengthened to 100.16. The dollar's break above 100 creates a meaningful challenge for managers with long non-dollar exposure built during the USD's prior downtrend. Bitcoin recovered 4.44% to 71495, providing a small positive contribution for any long crypto exposure, though the longer-term chart structure remains in a downtrend. Soft commodity exposure generated a net positive contribution: orange juice's +10.57% was the standout, with cotton +2.57%, cocoa +2.07%, and sugar +1.91% all contributing, partially offset by coffee's -2.78%.
Final Reflections: Energy Rules as Metals Retreat and Equities Extend Their Slide
The second week of March confirmed the directional themes established last week rather than disrupting them. Energy led for a second consecutive week, with the sector averaging +8.21% and Brent crude topping 103. Metals declined for a second consecutive week, extending the reversal from February's highs. Equities fell across most major markets. And the TTU Barometer, updated through Friday, rose from 55% to 57%, holding above the threshold that defines a "Strong" environment and confirming the trend environment remains constructive.
Three observations define the week:
1. Energy's sustained strength is the defining development, and two consecutive weeks of gains confirm trend quality.
Brent crude's 11.27% gain and WTI's 8.59% advance follow last week's explosive moves, producing a two-week cumulative energy surge that is generating genuine trend signals across multiple timeframes. This is no longer a one-week volatility event. Two consecutive weeks of broad gains across petroleum markets, with Brent clearing 103 and WTI approaching 100, represent the kind of sustained directional movement that systematic trend-following strategies are designed to capture. For managers with established long energy exposure entering the week, the complex delivered meaningful positive returns for a second straight week. The natural gas exception at -1.73% is worth monitoring, but the petroleum complex remains the portfolio's dominant positive contributor.
2. The metals retreat is moderating in magnitude but consistent in direction, and two consecutive down weeks are reshaping the trend signal picture.
Palladium at -4.97%, platinum at -4.65%, and silver at -3.52% represent a second week of meaningful losses across the precious metals complex. Gold's relative resilience at -1.88%, holding above 5000, remains the anchor for the sector. The cumulative two-week drawdown in metals positions is significant for managers who maintained full exposure through both weeks. The barometer's resilience at 57% despite two consecutive weeks of metals losses reflects the compensating contribution of energy trends. The strong trend signals that metals generated through February are compressing as the complex corrects, but energy is providing sufficient breadth to hold the barometer above 55%. Whether metals find support and reverse, or extend their decline into a more sustained downtrend, is the central positioning question for the weeks ahead.
3. The barometer at 57% is a strong reading, and its resilience above 55% through two weeks of sector pressure is the week's most important signal.
The TTU Barometer rose from 55% to 57%, holding above the threshold that defines a strong environment and extending its position there for a second consecutive week. This matters. Metals have declined for two weeks. Equities have declined for two weeks. Bonds have declined for two weeks. Currencies have been broadly negative. And yet the barometer, absorbing all of it, has held above 55% and nudged higher. The reason is energy: two consecutive weeks of extraordinary petroleum gains are generating strong trend signals across multiple timeframes, and those signals are providing the breadth that sustains the strong classification. The SG Trend Index's marginal recovery to -1.53% month-to-date from -2.19% confirms that energy is delivering real portfolio contribution. The year-to-date reading of +7.13% means 2026 remains a strong year for systematic managers. The strong environment supports continued systematic positioning with appropriate risk management, and the barometer's resilience is the most constructive signal in the report.
Energy builds. Metals retreat. Equities slide. The barometer holds strong. Discipline and patience remain the edge.

List of Resources used in the Week in Review
Important Disclaimers
This document is directly solely to Accredited Investors, Qualified Eligible Participants, Qualified Clients and Qualified Purchasers. No investment decision should be made until prospective investors have read the detailed information in the fund offering documents of any manager mentioned in this document. This document is furnished on a confidential basis only for the use of the recipient and only for discussion purposes and is subject to amendment This document is neither advice nor a recommendation to enter into any transaction. This document is not an offer to buy or sell, nor a solicitation of an offer to buy or sell, any security or other financial instrument. This presentation is based on information obtained from sources that TopTradersUnplugged (“TTU”) (“considers to be reliable however, TTU makes no representation as to, and accepts no responsibility or liability for, the accuracy or completeness of the information. TTU has not independently verified third party manager or benchmark information, does not represent it as accurate, true or complete, makes no warranty, express or implied regarding it and shall not be liable for any losses, damages, costs or expenses relating to its adequacy, accuracy, truth, completeness or use.
All projections, valuations, and statistical analyses are provided to assist the recipient in the evaluation of the matters described herein. Such projections, valuations and analyses may be based on subjective assessments and assumptions and may use one among many alternative methodologies that produce different results accordingly, such projections, valuations and statistical analyses should not be viewed as facts and should not be relied upon as an accurate prediction of future events. There is no guarantee that any targeted performance will be achieved Commodity trading involves substantial risk of loss and may not be suitable for everyone
TTU is not and does not purport to be an advisor as to legal, taxation, accounting, financial or regulatory matters in any jurisdiction. The recipient should independently evaluate and judge the matters referred to herein. TTU does not provide advice or recommendations regarding an investor’s decision to allocate to funds or accounts managed by any manager (“or to maintain or sell investments in funds or accounts managed by any manager, and no fiduciary relationship under ERISA is created by the investor investing in funds or accounts managed by any manager, or through any communication between TTU and the investor
In reviewing this document, it should be understood that the past performance results of any asset class, or any investment or trading program set forth herein, are not necessarily indicative of any future results that may be achieved in connection with any transaction. Any persons subscribing for an investment must be able to bear the risks involved and must meet the suitability requirements relating to such investment. Some or all alternative investment programs discussed herein may not be suitable for certain investors This document is directed only to persons having professional experience in matters relating to investments. Any investment or investment activity to which this document relates is available only to such investment professionals. Persons who do not have professional experience in matters relating to investments should not rely upon this document.
This document and its contents are proprietary information of TTU and may not be reproduced or otherwise disseminated in whole or in part without TTU’s prior written consent.
This document contains simulated or hypothetical performance results that have certain inherent limitations AND SHOULD BE VIEWED FOR ILLUSTRATIVE PURPOSES. Unlike the results shown in an actual performance record, these results do not represent actual trading. HYPOTHETICAL PERFORMANCE RESULTS HAVE MANY INHERENT LIMITATIONS, SOME OF WHICH ARE DESCRIBED BELOW. NO REPRESENTATION IS BEING MADE THAT ANY ACCOUNT WILL OR IS LIKELY TO ACHIEVE PROFITS OR LOSSES SIMILAR TO THOSE SHOWN IN FACT, THERE ARE FREQUENTLY SHARP DIFFERENCES BETWEEN HYPOTHETICAL PERFORMANCE RESULTS AND THE ACTUAL RESULTS SUBSEQUENTLY ACHIEVED BY ANY PARTICULAR INVESTMENT ACCOUNT.
ONE OF THE LIMITATIONS OF HYPOTHETICAL PERFORMANCE RESULTS IS THAT THEY ARE GENERALLY PREPARED WITH THE BENEFIT OF HINDSIGHT IN ADDITION, HYPOTHETICAL TRADING DOES NOT INVOLVE FINANCIAL RISK, AND NO HYPOTHETICAL TRADING RECORD CAN COMPLETELY ACCOUNT FOR THE IMPACT OF FINANCIAL RISK IN ACTUAL TRADING FOR EXAMPLE, THE ABILITY TO WITHSTAND LOSSES OR TO ADHERE TO A PARTICULAR TRADING PROGRAM OR OTHER ASSET.
There are numerous other factors related to the markets in general or to the implementation of any specific trading program which cannot be fully accounted for in the preparation of hypothetical performance results and all of which can adversely affect actual trading results. No representation is being made that any investment will or is likely to achieve profits or losses similar to those being shown.
Most Comprehensive Guide to the Best Investment Books of All Time

Most Comprehensive Guide to the Best Investment Books of All Time
Get the most comprehensive guide to over 600 of the BEST investment books, with insights, and learn from some of the wisest and most accomplished investors in the world. A collection of MUST READ books carefully selected for you. Get it now absolutely FREE!
Get Your FREE Guide HERE!