


Trend Following - Week in Review— March 27, 2026

"Orange Juice Surges, Meats Lead, and Equities Continue Their Slide"
This Week in Trend – 27 March 2026
Welcome to This Week in Trend, your weekly view into the evolving structure of global futures markets and the behaviour of systematic trend following. This edition covers conditions through the close of US markets on Friday, 27 March 2026.
Orange juice surged 9.32%, the best performer across all 49 assets and a dramatic reversal from last week’s 18.97% crash. Feeder cattle gained 3.88% and live cattle added 2.29%, with the meats sector averaging +2.45% and leading all sectors for the week. Cotton rose 3.19% and soybean oil gained 2.90%. Copper advanced 2.23% and wheat added 1.64%. Crude oil WTI gained 1.44%, and the VIX surged 10.65%, reflecting rising anxiety across equity markets. The Nikkei 225 was one of two equity indices to finish in positive territory, edging up 0.56%.
Bitcoin declined 6.06%, the worst performer of the week. Platinum fell 5.00%, oats dropped 4.60%, and heating oil lost 3.98%, reversing last week’s extraordinary gains. Soybean meal fell 3.87% and the Nasdaq 100 declined 3.21%. Equities were broadly negative: the S&P 500 fell 2.24%, DJIA lost 1.02%, Russell 2000 declined 0.37%, and the DAX dropped 0.39%. Metals were mixed, with gold falling 1.79% and palladium losing 2.71%, while copper and silver advanced. All eight currencies declined against the US dollar, with the AUD falling 1.96% and NZD losing 1.41%.
The trend environment remained constructive. The TTU Barometer rose from 57% to 66%, moving decisively higher into "Strong" territory with a 10-day rate of change of "Rising Moderately," the strongest reading in several weeks. The SG Trend Index stands at -1.94% month-to-date and +6.68% year-to-date. The week’s narrative was one of rotation rather than broad advancement: meats, soft commodities, and copper pushed higher while energy corrected sharply, metals remained mixed, and equities continued their multi-week decline. Breadth improved meaningfully, with the barometer’s jump to 66% confirming that the trend environment is strengthening beneath the surface.
Orange juice reclaimed the top spot with a 9.32% surge. Meats led all sectors. Energy corrected sharply. Equities continued sliding. And the TTU Barometer jumped from 57% to 66%, a decisive move deeper into "Strong" territory with a rising rate of change. The rotation beneath the surface is broadening, the barometer’s acceleration to 66% is the week’s most important signal, and the trend environment is improving even as individual sectors experience sharp reversals.
SG Trend Index Performance
Month to date: -1.94 percent
Year to date: +6.68 percent
Last week:
Month to date: -1.83 percent
Year to date: +6.81 percent
The SG Trend Index moved from -1.83% to -1.94% month-to-date, a further modest decline of 0.11 percentage points as continued equity weakness and mixed metals offset positive contributions from meats, soft commodities, and copper. The year-to-date reading of +6.68% represents a marginal pullback from last week’s +6.81%, confirming that the corrective character of March persists even as the underlying trend environment improves. The month-to-date figure has now deteriorated incrementally for three consecutive weeks, though the pace of deterioration is slowing, a tentative stabilisation signal worth monitoring.
This week’s dynamic is characterised by rotation and partial reversal rather than the violent directional extremes of last week. Meats delivered the strongest sector contribution, with feeder cattle gaining 3.88% and live cattle adding 2.29%, the sector averaging +2.45%. Orange juice’s 9.32% surge drove soft commodity contributions positive despite continued weakness in coffee and cocoa. Copper advanced 2.23%, providing a positive signal within the mixed metals complex. Against these positives, energy reversed sharply: heating oil lost 3.98%, gasoline RBOB fell 1.51%, and natural gas declined 1.27%, with the sector averaging -0.72% after three consecutive weeks of extraordinary gains. Equities continued their multi-week decline across most major indices, and Bitcoin’s 6.06% drop was the week’s single largest negative move. Currencies weakened uniformly against the US dollar, with all eight tracked currencies finishing in the red.
The year-to-date reading of +6.68% remains a solid foundation built during January and February. The March month-to-date figure of -1.94% reflects the corrective character of the month so far, though the incremental pace of deterioration this week was considerably smaller than last week’s metals-driven decline. The barometer’s jump to 66% is the most constructive signal in this report: it confirms that trend breadth is expanding meaningfully even as the SG index continues to drift slightly lower month-to-date. The year-to-date cushion of +6.68% remains substantial, and the barometer’s acceleration to 66% with a rising rate of change supports continued systematic positioning with disciplined risk management as March closes.
TTU Trend Barometer
Current reading: 66 percent
Previous reading: 57 percent
10-day rate of change: Rising Moderately
The TTU Trend Barometer rose from 57% to 66%, a meaningful advance that moves the reading decisively deeper into "Strong" territory and registers a 10-day rate of change of "Rising Moderately." This is a significant acceleration from last week’s "Rising Weakly" rate of change and the strongest barometer momentum reading in several weeks. The jump of nine percentage points in a single week confirms that trend breadth is expanding rapidly across the 49-asset universe, not merely holding at prior levels. The barometer has now traced a clear recovery arc: from its February low of 43%, rising to 61%, pulling back to 55%, stabilising at 57%, and now accelerating to 66%, a pattern that reflects a trend environment building genuine participation across multiple sectors and timeframes.
The barometer’s jump to 66% reflects a broadening of trend participation that goes beyond any single sector. Meats are delivering strong and consistent signals: feeder cattle gained 3.88% to 360.13 and live cattle added 2.29% to 238.83, extending multi-week uptrends in both contracts. Orange juice’s 9.32% recovery to 173.55 is restoring a positive signal in soft commodities following last week’s violent crash. Copper’s 2.23% advance to 6.4615 contributes a positive signal within metals. Wheat gained 1.64%, soybean oil added 2.90%, and ethanol edged higher. On the equity side, the continued decline across most major indices and the VIX’s 10.65% surge to 28.30 are contributing negative signals, as are the uniform currency weakness and Bitcoin’s 6.06% drop. But the number of markets generating positive trend signals has expanded meaningfully this week, and the barometer’s move to 66% is the direct expression of that expansion.
At 66% with a "Rising Moderately" rate of change, the barometer is now well clear of the 55% threshold and building momentum. The acceleration from 57% to 66% in a single week, combined with a strengthening rate of change, is a more important signal than the headline number alone. It confirms that trend breadth is not simply recovering but actively expanding, with an increasing number of markets generating medium to strong trends across the systematic universe. The critical observation is that this improvement arrived in a week when energy, which had been the dominant breadth driver for three consecutive weeks, corrected sharply. Meats, soft commodities, and copper stepped in to fill the breadth contribution, demonstrating that the trend environment is no longer dependent on a single sector for its strength. The environment is classified as strong, and at 66% the classification is now comfortably above the threshold with genuine momentum behind it.
The barometer’s trajectory now tells a clear story: from 43% in February, recovering to 61%, pulling back to 55% and 57%, and now accelerating to 66% with a "Rising Moderately" rate of change. This is a trend environment that has absorbed violent sector rotation, a historic metals collapse, and three consecutive weeks of equity decline without breaking, and is now building genuine breadth across multiple sectors simultaneously. If meats continue their multi-week uptrend, soft commodities recover further, and copper extends its advance, the path toward 70% and beyond is open. The "Rising Moderately" momentum at 66% is a high-conviction signal that conditions are improving, and the broadening of breadth beyond energy reduces the fragility of the prior weeks’ readings. Systematic positioning is fully warranted, and the barometer’s acceleration this week provides additional confidence in that conclusion.
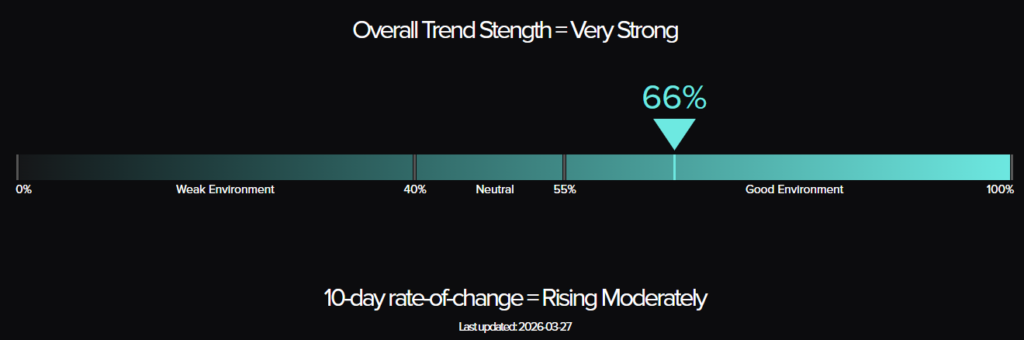
The Top Traders Unplugged (TTU) Trend Barometer is a proprietary tool that measures the percentage of markets with medium to strong trends. Similar to a thermometer, where 0 degrees Celsius equates to freezing, a TTU Trend Barometer reading below 40% indicates a “cold” environment for trend-following, while readings above 55% signal a “hotter,” more favorable trend environment.
Weekly Asset Class Snapshot
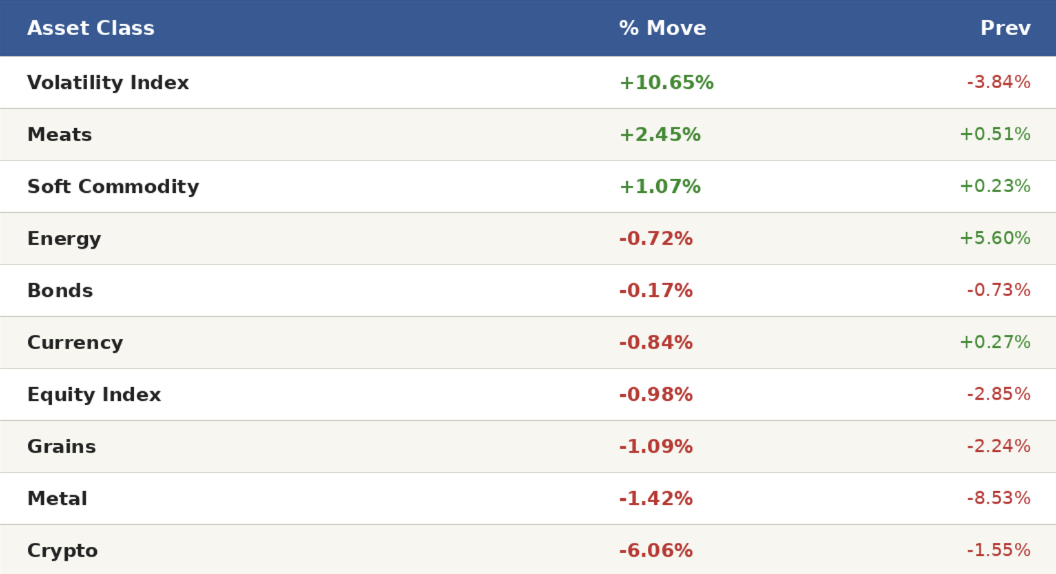
Source: Finviz.com
Energy (-0.72 percent | prev +5.60 percent)
Energy reversed course this week after three consecutive weeks of extraordinary gains, with the sector averaging -0.72% as the petroleum complex gave back a portion of its prior advance. Heating oil led the declines, falling 3.98% to 4.3209 on the weekly chart. Gasoline RBOB dropped 1.51% to 3.2253 and natural gas declined 1.27% to 3.0350. Crude oil WTI bucked the trend with a gain of 1.44% to 101.18, and crude oil Brent also advanced, gaining 0.34% to 114.57. Ethanol edged up 0.65% to 1.9425. The week produced a sharply bifurcated result within the sector: crude benchmarks held their ground while refined products and natural gas corrected.
The weekly charts across the energy complex tell a story of consolidation within an intact uptrend rather than reversal. Crude oil Brent at 114.57 is at its highest level in over a year, with the weekly chart showing a fourth consecutive green candle and an extending breakout structure. WTI at 101.18 has now cleared and held the psychologically significant 100 level, the weekly candle constructive and pointing toward continuation. Heating oil at 4.3209, despite this week’s 3.98% decline, remains well above its moving averages and the pullback candle is modest relative to the prior three weeks of gains. Gasoline RBOB at 3.2253 is consolidating within its uptrend. For systematic trend-following systems, one week of modest energy weakness after three weeks of powerful gains is normal consolidation, not a trend break. The crude oil signals remain among the strongest in the portfolio, and the energy sector’s positive trend structure is intact across all contracts except natural gas, which continues to display a choppy, trendless chart at 3.0350.
Bonds (-0.17 percent | prev -0.73 percent)
Bonds were marginally negative for a fourth consecutive week, though losses were the most contained in that stretch. The 30-year bond fell 0.19% to 112.41 on the weekly chart. The 10-year note was essentially flat, declining just 0.02% to 110.19. The 5-year note slipped 0.17% to 107.63, and the 2-year note also fell 0.17% to 103.52. The near-uniform modest losses across the yield curve suggest that the prior weeks’ bond weakness has found a tentative equilibrium, with neither the inflationary pressure from energy nor the flight-to-quality bid from equity weakness able to dominate the direction this week.
For systematic trend-following systems, four consecutive weeks of bond declines have established a clear negative bias across the yield curve, but the increasingly shallow losses suggest the downtrend is losing momentum. The 30-year bond at 112.41 remains the weakest contract on a cumulative basis over the past four weeks. The 10-year note at 110.19 is essentially flat this week, its weekly candle indecisive and providing no new directional signal. The competing forces of crude oil Brent at 114.57, which exerts upward pressure on yields, and the VIX’s spike to 28.30, which typically generates flight-to-quality bond buying, appear to be offsetting each other this week. The weekly chart still shows a short-term downtrend in bonds, but the deceleration in losses is a development worth monitoring.
Soft Commodity (+1.07 percent | prev +0.23 percent)
Soft commodities improved to a positive week, with the sector averaging +1.07% and demonstrating continued internal divergence. Orange juice surged 9.32% to 173.55 on the weekly chart, the best performer across all 49 assets and a dramatic reversal following last week’s 18.97% crash. Cotton rose 3.19% to 69.47, the strongest chart in the soft commodity complex after orange juice. Sugar added 0.38% to 15.75, maintaining its recovery. Lumber declined 2.13% to 594.00, a pullback after recent gains. Coffee fell 2.60% to 301.05, reversing a portion of last week’s 8.63% surge. Cocoa declined 2.76% to 3161.00, extending its corrective drift. The sector average of +1.07% improves on last week’s +0.23%, driven almost entirely by orange juice’s violent recovery.
Orange juice’s 9.32% surge to 173.55 is the dominant development in soft commodities this week and raises an important question for systematic strategies: after a 9.32% crash last week and a 9.32% recovery this week, the weekly chart is showing extreme two-sided volatility that is highly disruptive for trend signals. At 173.55, the price has partially recovered last week’s collapse but remains well below the levels that preceded it. The weekly chart structure is confused, and the appropriate systematic response is caution rather than commitment. Cotton at 69.47 is the more constructive chart in the complex: the weekly candle shows a continuation of the prior recovery, with price building on recent gains in a more orderly fashion. Coffee at 301.05 is pulling back from last week’s powerful reversal candle, a normal consolidation that does not negate the potential change-of-character signal from last week. Cocoa at 3161.00 continues to make lower lows on the weekly chart, its downtrend among the most consistently negative in the soft commodity complex. For systematic strategies, cotton and the early stages of the coffee recovery are the most actionable signals in the sector.
Metal (-1.42 percent | prev -8.53 percent)
Metals were mixed this week, the sector averaging -1.42% as the complex continued to stabilise following last week’s historic collapse. Copper was the standout, gaining 2.23% to 6.4615 on the weekly chart, the strongest performer in the metals complex and one of the week’s more constructive signals. Silver advanced 0.19% to 69.77, a modest positive after last week’s 14.36% crash. Gold declined 1.79% to 4489.70, a relatively contained loss that suggests the violent selling of last week may be decelerating. Palladium fell 2.71% to 1384.50 and platinum dropped 5.00% to 1848.30, the two weakest contracts in the complex and extending their established downtrends.
The metals complex is showing meaningful internal differentiation this week. Copper at 6.4615 is posting a constructive weekly candle that partially reverses last week’s sharp decline and reasserts the broader uptrend structure that had been building through early 2026. The weekly chart shows price recovering above key near-term support, and the 2.23% gain is a meaningful positive signal for systematic long positions in this market. Silver at 69.77 is essentially flat after last week’s catastrophic decline: the modest positive candle provides no clear directional signal either way, and the weekly chart remains in a damaged short-term structure following two weeks of sharp losses from the highs. Gold at 4489.70 is declining modestly and its weekly chart, while showing continued deterioration from the highs, is decelerating in its rate of fall. The most important observation across the complex is the contrast between copper’s constructive recovery and the continued weakness in platinum at 1848.30 and palladium at 1384.50, both of which are printing lower lows and confirming established downtrends. For systematic strategies, copper is generating renewed positive signals while platinum and palladium remain sources of negative pressure.
Meats (+2.45 percent | prev +0.51 percent)
Meats delivered the strongest sector performance of the week, averaging +2.45% and leading all ten sectors for the first time in recent weeks. Feeder cattle gained 3.88% to 360.13 on the weekly chart, the third-best performer across all 49 assets and extending a clear multi-week uptrend. Live cattle added 2.29% to 238.83, consolidating its own uptrend and printing a second consecutive positive week. Lean hogs gained 1.19% to 105.98, reversing recent weakness and adding a third positive contributor to the sector. All three meats contracts finished in the green, the first uniformly positive week for the sector in the current data set.
The weekly charts across all three meats contracts are showing constructive structures that are generating genuine positive signals for systematic trend-following systems. Feeder cattle at 360.13 is extending a clearly defined uptrend on the weekly chart, with price making higher highs and the current weekly candle continuing the pattern. The 3.88% gain is the third meaningful positive week in recent history for this contract, and the trend structure is one of the most clearly defined in the entire 49-asset universe. Live cattle at 238.83 is also trending positively on the weekly chart, the second consecutive week of gains building on the recovery structure. Lean hogs at 105.98, while showing a more volatile chart than the cattle pair, is reversing its recent negative sequence with a constructive weekly candle. For systematic strategies, feeder cattle is generating the highest-conviction long signal in the meats complex and ranks among the best trend signals in the full portfolio this week. The sector’s uniform positive performance confirms that the barometer’s improvement to 66% has genuine breadth behind it.
Grains (-1.09 percent | prev -2.24 percent)
Grains were broadly negative for a second consecutive week, the sector averaging -1.09% though the losses were more contained than last week’s -2.24%. Soybean meal led the decline, falling 3.87% to 315.00 on the weekly chart, the sector’s weakest performer. Oats dropped a further 4.60% to 341.75, extending the sharp reversal from recent highs. Canola fell 0.83% to 720.80 and corn slipped 0.75% to 461.75. Soybeans declined 0.17% to 1159.50. On the positive side, soybean oil gained 2.90% to 67.22, wheat advanced 1.64% to 605.75, and rough rice edged up a modest 0.05% to 11.23. The sector produced a mixed picture, with five contracts in the red and three in the green.
The grains complex is showing a sector in transition after its extended positive run ended two weeks ago. Soybean oil at 67.22 is the most constructive chart in the sector, its 2.90% gain this week building on a recovery structure that is generating positive signals on shorter trend timeframes. Wheat at 605.75 has bounced from last week’s decline, the weekly candle constructive and suggesting the contract may be re-establishing its prior uptrend. Oats at 341.75, however, continues to be the most volatile and unreliable chart in the complex: the two consecutive weeks of sharp decline following the prior spike are producing a high-volatility pattern that is difficult for systematic systems to trade cleanly. Soybean meal at 315.00 and soybeans at 1159.50 are drifting lower with no clear reversal signal on the weekly chart. For systematic strategies, soybean oil and wheat are the most actionable positive signals in the grains sector, while oats and soybean meal warrant caution given their recent volatility and directional confusion.
Equity Index (-0.98 percent | prev -2.85 percent)
Equity indices extended their multi-week decline, with the sector averaging -0.98%, a more contained loss than last week’s -2.85% but confirming the continuation of the established downtrend. The Nasdaq 100 led the decline, falling 3.21% to 23254.30 on the weekly chart. The S&P 500 dropped 2.24% to 6398.00 and the DJIA fell 1.02% to 45310.00. The Russell 2000 declined 0.37% to 2456.00. The DAX slipped 0.39% to 22247.00. Two markets finished in positive territory: the Euro Stoxx 50 edged up 0.04% to 5382.00 and the Nikkei 225 gained 0.56% to 51230.00. The VIX surged 10.65% to 28.30, signalling a meaningful increase in market anxiety and confirming the equity weakness.
The weekly charts across equity indices show a fourth consecutive week of corrective pressure establishing a clearly defined short-term downtrend across most major markets. The Nasdaq 100 at 23254.30 is showing the most accelerated decline of the major US indices, its weekly chart printing a significant bearish candle that extends the established downtrend. The S&P 500 at 6398.00 remains under meaningful selling pressure, four consecutive weeks of declining prices generating increasingly strong negative signals for systematic strategies. The DJIA at 45310.00 is in a similar pattern. The VIX at 28.30, up sharply from last week’s 25.20 and from 18.03 in late February, confirms that equity market anxiety is building rather than receding. The Nikkei 225 at 51230.00 is notable as the strongest major index this week, its modest +0.56% gain diverging from the weakness in US and European markets. For systematic trend-following systems, four consecutive weeks of broad equity declines are generating strong negative signals across most major indices, and the VIX’s surge to 28.30 confirms that the environment does not favour long equity positioning.
Currency (-0.84 percent | prev +0.27 percent)
Currencies were uniformly negative this week, the sector reversing last week’s modest recovery and averaging -0.84% as the US dollar reasserted strength across all eight tracked pairs. The AUD led the decline, falling 1.96% to 0.6870 on the weekly chart. NZD dropped 1.41% to 0.5762 and CHF declined 1.30% to 1.2621. CAD fell 1.18% to 0.7222 and JPY lost 0.63% to 0.6281. GBP declined 0.42% to 1.3259 and EUR fell 0.34% to 1.1551. The USD gained 0.53% to 100.05, extending its recovery from recent lows and reinforcing the dollar’s short-term positive trend.
The weekly charts across currency pairs show a USD that is re-establishing its short-term positive trend after last week’s pause. The AUD at 0.6870 and NZD at 0.5762 are the weakest charts in the complex, both printing lower lows on the weekly chart and extending established downtrends against the dollar. CHF at 1.2621 is declining from recent highs and the weekly candle is bearish. The EUR at 1.1551 is pulling back within what remains a medium-term uptrend structure on the weekly chart, but the short-term momentum is clearly negative. GBP at 1.3259 is showing a similar pattern of near-term weakness within a longer-term recovery. For systematic strategies, the uniform currency weakness reflects a broadly positive USD environment this week, and long USD or short non-dollar positions are being rewarded. The JPY at 0.6281 continues to consolidate in a range, its chart showing neither a clearly established uptrend nor downtrend at current levels.
Volatility Index (+10.65 percent | prev -3.84 percent)
The VIX surged 10.65% to 28.30 this week, the best performer across all 49 assets and a significant signal about the state of equity market anxiety. The weekly chart at 28.30 shows the VIX extending its recovery from the low-volatility regime of late 2025 and early 2026, with price now comfortably above the 25 level that had provided resistance in prior weeks. The VIX has now risen from approximately 18 in late February to 28.30 today, a 57% increase in implied volatility over five weeks that confirms a fundamental shift in equity market character. For systematic strategies, a VIX at 28.30 and rising signals an elevated-volatility environment where equity trends, when they develop, can be powerful but where position sizing discipline is essential. The VIX’s continued climb is consistent with the multi-week equity downtrend and reinforces the negative signals generated across most major equity indices.
Performance Highlights – This Week’s Market Leaders & Laggards
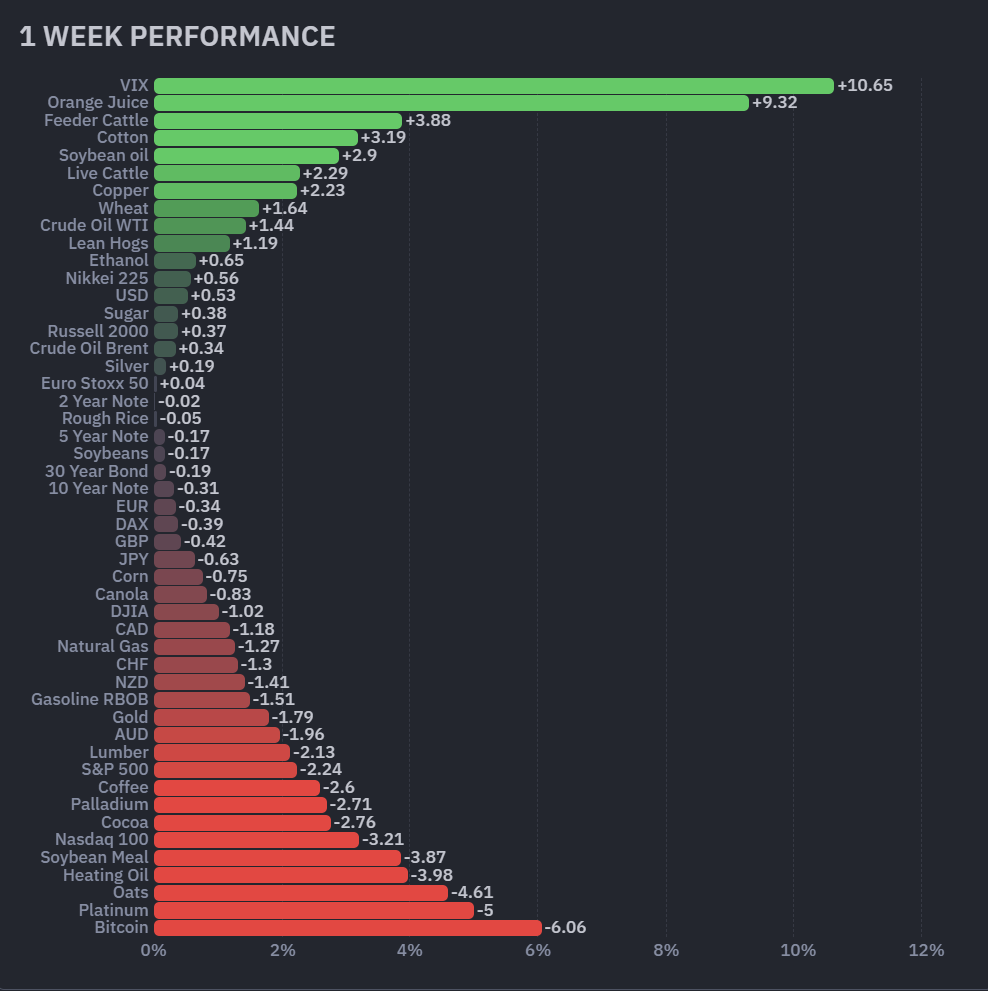
Source: Finviz.com
Top Market Movers
Top Gainers
1. VIX +10.65 percent
The VIX surged 10.65% to 28.30 this week, the best performer across all 49 assets and a powerful signal about the state of equity market sentiment. The weekly chart at 28.30 shows the VIX extending its multi-week recovery from the low-volatility regime of early 2026, with each successive week reinforcing the broader trend of rising implied volatility. From approximately 18 in late February, the VIX has now climbed more than 57% in five weeks. For systematic strategies, a rising VIX in a trend-following portfolio is a double-edged signal: it confirms the negative equity trend and validates short or flat equity positioning, but it also signals elevated volatility across the broader market that requires disciplined position sizing. The VIX’s 10.65% gain this week is the largest single-week advance across all 49 assets and reflects a genuine shift in market character rather than a one-session spike.
2. Orange Juice +9.32 percent
Orange juice surged 9.32% to 173.55 on the weekly chart, the second-best performer across all 49 assets and a dramatic reversal from last week’s 18.97% crash. The chart at 173.55 shows a powerful recovery candle that partially retraces last week’s devastating selloff, but the two-week pattern of extreme volatility in both directions is creating a structurally confused picture for systematic strategies. At 173.55, price remains well below the levels that preceded last week’s collapse, and the weekly chart shows a market oscillating violently rather than trending cleanly. For systematic managers, the appropriate response is caution: the magnitude of last week’s crash followed by this week’s recovery generates conflicting signals on most standard trend timeframes, and the extreme two-week volatility is not the profile of a cleanly trending market.
3. Feeder Cattle +3.88 percent
Feeder cattle gained 3.88% to 360.13 on the weekly chart, the third-best performer across all 49 assets and the cleanest trending chart in this week’s top gainers. Unlike orange juice and the VIX, which reflect volatility events, feeder cattle’s 3.88% gain is the continuation of a methodical, multi-week uptrend that is exactly the kind of price action systematic trend-following strategies are designed to capture. The weekly chart at 360.13 shows a series of higher highs and higher closes over recent weeks, with each candle reinforcing the prior directional signal. For systematic managers, feeder cattle is generating one of the highest-conviction long signals in the entire 49-asset universe this week: the trend is clear, the duration is meaningful, and the weekly chart structure provides strong technical confirmation. The meats sector’s leadership this week, anchored by feeder cattle, is the most constructive sector development in the report.
4. Cotton +3.19 percent
Cotton gained 3.19% to 69.47 on the weekly chart, the fourth-best performer across all 49 assets and a constructive continuation of the soft commodity complex’s recovery. The weekly chart at 69.47 shows cotton building on recent gains with a solid positive candle, the price action orderly and directional rather than the volatile spike-and-reversal pattern seen in orange juice. For systematic trend-following strategies, cotton at 69.47 is showing a more reliable uptrend structure than most of its soft commodity peers, with the weekly chart demonstrating consistent progress rather than extreme oscillation. The 3.19% gain adds to a pattern of constructive weekly closes that is beginning to generate meaningful positive trend signals on multiple timeframes. Cotton is among the more dependable sources of positive signal in the soft commodity sector and a meaningful contributor to the barometer’s improvement to 66%.
Top Losers
1. Bitcoin -6.06 percent
Bitcoin declined 6.06% to 66180.00 on the weekly chart, the worst performer across all 49 assets this week and a significant continuation of the established downtrend. The weekly chart at 66180.00 shows a meaningful bearish candle extending the pattern of lower lows that has characterised Bitcoin’s price action in recent months. From the highs of earlier in 2026, Bitcoin has now declined substantially, and the weekly chart structure of lower highs and lower closes is generating clear negative signals for systematic strategies with crypto exposure. The 6.06% decline this week is the largest single-week loss in the current dataset and confirms that selling pressure in Bitcoin remains meaningful. For systematic managers with long crypto exposure, the weekly chart provides no technical basis for expecting a reversal at current levels.
2. Platinum -5.00 percent
Platinum fell 5.00% to 1848.30 on the weekly chart, the second-worst performer across all 49 assets and an extension of the established downtrend in the precious metals complex. The weekly chart at 1848.30 shows platinum printing a significant bearish candle that continues a pattern of lower lows across multiple weeks. Unlike copper, which recovered this week, platinum is showing no sign of stabilisation or reversal, and the weekly chart structure is clearly negative. The 5.00% decline follows meaningful losses in prior weeks and confirms that platinum is one of the weaker charts across all 49 assets. For systematic strategies, platinum is generating clear short or flat signals, and the absence of any positive weekly candle in recent weeks means there is no technical basis for expecting near-term recovery.
3. Oats -4.60 percent
Oats dropped 4.60% to 341.75 on the weekly chart, the third-worst performer across all 49 assets and a continuation of the sharp reversal from the extreme highs reached in prior weeks. The weekly chart at 341.75 is showing a volatile structure of large swings in both directions, a pattern that is highly disruptive for systematic trend-following systems. After a sharp spike to elevated levels, oats have now given back a meaningful portion of those gains across two consecutive negative weeks, and the weekly chart provides no clean directional signal in either direction. For systematic strategies, the extreme two-way volatility in oats is generating conflicting signals across different timeframes, and the appropriate response is reduced position sizing or avoidance until a more consistent trend structure re-establishes itself.
4. Heating Oil -3.98 percent
Heating oil fell 3.98% to 4.3209 on the weekly chart, the fourth-worst performer across all 49 assets and a meaningful pullback after three consecutive weeks of extraordinary gains. The weekly chart at 4.3209 shows a bearish candle that interrupts the prior uptrend, but the context matters: heating oil has surged dramatically over the prior three weeks, and a single week of 3.98% losses within that context represents a consolidation rather than a reversal. At 4.3209, heating oil remains well above its medium-term moving averages, and the broader uptrend structure established over the past month remains intact. For systematic strategies, a single week of modest losses after three weeks of powerful gains does not generate a reversal signal. The crude oil benchmarks’ continued advance this week confirms that the underlying energy trend is not broken, and heating oil’s pullback is more consistent with normal trend consolidation than a change in direction.
Portfolio View - Positioning and Impact
Meats positioning was the week’s primary positive contributor. Long feeder cattle exposure gained 3.88%, long live cattle added 2.29%, and long lean hogs contributed 1.19%. The sector average of +2.45% confirms that meats long positions are now generating meaningful and consistent positive contributions across multiple weeks. Feeder cattle in particular is delivering one of the strongest sustained trend signals in the portfolio, and the uniformly positive week across all three meats contracts is a constructive development for systematic managers with broad meats exposure.
Energy positioning was a modest negative contributor this week after three consecutive weeks as the primary positive driver. Long heating oil exposure lost 3.98%, long gasoline RBOB declined 1.51%, and long natural gas fell 1.27%. Partially offsetting these losses, long crude oil WTI gained 1.44% and long crude oil Brent added 0.34%. The sector average of -0.72% represents a sharp contrast to last week’s +5.60% contribution, but the crude oil benchmarks’ continued advance confirms that the broader energy trend is intact. Managers with diversified long energy exposure saw their refined products positions retrace while their crude positions advanced, a net-neutral outcome that does not compromise the multi-week trend signals already established across the petroleum complex.
Metals positioning produced a mixed result this week. Long copper exposure gained 2.23%, providing a positive contribution and partially reversing last week’s losses. Long silver added a modest 0.19%. Against these positives, long platinum exposure lost 5.00%, long palladium declined 2.71%, and long gold fell 1.79%. The sector average of -1.42% is a marked improvement over last week’s historic -8.53%, and the internal differentiation between copper’s recovery and the continued weakness in platinum and palladium is meaningful. Systematic managers who maintained diversified long metals exposure are seeing copper begin to contribute positively again, while those with concentrated precious metals positions continue to experience drawdown from the highs reached in prior weeks.
Equity positioning was negative across all major markets for a fourth consecutive week, with losses more contained than last week’s broad selloff but the downtrend firmly intact. Long Nasdaq 100 exposure lost 3.21%, the largest single equity detractor. Long S&P 500 declined 2.24% and long DJIA fell 1.02%. Long Russell 2000 lost 0.37%. The Nikkei 225’s +0.56% gain was the sole positive equity contribution, a minor offset against the broader weakness. Four consecutive weeks of equity declines are generating strong negative signals across most major indices, and short or flat equity positioning continues to be rewarded. The VIX’s 10.65% surge to 28.30 confirms that the elevated-volatility environment justifies continued defensive equity positioning in systematic portfolios.
Bonds positioning was a marginal negative contributor for a fourth consecutive week, though the losses were the smallest in that stretch. Long 30-year bond exposure lost 0.19%, the 10-year note was essentially flat at -0.02%, and the 5-year and 2-year notes each declined 0.17%. The bond complex’s near-flat performance this week is the most contained result in four weeks of weakness, and the deceleration in losses is a tentative signal worth monitoring. The competing forces of crude oil above 100 and rising equity volatility are producing a bond complex that is drifting rather than trending with conviction in either direction at this stage.
Grains positioning was a negative contributor for a second consecutive week, though losses were more contained than last week’s broad reversal. Long soybean meal exposure lost 3.87%, the largest single detractor in the complex. Long oats fell 4.60%, extending the sharp reversal from recent highs. Long canola declined 0.83%, long corn fell 0.75%, and long soybeans lost 0.17%. Partially offsetting these losses, long soybean oil gained 2.90% and long wheat added 1.64%. The sector’s -1.09% average is an improvement over last week’s -2.24%, with soybean oil and wheat providing meaningful positive contributions.
Currency positioning was uniformly negative as the US dollar strengthened against all eight tracked pairs. Long AUD lost 1.96%, long NZD fell 1.41%, long CHF declined 1.30%, long CAD fell 1.18%, and long JPY lost 0.63%. Long GBP and EUR each declined modestly. The currency sector’s -0.84% reversal from last week’s +0.27% positive contribution reflects the dollar’s reassertion this week. Soft commodity exposure produced a bifurcated result: long orange juice gained 9.32% and long cotton added 3.19%, while long coffee lost 2.60%, long cocoa fell 2.76%, and long lumber declined 2.13%. Long sugar added a modest 0.38%. Bitcoin’s -6.06% decline was the week’s largest single loss across all 49 assets, creating meaningful drawdown for any long crypto exposure.
Final Reflections: Energy Surges as Metals Collapse and Equities Slide Further
The fourth week of March delivered a week of rotation and broadening rather than the dramatic directional extremes that have defined recent editions. Orange juice surged 9.32% to reclaim the top performer position after last week’s devastating crash. Feeder cattle extended its multi-week uptrend with a 3.88% gain, and the meats sector led all ten sectors with a +2.45% average. Energy corrected modestly after three weeks of extraordinary gains, with the crude oil benchmarks holding their ground while refined products retreated. Equities continued their multi-week decline and the VIX surged 10.65% to 28.30. And through the rotation, the TTU Barometer accelerated from 57% to 66%, its largest single-week advance in the current recovery, with a 10-day rate of change of "Rising Moderately." The barometer’s jump is the week’s defining signal: beneath the surface rotation, trend breadth is expanding meaningfully across the 49-asset universe.
Three observations define the week:
1. The barometer’s jump from 57% to 66% is the most important signal of the week, and it matters that it arrived in a week when energy corrected.
For the past three weeks, the barometer’s position in "Strong" territory was heavily dependent on energy’s extraordinary contribution. Heating oil surging 14.79%, Brent gaining 8.77%, and the sector averaging +5.60% were the primary drivers of breadth. This week, energy corrected. Heating oil fell 3.98%, gasoline RBOB dropped 1.51%, and the sector averaged -0.72%. And yet the barometer did not fall. It rose, by nine percentage points, to 66% with a "Rising Moderately" rate of change. That is the most important signal in this report. It tells you that the trend environment is no longer dependent on a single sector for its breadth: meats, soft commodities, and copper stepped in to provide the signals that energy temporarily vacated. A trend environment that can sustain and improve its barometer reading during an energy correction is a structurally stronger environment than one that holds only when its dominant sector is advancing. The barometer’s jump to 66% confirms genuine broadening, not dependence.
2. Feeder cattle’s multi-week uptrend is now the highest-conviction trend signal in the portfolio.
Feeder cattle’s 3.88% gain to 360.13 this week is not the flashiest move in the report, but it represents something more valuable than volatility: a clean, consistent, multi-week uptrend generating reliable positive signals across all standard trend timeframes. Unlike orange juice, which has produced two consecutive weeks of extreme and opposing moves, or the VIX, which reflects fear rather than directional trend, feeder cattle is moving the way systematic trend-following strategies are designed to profit from. The weekly chart shows higher highs and higher closes across multiple consecutive weeks, with no confusing spike-and-reversal pattern. Live cattle at +2.29% and lean hogs at +1.19% provide corroborating signals across the entire meats sector. For systematic managers, the meats sector this week is delivering exactly the kind of sustained, low-noise directional movement that generates the strongest risk-adjusted returns over time.
3. Four consecutive weeks of equity decline and a VIX at 28.30 are generating the clearest negative signals in the portfolio.
The Nasdaq 100 declined 3.21% this week. The S&P 500 fell 2.24%. The DJIA lost 1.02%. Four consecutive weeks of declines across most major equity indices are producing some of the strongest and most consistent negative trend signals in the current portfolio. The VIX’s surge from 25.20 to 28.30, a 10.65% gain and the week’s single best performer across all 49 assets, confirms that equity market anxiety is building rather than stabilising. From approximately 18 in late February, the VIX has now risen more than 57% in five weeks, a sustained increase that reflects a genuine regime shift in equity volatility rather than a temporary spike. For systematic trend-following strategies, four consecutive weeks of broad equity declines combined with a rising VIX are among the clearest and most sustained negative signals currently available. Short or flat equity positioning is being rewarded, and the conviction of those signals is increasing with each additional week of confirmation. The SG Trend Index at -1.94% month-to-date and +6.68% year-to-date reflects the real portfolio impact of this equity weakness, combined with the mixed metals and currency environment, but the barometer’s rise to 66% confirms that the overall trend environment is improving even as specific sectors create headwinds.
Orange juice recovers. Meats lead all sectors. Energy consolidates. Equities slide for a fourth week. Bitcoin falls hardest. And the barometer jumps from 57% to 66% with rising momentum. The trend environment is broadening, the signals are multiplying, and the week’s most important story is not what moved most but that the barometer accelerated while energy rested.

List of Resources used in the Week in Review
Important Disclaimers
This document is directly solely to Accredited Investors, Qualified Eligible Participants, Qualified Clients and Qualified Purchasers. No investment decision should be made until prospective investors have read the detailed information in the fund offering documents of any manager mentioned in this document. This document is furnished on a confidential basis only for the use of the recipient and only for discussion purposes and is subject to amendment This document is neither advice nor a recommendation to enter into any transaction. This document is not an offer to buy or sell, nor a solicitation of an offer to buy or sell, any security or other financial instrument. This presentation is based on information obtained from sources that TopTradersUnplugged (“TTU”) (“considers to be reliable however, TTU makes no representation as to, and accepts no responsibility or liability for, the accuracy or completeness of the information. TTU has not independently verified third party manager or benchmark information, does not represent it as accurate, true or complete, makes no warranty, express or implied regarding it and shall not be liable for any losses, damages, costs or expenses relating to its adequacy, accuracy, truth, completeness or use.
All projections, valuations, and statistical analyses are provided to assist the recipient in the evaluation of the matters described herein. Such projections, valuations and analyses may be based on subjective assessments and assumptions and may use one among many alternative methodologies that produce different results accordingly, such projections, valuations and statistical analyses should not be viewed as facts and should not be relied upon as an accurate prediction of future events. There is no guarantee that any targeted performance will be achieved Commodity trading involves substantial risk of loss and may not be suitable for everyone
TTU is not and does not purport to be an advisor as to legal, taxation, accounting, financial or regulatory matters in any jurisdiction. The recipient should independently evaluate and judge the matters referred to herein. TTU does not provide advice or recommendations regarding an investor’s decision to allocate to funds or accounts managed by any manager (“or to maintain or sell investments in funds or accounts managed by any manager, and no fiduciary relationship under ERISA is created by the investor investing in funds or accounts managed by any manager, or through any communication between TTU and the investor
In reviewing this document, it should be understood that the past performance results of any asset class, or any investment or trading program set forth herein, are not necessarily indicative of any future results that may be achieved in connection with any transaction. Any persons subscribing for an investment must be able to bear the risks involved and must meet the suitability requirements relating to such investment. Some or all alternative investment programs discussed herein may not be suitable for certain investors This document is directed only to persons having professional experience in matters relating to investments. Any investment or investment activity to which this document relates is available only to such investment professionals. Persons who do not have professional experience in matters relating to investments should not rely upon this document.
This document and its contents are proprietary information of TTU and may not be reproduced or otherwise disseminated in whole or in part without TTU’s prior written consent.
This document contains simulated or hypothetical performance results that have certain inherent limitations AND SHOULD BE VIEWED FOR ILLUSTRATIVE PURPOSES. Unlike the results shown in an actual performance record, these results do not represent actual trading. HYPOTHETICAL PERFORMANCE RESULTS HAVE MANY INHERENT LIMITATIONS, SOME OF WHICH ARE DESCRIBED BELOW. NO REPRESENTATION IS BEING MADE THAT ANY ACCOUNT WILL OR IS LIKELY TO ACHIEVE PROFITS OR LOSSES SIMILAR TO THOSE SHOWN IN FACT, THERE ARE FREQUENTLY SHARP DIFFERENCES BETWEEN HYPOTHETICAL PERFORMANCE RESULTS AND THE ACTUAL RESULTS SUBSEQUENTLY ACHIEVED BY ANY PARTICULAR INVESTMENT ACCOUNT.
ONE OF THE LIMITATIONS OF HYPOTHETICAL PERFORMANCE RESULTS IS THAT THEY ARE GENERALLY PREPARED WITH THE BENEFIT OF HINDSIGHT IN ADDITION, HYPOTHETICAL TRADING DOES NOT INVOLVE FINANCIAL RISK, AND NO HYPOTHETICAL TRADING RECORD CAN COMPLETELY ACCOUNT FOR THE IMPACT OF FINANCIAL RISK IN ACTUAL TRADING FOR EXAMPLE, THE ABILITY TO WITHSTAND LOSSES OR TO ADHERE TO A PARTICULAR TRADING PROGRAM OR OTHER ASSET.
There are numerous other factors related to the markets in general or to the implementation of any specific trading program which cannot be fully accounted for in the preparation of hypothetical performance results and all of which can adversely affect actual trading results. No representation is being made that any investment will or is likely to achieve profits or losses similar to those being shown.
Most Comprehensive Guide to the Best Investment Books of All Time

Most Comprehensive Guide to the Best Investment Books of All Time
Get the most comprehensive guide to over 600 of the BEST investment books, with insights, and learn from some of the wisest and most accomplished investors in the world. A collection of MUST READ books carefully selected for you. Get it now absolutely FREE!
Get Your FREE Guide HERE!