


Trend Following - Week in Review— April 24, 2026

“The Whipsaw Resumes: Hormuz Re-Closes, Energy Spikes, Metals Unwind, and the Barometer Holds Strong at 50%”
This Week in Trend – 24 April 2026
Welcome to This Week in Trend, your weekly view into the evolving structure of global futures markets and the behaviour of systematic trend following. This edition covers conditions through the close of US markets on Friday, 24 April 2026.
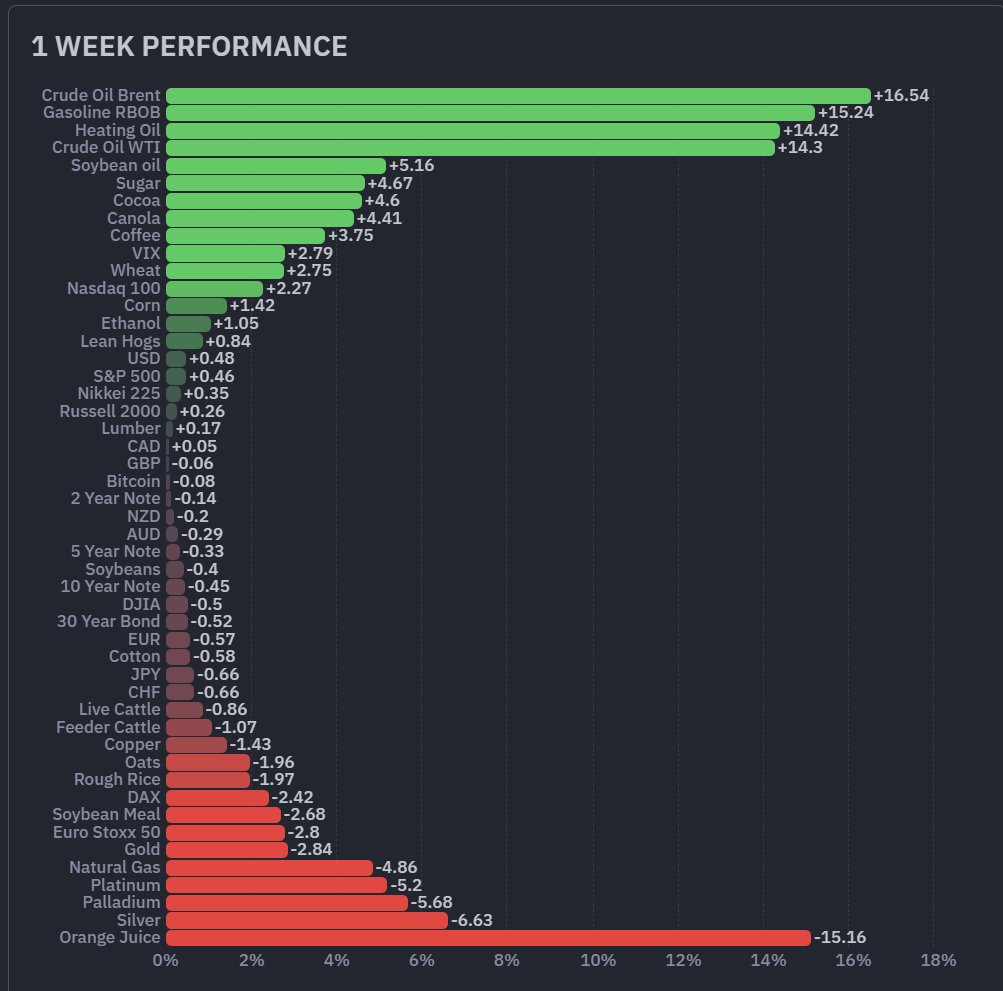
Crude Oil Brent advanced 16.54%, Gasoline RBOB rose 15.24%, Heating Oil added 14.42%, and Crude Oil WTI gained 14.30%. Four of the six petroleum contracts moved in double digits in the same direction in a single week. The Energy sector averaged +9.45%, the largest week-on-week reversal across all ten sectors in the current comparison after last week’s -4.58%. The driver was a full reversal of last week’s Hormuz narrative: market pricing reflected a renewed risk premium as the Strait remained effectively closed to commercial flows, the U.S. naval blockade of Iranian ports held, and diplomatic progress stalled.
Orange Juice moved 15.16% lower, the largest single-asset move in either direction this week. The Metals complex averaged -4.36% with all five contracts moving lower in the same direction: Silver -6.63%, Palladium -5.68%, Platinum -5.20%, Gold -2.84%, Copper -1.43%. Natural Gas was the lone contract moving counter to the rest of the Energy complex, falling 4.86% after a record 103 Bcf weekly storage injection. European equities moved meaningfully lower, with Euro Stoxx 50 -2.80% and DAX -2.42%, while U.S. equities held narrow positives: Nasdaq 100 +2.27%, S&P 500 +0.46%. Bitcoin finished broadly flat at -0.08%.
The TTU Trend Barometer eased from 55% to 50%, with the overall trend strength reading still classified as Strong. The 10-day rate of change reads “Falling Weakly”, the same as last week. The SG Trend Index advanced to +1.54% MTD and +8.73% YTD, a fresh 2026 high for both readings. The numerical reading sits at the lower edge of Strong territory, but the classification has held through one of the most disruptive cross-sector weeks in the current cycle.
For trend followers, the week was not defined by whether markets rose or fell. It was defined by whether the moves were persistent enough to be captured. Energy delivered the clearest upside directional impulse. Metals delivered the clearest downside directional impulse. Both are exploitable for systems aligned with the move; both can detract from systems caught on the opposite side or in a whipsaw. The opportunity was directional, but not directionally biased.
SG Trend Index Performance
Month to date: +1.54 percent
Year to date: +8.73 percent
Prior week reading (as of 17 April 2026):
Month to date: +0.87 percent
Year to date: +8.01 percent
The SG Trend Index advanced to +1.54% MTD and +8.73% YTD, up from +0.87% and +8.01% last week. Both readings set fresh 2026 highs. This is the key distinction for the week: breadth weakened, but existing positioning still generated positive returns. The barometer eased from 55% to 50% as two large sectors reversed in opposite directions, yet the index captured the Energy advance, the Metals reversal, and the unwinding Equity index moves through the positioning that was already in place. The classification remains Strong despite the five-point retreat.
The directional contributions have rotated sharply. Long Energy exposure, which detracted across the prior fortnight as the Hormuz reopening narrative played out, contributed strongly this week as the petroleum complex moved 14 to 17 percent higher. Long Metals exposure, which had been a constructive contributor for three weeks, detracted as Silver, Palladium, Platinum, and Gold all moved materially lower. Long Equity index exposure detracted modestly, with U.S. indices supportive and European indices the opposite. Short USD positioning gave back as the dollar firmed. The net is positive, but the composition is narrower and more concentrated in a single sector than the prior week’s broader contribution profile.
The barometer has eased to 50% but the classification remains Strong. The cycle has held its band through a week that reversed the prior fortnight’s leading sectors in opposite directions. April’s +1.54% MTD represents the strongest single-month trend-following result of 2026 to date, a reminder that index returns and breadth readings can move on different clocks even when both point in the same general direction.
TTU Trend Barometer
Current reading: 50 percent
Previous reading: 55 percent
10-day rate of change: Falling Weakly
The barometer eased from 55% to 50%, a five-point retreat that keeps the cycle in Strong-classified territory at the lower edge of the band. The sequence now reads 48, 52, 55, 50: the recovery established over the prior fortnight has held through a disruptive week, even as the headline number gave back some ground. The 10-day rate of change remains “Falling Weakly”, the same reading as last week, suggesting the deceleration that prompted caution then is still in place. The classification has held; the pace has not.
The mechanism is Energy and Metals running through positioning in opposite directions on the same week. Energy reversed from -4.58% to +9.45%, the largest week-on-week sector swing in this comparison, as market pricing reflected a renewed risk premium around the Hormuz standoff. Metals reversed from +4.09% to -4.36%, with all five contracts moving lower and Silver, Palladium, and Platinum each falling more than 5%. Two reversals of that magnitude in opposite directions, in the same week, are inherently disruptive to medium-term trend signals regardless of how individual portfolios are positioned. The barometer’s retreat is the direct expression of that disruption.
A 50% Strong-classified reading argues for active engagement rather than caution, but with the awareness that the numerical level sits close to the Neutral threshold. Energy now sits on the long side after a uniform-direction week, but the speed of the reversal from short to long carries its own caution: a complex that swings 14 percentage points sector-on-sector in two weeks has not yet given a stable directional read. Metals have turned in the opposite direction, decisively but not yet tested. The classification favours staying in the trade; the level itself argues against adding aggressive new exposure into uncertain directional reads.
The 50% reading sits at the lower edge of the Strong-classified band. Whether the cycle stabilises here, recovers above 55%, or slips through 40% into Weak turns on three things: whether the Energy spike consolidates into a sustained uptrend or fades as another short-cycle event, whether the Metals correction extends or finds support, and whether the U.S.-Iran standoff settles or escalates further. The “Falling Weakly” tilt argues that the near-term path of least resistance is sideways rather than back through 55% in either direction over the immediate term.
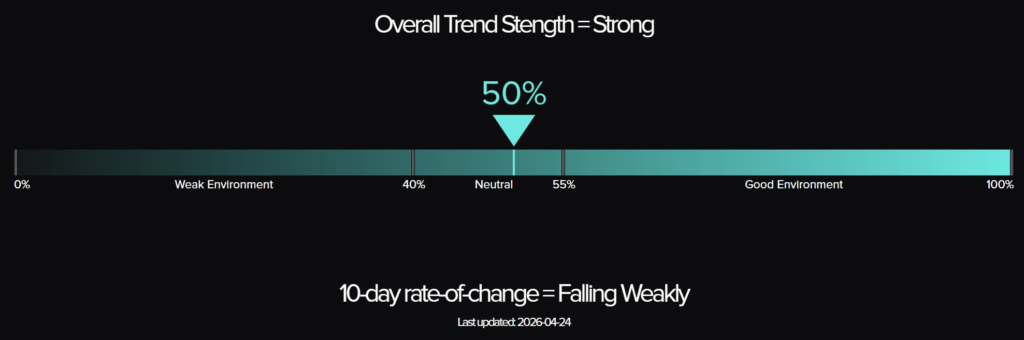
The Top Traders Unplugged (TTU) Trend Barometer is a proprietary tool that measures the percentage of markets with medium to strong trends. Similar to a thermometer, where 0 degrees Celsius equates to freezing, a TTU Trend Barometer reading below 40% indicates a “cold” environment for trend-following, while readings above 55% signal a “hotter,” more favorable trend environment.
Weekly Asset Class Snapshot
| Asset Class | This Week | Previous Week |
|---|---|---|
| Energy | +9.45% | -4.58% |
| Volatility Index | +2.79% | -8.96% |
| Grains | +0.84% | +0.99% |
| Crypto | -0.08% | +5.60% |
| Currencies | -0.24% | +0.62% |
| Equity Index | -0.34% | +4.15% |
| Bonds | -0.36% | +0.47% |
| Meats | -0.36% | -1.83% |
| Soft Commodity | -0.43% | -1.18% |
| Metals | -4.36% | +4.09% |
Source: Finviz.com
Energy (+9.45 percent | prev -4.58 percent)
Energy reversed direction sharply, the sector averaging +9.45% after last week’s -4.58%. The dominant market narrative shifted: the Strait of Hormuz remained effectively closed to commercial flows, the U.S. naval blockade of Iranian ports tightened, and reports indicated President Trump had instructed the U.S. Navy to target vessels allegedly laying mines in the waterway. Reports also indicated a U.S. Navy vessel had fired on and disabled an Iranian-flagged cargo ship in the Gulf of Oman, with U.S. forces subsequently boarding and seizing the vessel. Diplomatic talks stalled, the U.S.-Iran ceasefire was extended indefinitely while Washington awaited a new formal proposal from Tehran, and shipments from major Middle Eastern producers fell sharply. Brent moved 16.54%, the largest single-asset advance in the week. Gasoline RBOB advanced 15.24%, Heating Oil 14.42%, and WTI 14.30%: four contracts moving in double digits in the same direction. Ethanol added 1.05%. Five of six contracts moved higher in unison. Natural Gas was the lone counter-direction contract, falling 4.86% after the EIA reported a 103 Bcf storage injection for the week ended 17 April, well above the 64 Bcf five-year average and the 77 Bcf print in the same week last year, with mild spring weather and continued strong production weighing on the front month.
The petroleum complex now sits roughly back where it was two weeks ago, having travelled there via a -4.58% week followed by a +9.45% week. WTI prints near 94.88 and Brent near 105.88, both close to the highs of the prior month. The pattern on the weekly charts is wide-range two-way trading rather than a clean directional move, the kind of behaviour that disrupts medium-term trend signals more than it confirms them. Natural Gas, in contrast, has put in a fifth consecutive weekly decline, the chart settling into a clean downtrend driven by domestic supply fundamentals that are largely independent of the geopolitical premium driving the petroleum complex.
Bonds (-0.36 percent | prev +0.47 percent)
Bonds moved lower across the curve at -0.36% after last week’s +0.47%, breaking what had been a three-week run of positive sector readings. The 30-year Bond moved 0.52%, the 10-year Note 0.45%, the 5-year 0.33%, and the 2-year 0.14% lower. All four contracts moving in the same direction, with the long end leading the move as it had on the way up. The mechanics are the inverse of last week. Brent crude back above 105 and WTI back above 94 reintroduces the energy-driven inflation impulse that had been fading. The 10-year Treasury yield ticked up around 5 basis points to 4.3% on the week, with hawkish commentary at Fed Chair confirmation hearings adding to the pressure. Three weeks of constructive directional alignment in duration has been interrupted in a single week, which detracts from portfolios long the long end and is exploitable for any system that had begun to flip directional bias.
The weekly charts had been building cautiously upward-sloping structures across the curve. One directional week against that build interrupts but does not yet break it. The 30-year sits near 114.13 and the 10-year near 111.23, both still inside the range of the past two months. A second downward week with energy still elevated would call the duration story into question and offer a clearer directional signal in the opposite direction.
Soft Commodity (-0.43 percent | prev -1.18 percent)
Soft commodities posted a third consecutive negative sector reading, averaging -0.43% after last week’s -1.18%, though the headline modest negative masks a sharply bifurcated week. Sugar advanced 4.67%, Cocoa 4.60%, and Coffee 3.75%, the tropical trio reversing prior weakness on a combination of supply concerns and short covering. Lumber edged up 0.17%. Against these, Cotton turned lower for the first time in several weeks at -0.58%, ending its weather-driven run, and Orange Juice moved 15.16% lower, the largest single-asset move in either direction this week. The OJ move extends a long-running structural decline driven by improving Brazilian crop conditions, weak global demand for orange juice concentrate, and the contract’s well-documented thin liquidity, which amplifies moves in both directions. The contract trades near 161.90, the lowest level since December 2025. The directional persistence in OJ on the short side and the synchronised upward turn across Sugar, Cocoa, and Coffee are the cleaner signals in the complex this week.
The complex now reads as three separate stories. Sugar, Cocoa, and Coffee have all turned upward in the same week and bear watching for follow-through to confirm directional persistence. Cotton’s rejection of the prior week’s strength leaves the chart at a decision point. Orange Juice continues its long structural decline, the kind of one-way market that systematic short positioning is designed to capture, with the caveat that the contract’s liquidity profile demands careful sizing.
Metals (-4.36 percent | prev +4.09 percent)
Metals reversed direction sharply, the sector averaging -4.36% after last week’s +4.09%, with all five contracts moving lower in the same direction. Silver moved 6.63% lower, giving back almost the entirety of the prior week’s 7.01% advance. Palladium moved 5.68%, Platinum 5.20%, Gold 2.84%, and Copper 1.43% lower. The macro backdrop turned. The U.S. dollar firmed modestly on safe-haven flows and rising yields, the 10-year Treasury yield ticked up to around 4.3%, and hawkish commentary at Fed Chair confirmation hearings dampened the rate-cut expectations that had supported the precious complex through the prior three weeks. Stalled U.S.-Iran talks added to the volatility rather than the safe-haven bid: capital sought duration and the dollar rather than precious metals on this particular escalation. After three weeks of unidirectional upside that had carried the complex through 2025 and into 2026, the week marks a uniform-direction reversal across the complex.
Silver trades near 75.69 after a string of higher closes, the weekly chart showing the first material directional reversal in several weeks. Gold sits near 4725.40, well below the December 2025 record but still inside a long-running upward structure on a multi-month view. Platinum near 2021.00 and Palladium near 1506.50 have given back the past several weeks of advance. Copper near 6.03 remains inside its established range. The question for the week ahead is whether this is a single corrective week inside a longer upward structure or the start of a more persistent downward move. The longer-term charts still favour the former. A second downward week with similar magnitude would shift the read and convert the corrective candle into a directional opportunity for systems on the short side.
Meats (-0.36 percent | prev -1.83 percent)
Meats moderated to -0.36% after last week’s -1.83%, the second consecutive negative sector reading but at much shallower magnitude. Lean Hogs reversed direction to +0.84% after last week’s 2.58% decline. Live Cattle moved 0.86% lower and Feeder Cattle 1.07% lower, both contracts logging a second consecutive week in the same direction. The cattle complex is the live question. The multi-week upward structure that had been building through earlier in 2026 is now under sustained pressure, with two consecutive directional weeks lower for both Live Cattle and Feeder Cattle, the kind of pattern that begins to qualify as a directional opportunity for systems on the short side rather than a pause inside an upward trend.
Live Cattle near 244.88 and Feeder Cattle near 360.95 still print weekly charts that look like upward structures on a multi-month view, but the recent two-week pullback has eaten into prior gains. A third directional week in the same direction would shift the structural read from intact to compromised. Lean Hogs near 101.90 continues its volatile chop pattern, which remains hostile to medium-term trend signals in either direction.
Grains (+0.84 percent | prev +0.99 percent)
Grains held a positive sector reading at +0.84% after last week’s +0.99%, with the internal split shifting. Soybean Oil advanced 5.16%, the largest move in the complex, accelerating off the back of last week’s 1.59% advance and tracking the strength in the petroleum complex through the biofuel demand channel. Canola added 4.41% on related vegetable oil strength. Wheat extended a second week of upside at +2.75% after last week’s 3.55%, building a two-week reversal of its prior lower-low pattern. Corn rose 1.42%. Against these, Soybeans moved 0.40% lower, Oats 1.96% lower, Rough Rice 1.97% lower, and Soybean Meal 2.68% lower, the latter giving back its prior gains. Five of eight contracts moved upward, the same breadth as last week.
The vegetable oil pocket is the cleanest directional pattern in the complex on the upside, with Soybean Oil and Canola both extending advances. Wheat’s second consecutive upward week confirms the prior week’s reversal. Soybean Meal’s 2.68% drop reverses the prior week’s 5.27% surge, leaving the contract in choppy two-way trade that does not yet qualify as a directional signal. Rough Rice and Oats have given back the prior week’s gains. The sector reads as a series of contract-specific stories rather than a single thematic move.
Equity Index (-0.34 percent | prev +4.15 percent)
Equity indices ended the week modestly negative on average at -0.34% after last week’s +4.15%, with a sharp geographic split underneath the headline. The Nasdaq 100 advanced 2.27%, posting fresh record highs as strong Q1 earnings, particularly from Intel and select large-cap technology, supported the index through a difficult macro tape. The S&P 500 added 0.46%, the Nikkei 225 rose 0.35%, and the Russell 2000 edged up 0.26%. The DJIA moved 0.50% lower. The European indices moved materially lower: Euro Stoxx 50 -2.80% and DAX -2.42%, both indices logging five consecutive sessions of declines as the re-closure of the Strait of Hormuz drove energy prices higher and weighed on the European outlook. Germany’s Economics Ministry halved its 2026 GDP growth forecast to 0.5% and trimmed 2027 from 1.3% to 0.9%, citing the Iran conflict and the Strait closure. Inflation projections were lifted to 2.7% for 2026 and 2.8% for 2027.
The U.S. complex held its directional bias on this particular tape, with the Nasdaq 100 near 27440 setting record highs and the S&P 500 near 7195 holding most of the prior week’s gain. The European complex tells the inverse story: Euro Stoxx 50 near 5858 and DAX near 24372 have given back roughly half of the prior week’s advance. The split is mechanical: U.S. equities benefit from technology and earnings strength that is largely insulated from the Hormuz channel, while European equities sit downstream of the energy import bill. The clearest directional opportunity in the complex this week sits on the short side of European indices rather than on either side of U.S. ones.
Currencies (-0.24 percent | prev +0.62 percent)
The dollar reversed direction, the sector averaging -0.24% after last week’s +0.62%. The USD gained 0.48%, ending its two-week decline as safe-haven demand and rising Treasury yields supported the greenback through the Iran escalation. CAD held marginally positive at +0.05%, retaining a thin commodity-linked bid. Against these, six of the seven major currencies tracked finished negative against the USD: GBP -0.06%, NZD -0.20%, AUD -0.29%, EUR -0.57%, JPY -0.66%, CHF -0.66%. The breadth has flipped: seven of eight currency contracts negative on the week. The mechanism is the inverse of last week. Where the prior period featured oil down, dollar down, risk on, and majors firmer, this week features oil up, dollar firmer, risk mixed, and majors softer.
The USD near 98.34 has retraced part of its prior two-week decline. The two-week pattern of weakness that had pointed to a regime shift in early April has been interrupted rather than confirmed. The cleaner directional moves this week sit in the cross-currents: AUD and NZD at the softer commodity-linked end, JPY and CHF taking renewed risk-haven flow despite the dollar bid against them. The currency complex is back to mixed signals after a fortnight of clearer ones.
Volatility Index (+2.79 percent | prev -8.96 percent)
The VIX rose 2.79%, ending a three-week run of declines totalling roughly 36 percentage points. The contract trades near 20.80 after closing the prior week near 20.40. The increase is modest in absolute terms but reads as a shift in posture: hedges that had been steadily unwound through the prior three weeks of normalisation began to be re-added as the geopolitical backdrop deteriorated. The increase is consistent with the European equity weakness and the energy spike rather than with U.S. equity behaviour, which printed positive on the week.
The first positive weekly close in four interrupts what had been a clean short-volatility signal. The level remains near a normal equity volatility regime, so the move is not yet a regime change. A second positive week with a larger magnitude would shift the read.
Crypto (-0.08 percent | prev +5.60 percent)
Bitcoin finished broadly flat at -0.08% after consecutive prior gains of 9.46% and 5.60%. The contract trades near 78110, having paused after the two-week run of around 15%. There is no specific crypto-side catalyst this week. Bitcoin sat out a tape that featured sharply differentiated moves across the macro complex, neither participating in the energy rally nor amplifying the metals decline. The pause registers as consolidation rather than reversal.
One quiet week after two strong ones leaves the chart structure intact. The two-week advance still stands, and a flat candle is materially better for the ongoing trend than a giveback would have been. The longer-term uptrend remains the operating read.
Performance Highlights – This Week’s Market Leaders & Laggards
Source: Finviz.com
Top Market Movers
Top Gainers
1. Crude Oil Brent +16.54 percent
Crude Oil Brent advanced 16.54%, the largest single-asset move of the week and the largest of four petroleum contracts that moved in double digits in the same direction. Brent trades near 105.88 after closing the prior week roughly 14% lower. The drivers were sequential: stalled U.S.-Iran negotiations, the continued effective closure of the Strait of Hormuz to commercial flows, the U.S. naval blockade of Iranian ports, and reports of further confrontation in the Gulf of Oman. The geopolitical risk premium that had been priced out the prior week was priced straight back in, and physical supply through the Strait remained constrained. The week’s magnitude is real, but the chart structure is now wide-range two-way trade rather than a sustained directional move, the kind of behaviour that disrupts medium-term trend signals more than it confirms them.
2. Gasoline RBOB +15.24 percent
Gasoline RBOB advanced 15.24%, the second-largest single-asset move of the week. The contract trades near 3.4793 after a sharp upward week. The driver is the same Hormuz channel that lifted crude, expressed through the refined product crack: physical supply tightness through the Strait flows directly to gasoline through reduced refined product imports and refinery feedstock costs. Last week’s 1.07% decline was fully reversed and then some inside a single week, which leaves the cumulative two-week pattern as a near-complete round trip rather than a directional advance.
3. Heating Oil +14.42 percent
Heating Oil advanced 14.42%, the third-largest single-asset move of the week and a third member of the petroleum complex moving in double digits in the same direction. The contract trades near 3.9518, having reversed the prior week’s 9.68% decline and added further. Heating Oil tracks the same Hormuz channel as crude through the distillate side of the product slate, with the additional support of constrained Middle Eastern distillate flows that have lifted middle distillate cracks throughout April. The reversal is sharp; the cumulative move across the prior fortnight is now approximately neutral, the kind of round-trip behaviour that disrupts medium-term trend signals.
4. Crude Oil WTI +14.30 percent
Crude Oil WTI advanced 14.30%, the fourth-largest single-asset move of the week and a near-complete reversal of last week’s 11.24% decline. The contract trades near 94.88, having taken a round trip through the prior month’s range. The drivers mirror Brent: stalled diplomatic progress, the U.S. naval blockade, reports of further Gulf confrontation, and the continued effective closure of the Strait. The cumulative two-week pattern is wide-range two-way trading rather than a sustained directional move, the kind of behaviour that disrupts medium-term trend signals more than it confirms them.
Top Losers
1. Orange Juice -15.16 percent
Orange Juice moved 15.16% lower, the largest single-asset move of the week in either direction. The contract trades near 161.90, the lowest level since December 2025. The move extends a long-running structural decline that has been in train since late 2024, driven by improving Brazilian crop conditions, weak global demand for orange juice concentrate, and the contract’s well-documented thin liquidity, which amplifies moves in both directions. The longer-term chart shows a sustained downward structure from multi-year highs near 500. OJ has been one of the cleaner directional patterns in the broader complex through the correction; this week’s magnitude reflects the liquidity profile as much as any new fundamental catalyst, and any system holding short exposure into Friday will have captured the move directly.
2. Silver -6.63 percent
Silver moved 6.63% lower, the second-largest single-asset move of the week and a near-complete giveback of last week’s 7.01% advance. The contract trades near 75.69. The reversal sits inside a broader Metals correction driven by a firmer dollar, rising Treasury yields, and dampened rate-cut expectations after hawkish commentary at Fed Chair confirmation hearings. The longer-term upward structure that has carried Silver through 2025 and into 2026 remains intact on a multi-month view, but a single directional week of this magnitude in the opposite direction wipes out the prior week’s advance and resets the near-term read for any system that had built fresh long exposure.
3. Palladium -5.68 percent
Palladium moved 5.68% lower, the third-largest single-asset move of the week and giving back more than the prior week’s 3.93% advance. The contract trades near 1506.50. The move reflects the same firmer-dollar, higher-yields backdrop weighing on the precious complex, with the platinum-group metals additionally exposed to industrial demand uncertainty as the European growth outlook deteriorated. The longer-term structure remains constructive on supply tightness from South African and Russian mines, but a corrective phase has now started. The directional move is exploitable for systems aligned short and detracts from systems still carrying long exposure.
4. Platinum -5.20 percent
Platinum moved 5.20% lower, the fourth-largest single-asset move of the week, completing a uniform-direction top-three on the downside that consists entirely of precious metals. The contract trades near 2021.00, having given back the prior week’s 3.70% advance and more. The drivers are the macro backdrop common to the complex: dollar firmer, yields up, rate-cut expectations softer. The structural tightness in South African and Russian supply that supports the long-term Platinum thesis has not changed; this week is a price reset, not a fundamental shift, and the directional move sits inside a corrective phase rather than a regime change.
Portfolio View - Positioning and Impact
Long Energy exposure was the largest contributor this week, reversing the detraction of the prior fortnight. Brent +16.54%, Gasoline RBOB +15.24%, Heating Oil +14.42%, WTI +14.30%, Ethanol +1.05%. Five of six contracts moved upward in unison, the sector +9.45%. Natural Gas was the lone counter-direction contract at -4.86% on the EIA storage shock. The directional move is the cleanest of the week. Whether it contributed or detracted depends on alignment: portfolios already long, or quick to flip from short, captured the move; portfolios that had re-established short Energy positioning over the prior fortnight and were slow to reverse sat on the opposite side.
Metals moved the opposite direction with similar uniformity: Silver -6.63%, Palladium -5.68%, Platinum -5.20%, Gold -2.84%, Copper -1.43%. All five contracts moved lower in unison, the sector -4.36%. After three consecutive weeks of unidirectional upside, the week marks the second clean directional move of the week alongside Energy, in the opposite direction. Whether it contributed or detracted depends on alignment: systems aligned short, or that had begun trimming or flipping bias, captured the move; systems carrying full long exposure from the prior three-week run sat on the opposite side. The same price action carries different P&L outcomes depending on where each system was positioned coming in.
Long Bitcoin contributed nothing on a flat -0.08% week. Long majors against short USD reversed: USD +0.48%, AUD -0.29%, EUR -0.57%, JPY -0.66%, CHF -0.66%, GBP -0.06%, NZD -0.20%. CAD held marginally positive at +0.05%. Currencies sector -0.24%. Seven of eight currency contracts negative against the USD, the inverse of last week’s breadth.
Long Equity index exposure ended modestly negative at -0.34% with a sharp geographic split: Nasdaq 100 +2.27%, S&P 500 +0.46%, Nikkei 225 +0.35%, Russell 2000 +0.26% on the upward side, against DJIA -0.50%, DAX -2.42%, Euro Stoxx 50 -2.80% on the downward side. Long Bonds detracted at -0.36% across all four contracts after a three-week run of positive contribution, with energy-driven inflation pressure and a 5 basis point rise in 10-year yields the mechanism. Long VIX captured a small 2.79% gain on the first weekly move higher in four weeks.
Long Grains held a positive contribution at +0.84%: Soybean Oil +5.16%, Canola +4.41%, Wheat +2.75%, Corn +1.42%, against Soybeans -0.40%, Oats -1.96%, Rough Rice -1.97%, Soybean Meal -2.68%. Softs split sharply: Sugar +4.67%, Cocoa +4.60%, Coffee +3.75%, Lumber +0.17% on the upward side, Cotton -0.58% and Orange Juice -15.16% on the downward side. Meats moved modestly lower at -0.36%, with Lean Hogs the lone upward-direction contract at +0.84%; Live Cattle and Feeder Cattle posted a second consecutive directional week lower.
Final Reflections: The Whipsaw Resumes
The week ending 24 April 2026 was a sharp reversal of the prior week’s repricing. Market pricing reflected a renewed risk premium around the Strait of Hormuz, with reports indicating the U.S. naval blockade of Iranian ports tightened and diplomatic talks stalled. The geopolitical risk premium that had been priced out of oil was priced straight back in. Energy averaged +9.45%, the largest week-on-week sector reversal in the current comparison against the prior week’s -4.58%. Metals reversed in the opposite direction, averaging -4.36% against the prior week’s +4.09%. The U.S. dollar firmed, Treasury yields rose, the precious complex moved through a sharp corrective week, and the European equity complex moved meaningfully lower on energy import concerns. The TTU Barometer eased from 55% to 50%, with the overall trend strength reading still classified as Strong. The SG Trend Index advanced to +1.54% MTD and +8.73% YTD, both fresh 2026 highs, a reminder that uptrends and downtrends can both contribute when they are persistent enough for systematic models to capture.
Three observations define the week:
1. The barometer has eased from 55% to 50% but the classification remains Strong. The cycle has held its band through a disruptive week.
The barometer measures how many markets are generating medium-to-strong trend signals across the full 49-asset universe. When two of the largest commodity sectors reverse direction in the same week, with Energy swinging from -4.58% to +9.45% and Metals from +4.09% to -4.36%, the breadth of clean directional signals becomes harder to identify regardless of whether the moves are positive or negative. The barometer’s five-point retreat from 55% to 50% is the direct expression of that disruption to directional persistence. Notably, the classification stayed in Strong territory through the disruption: the underlying signals still register as a Strong environment for trend-following, even though the headline number gave back ground. The 10-day rate of change remains “Falling Weakly”, the same as last week, suggesting the deceleration is unfinished but the directional conviction has not collapsed.
2. Energy has resumed two-way whipsaw, the structure that has dominated the petroleum complex for most of April.
The petroleum complex now sits roughly back where it was two weeks ago, having travelled there via a -4.58% week followed by a +9.45% week. WTI has gone from below 80 to near 95 and back through 90 in the space of three weeks. Brent has done the same around 105. Two-way moves of this magnitude across consecutive weeks are the textbook signature of a market in which fundamentals and politics are pulling in opposite directions, with each week dominated by whichever input lands first. For systematic medium-term trend strategies, this is the most disruptive structure: the magnitude is real, the direction is unstable, and the persistence of either signal is unreliable. The Hormuz channel will continue to dominate the complex until either diplomatic resolution or sustained military escalation removes the optionality.
3. Metals have taken a sharp single-week correction, and whether it extends will determine the larger structural read.
Silver -6.63%, Palladium -5.68%, Platinum -5.20%, Gold -2.84%, Copper -1.43%. All five contracts moved lower in unison, the sector -4.36% after three consecutive weeks of unidirectional upside. The macro driver is straightforward: a firmer dollar, rising Treasury yields near 4.3%, and dampened rate-cut expectations after hawkish Fed commentary at confirmation hearings combined to remove the macro tailwind that had supported the complex through the prior weeks. The structural backdrop, including supply tightness in South African and Russian mines and the long-running de-dollarisation trade, has not changed. The longer-term upward structures remain intact on multi-month charts. A second directional week in the same direction with similar magnitude would shift the read; a single week, however sharp, sits inside the broader upward structure until proven otherwise.
This was the week the whipsaw resumed. The Hormuz risk premium returned, and Energy moved sharply higher. The Metals complex moved through a uniform-direction corrective week. The U.S. dollar firmed, Treasury yields rose, the precious metals trade unwound, and European equities moved lower on the energy import bill. U.S. equities held positive ground on technology earnings strength. The VIX printed its first weekly move higher in four. The barometer eased from 55% to 50%, but the classification remained Strong. The SG Trend Index nonetheless set fresh 2026 highs at +1.54% MTD and +8.73% YTD. For trend followers, the week was not defined by whether markets rose or fell. It was defined by whether the moves were persistent enough to be captured. The opportunity was directional, but not directionally biased. The cleaner directional patterns now sit in places that were not the focus a week ago: short Orange Juice, the synchronised upward turn across Sugar, Cocoa, and Coffee, and short Natural Gas. Energy itself remains directionally unstable on a two-week view. Metals are tested.
One question defines the week ahead: does diplomacy restart, or does the Hormuz standoff escalate further.

List of Resources used in the Week in Review
Important Disclaimers
This document is directly solely to Accredited Investors, Qualified Eligible Participants, Qualified Clients and Qualified Purchasers. No investment decision should be made until prospective investors have read the detailed information in the fund offering documents of any manager mentioned in this document. This document is furnished on a confidential basis only for the use of the recipient and only for discussion purposes and is subject to amendment This document is neither advice nor a recommendation to enter into any transaction. This document is not an offer to buy or sell, nor a solicitation of an offer to buy or sell, any security or other financial instrument. This presentation is based on information obtained from sources that TopTradersUnplugged (“TTU”) (“considers to be reliable however, TTU makes no representation as to, and accepts no responsibility or liability for, the accuracy or completeness of the information. TTU has not independently verified third party manager or benchmark information, does not represent it as accurate, true or complete, makes no warranty, express or implied regarding it and shall not be liable for any losses, damages, costs or expenses relating to its adequacy, accuracy, truth, completeness or use.
All projections, valuations, and statistical analyses are provided to assist the recipient in the evaluation of the matters described herein. Such projections, valuations and analyses may be based on subjective assessments and assumptions and may use one among many alternative methodologies that produce different results accordingly, such projections, valuations and statistical analyses should not be viewed as facts and should not be relied upon as an accurate prediction of future events. There is no guarantee that any targeted performance will be achieved Commodity trading involves substantial risk of loss and may not be suitable for everyone
TTU is not and does not purport to be an advisor as to legal, taxation, accounting, financial or regulatory matters in any jurisdiction. The recipient should independently evaluate and judge the matters referred to herein. TTU does not provide advice or recommendations regarding an investor’s decision to allocate to funds or accounts managed by any manager (“or to maintain or sell investments in funds or accounts managed by any manager, and no fiduciary relationship under ERISA is created by the investor investing in funds or accounts managed by any manager, or through any communication between TTU and the investor
In reviewing this document, it should be understood that the past performance results of any asset class, or any investment or trading program set forth herein, are not necessarily indicative of any future results that may be achieved in connection with any transaction. Any persons subscribing for an investment must be able to bear the risks involved and must meet the suitability requirements relating to such investment. Some or all alternative investment programs discussed herein may not be suitable for certain investors This document is directed only to persons having professional experience in matters relating to investments. Any investment or investment activity to which this document relates is available only to such investment professionals. Persons who do not have professional experience in matters relating to investments should not rely upon this document.
This document and its contents are proprietary information of TTU and may not be reproduced or otherwise disseminated in whole or in part without TTU’s prior written consent.
This document contains simulated or hypothetical performance results that have certain inherent limitations AND SHOULD BE VIEWED FOR ILLUSTRATIVE PURPOSES. Unlike the results shown in an actual performance record, these results do not represent actual trading. HYPOTHETICAL PERFORMANCE RESULTS HAVE MANY INHERENT LIMITATIONS, SOME OF WHICH ARE DESCRIBED BELOW. NO REPRESENTATION IS BEING MADE THAT ANY ACCOUNT WILL OR IS LIKELY TO ACHIEVE PROFITS OR LOSSES SIMILAR TO THOSE SHOWN IN FACT, THERE ARE FREQUENTLY SHARP DIFFERENCES BETWEEN HYPOTHETICAL PERFORMANCE RESULTS AND THE ACTUAL RESULTS SUBSEQUENTLY ACHIEVED BY ANY PARTICULAR INVESTMENT ACCOUNT.
ONE OF THE LIMITATIONS OF HYPOTHETICAL PERFORMANCE RESULTS IS THAT THEY ARE GENERALLY PREPARED WITH THE BENEFIT OF HINDSIGHT IN ADDITION, HYPOTHETICAL TRADING DOES NOT INVOLVE FINANCIAL RISK, AND NO HYPOTHETICAL TRADING RECORD CAN COMPLETELY ACCOUNT FOR THE IMPACT OF FINANCIAL RISK IN ACTUAL TRADING FOR EXAMPLE, THE ABILITY TO WITHSTAND LOSSES OR TO ADHERE TO A PARTICULAR TRADING PROGRAM OR OTHER ASSET.
There are numerous other factors related to the markets in general or to the implementation of any specific trading program which cannot be fully accounted for in the preparation of hypothetical performance results and all of which can adversely affect actual trading results. No representation is being made that any investment will or is likely to achieve profits or losses similar to those being shown.
Most Comprehensive Guide to the Best Investment Books of All Time

Most Comprehensive Guide to the Best Investment Books of All Time
Get the most comprehensive guide to over 600 of the BEST investment books, with insights, and learn from some of the wisest and most accomplished investors in the world. A collection of MUST READ books carefully selected for you. Get it now absolutely FREE!
Get Your FREE Guide HERE!