


Trend Following - Week in Review— June 5, 2026

"A Hot Jobs Print Triggers a Broad Risk-Off Reversal: Equities and Precious Metals Break Lower, the Dollar Turns Up, and the Barometer Recovers to Neutral at 43%"
This Week in Trend – 5 June 2026
Welcome to This Week in Trend, your weekly view into the evolving structure of global futures markets and the behaviour of systematic trend following. This edition covers conditions through the close of US markets on Friday, 5 June 2026.
The week inverted the prior week’s configuration almost point for point. A hotter-than-expected May payrolls report landed on Friday, and market pricing swung toward a Federal Reserve that may now raise rates rather than cut: reports indicated employers added roughly 172,000 jobs against expectations near 88,000, with the unemployment rate steady at 4.3%, and traders moved to price a hike by year end. Treasury yields rose, the dollar reversed higher, and a semiconductor and AI selloff that had begun midweek accelerated into the close. Equity indices fell hard, averaging -2.18% with the Nasdaq 100 down 4.53% and the Nikkei 225 down 3.33% on the week, the bulk of the damage concentrated in a single Friday session that ranked as the worst for US technology since April 2025. The VIX rose 8.99% to near 19.65, reversing two weeks of decline, and the breadth was lopsided: 12 of 49 contracts closed higher against 37 lower.
Inside the complex the moves lined up behind the same macro driver. Bonds eased across the curve at -0.49% as the firmer data and the repricing toward a hike lifted yields, the long end giving back the prior two weeks’ recovery, with the 10 Year Note down 0.68% and the 30 Year Bond down 0.42%. The dollar reversed higher, the USD index up 1.21% back above 100, and every other currency in the basket fell against it, NZD -3.16% and CHF -1.98% the weakest. Metals broke down hard at -6.18%, the precious complex leading: Silver fell 8.93%, Palladium 8.56% and Platinum 6.82% as higher yields and the firmer dollar raised the opportunity cost of holding non-yielding metals, with Gold down 4.96% to its lowest of 2026. Grains extended their reversal at -5.40%, every contract lower and Oats down 12.89%, while Bitcoin fell 16.94% to near 61,040 in a week-long unwind. Energy was the lone multi-contract sector higher on the petroleum rebound, up 0.49%, and Meats turned up at +0.65%.
Trend Indicators: Barometer Recovers to Neutral, SG Trend Index Extends Higher
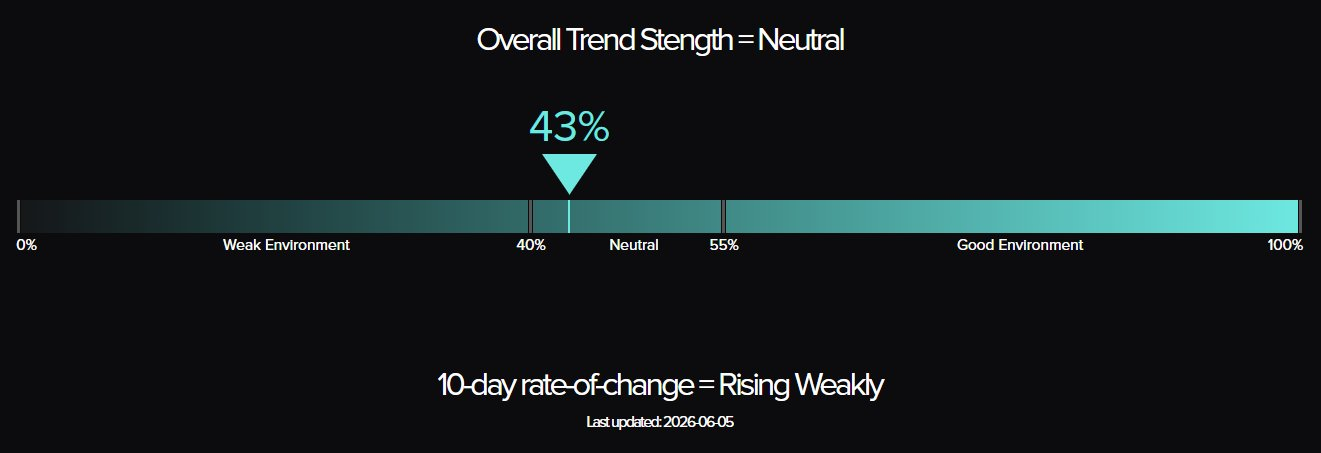
TTU Trend Barometer: 43%, up from 32% last week, with the overall trend strength classification rising from Moderately Weak back to Neutral. The 10-day rate of change has reversed from “Falling Rapidly” to “Rising Weakly”. The five-week sequence now reads 43, 57, 45, 32, 43: the 32 print at the end of May marked the low of the run, and the reading has stepped back above the 40% boundary into Neutral after a single week in Weak-environment territory.
The mechanism is the return of breadth, not its loss. Last week the reading collapsed because sector after sector fractured into two-way internal splits; this week the moves lined up. The payrolls print pushed yields, the dollar and the equity reversal in the same direction at once, metals broke lower as a complex rather than splitting, grains fell across all eight contracts, and crypto extended an established decline. The barometer measures the share of markets generating medium-to-strong trends regardless of direction, so a broad, synchronised move to the downside lifts it just as a broad move higher would. That is the key reading this week: the environment firmed not because markets rose, but because they stopped diverging. The Rising Weakly rate of change tilts the evidence toward further recovery rather than a relapse, though a single week back inside Neutral is not yet a trend in the indicator.
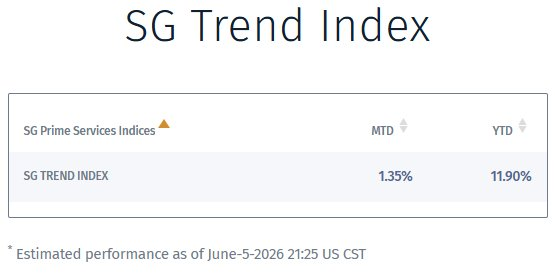
SG Trend Index: +1.35% month to date for June and +11.90% year to date as of 5 June, compared with +0.38% MTD and +10.55% YTD at last week’s close. With the calendar having rolled into June, the entire month-to-date figure is fresh: the index added roughly 1.35 percentage points on the year over the week, reversing the prior fortnight’s giveback. The gain sits alongside the firmer barometer rather than against it. The week’s largest moves extended trends that trend systems would typically already hold short, the crypto decline that has run since January, the grains reversal now in its second week, and the firmer dollar, so short exposure across those complexes was rewarded. The sharp equity reversal would have worked the other way against long-equity exposure that had carried the prior weeks. The net was positive, and the YTD reading pushes back toward the top of its recent range rather than extending May’s round-trip.
Weekly Asset Class Snapshot
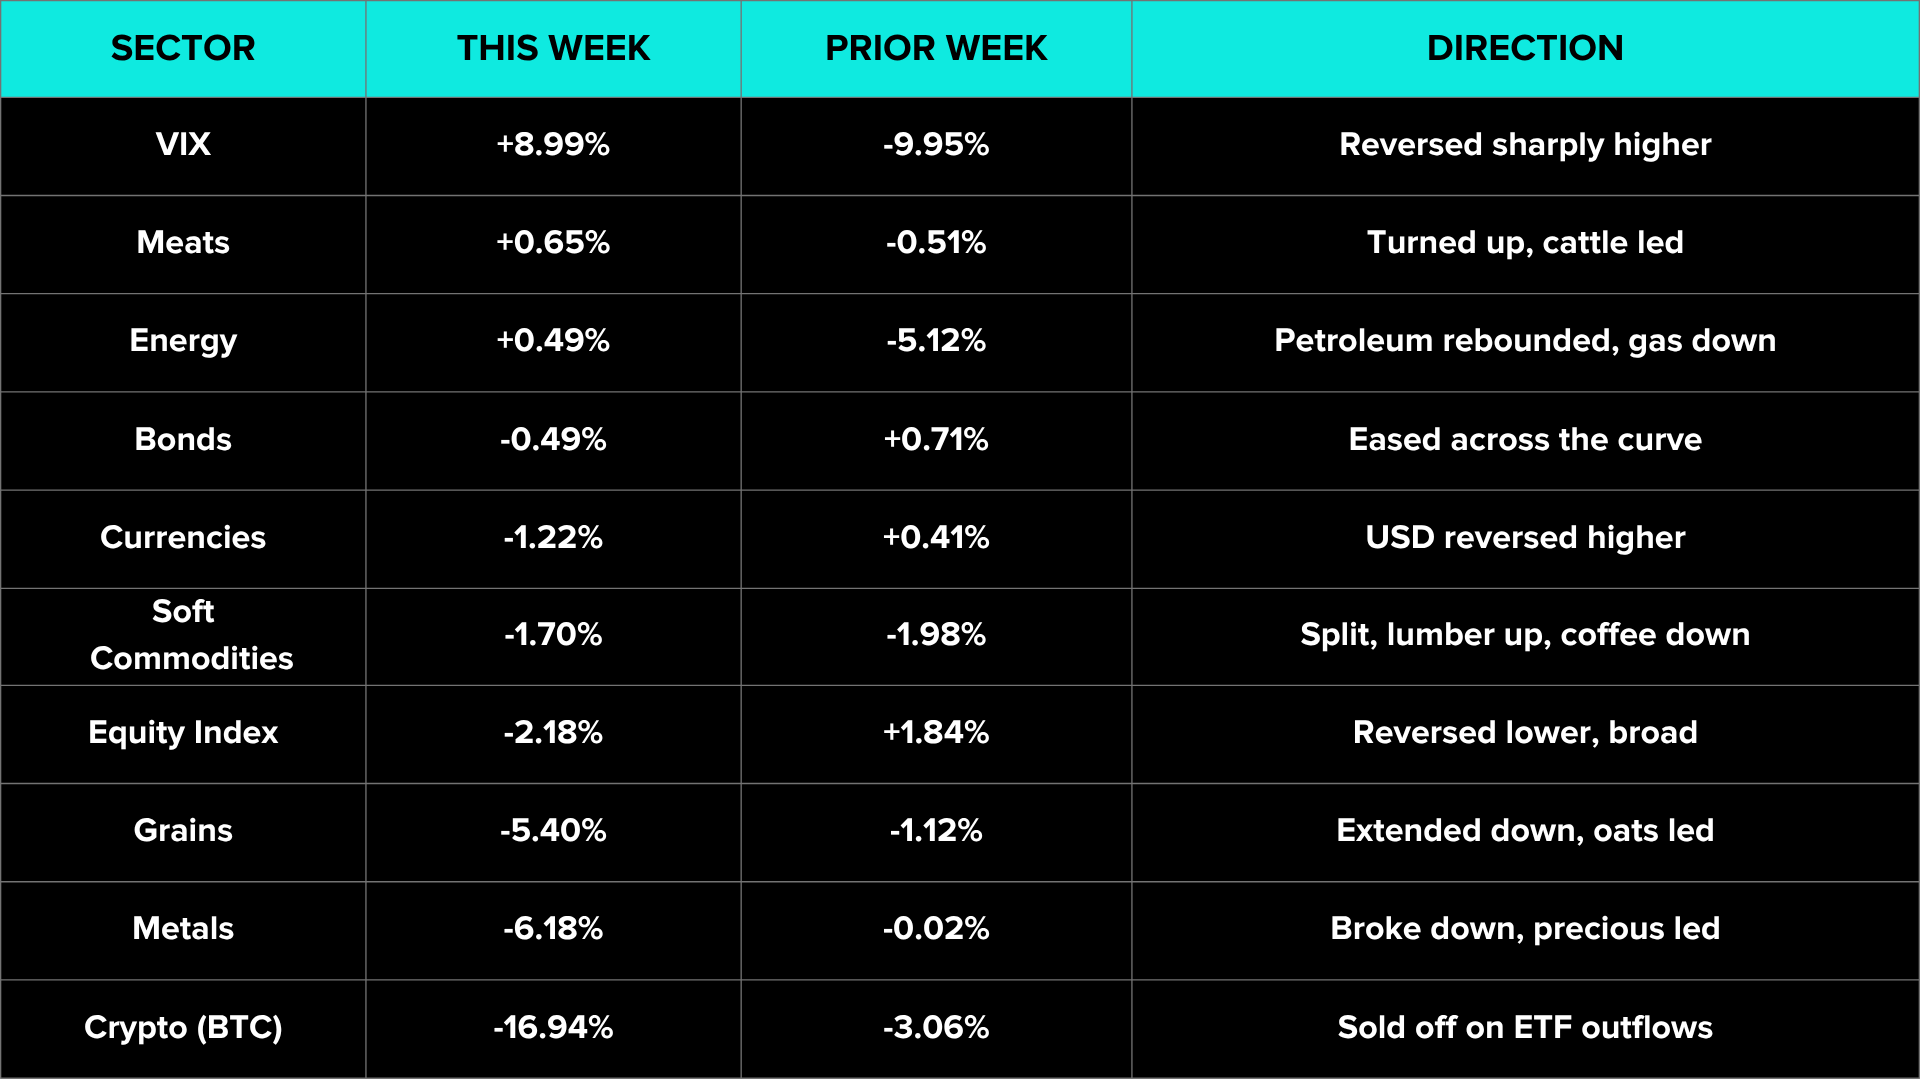
Sector averages are simple equal-weighted means of the constituent contracts in each sector.
Equity Index (-2.18% | prev +1.84%)
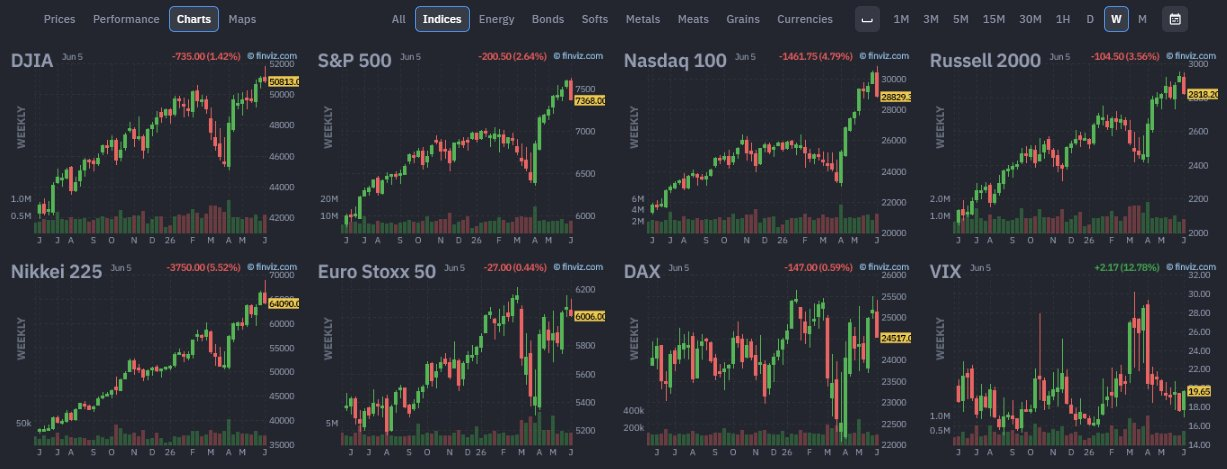
The advance reversed. Six of seven contracts fell, the Nasdaq 100 leading the decline at -4.53% near 28830, the Nikkei 225 -3.33% near 64090, the Russell 2000 -3.06% near 2818, the S&P 500 -2.57% near 7368, the DAX -1.51% and the DJIA -0.28%; only Euro Stoxx 50 held marginally positive at +0.05%. The bulk of the move came in a single Friday session after the payrolls print, with the Nasdaq 100 down 4.79% on the day and the Nikkei down 5.52%, the worst session for US technology since April 2025. Reports tied the selling to a semiconductor and AI rotation that began when a bellwether chipmaker held its full-year AI targets unchanged, and the slump spread into Asian and European chip names. The S&P had closed at a record for nine weeks running into this week; the reversal cut breadth from uniformly higher to broadly lower without changing the multi-month structure beneath it, which remains intact but newly tested.
Energy (+0.49% | prev -5.12%)
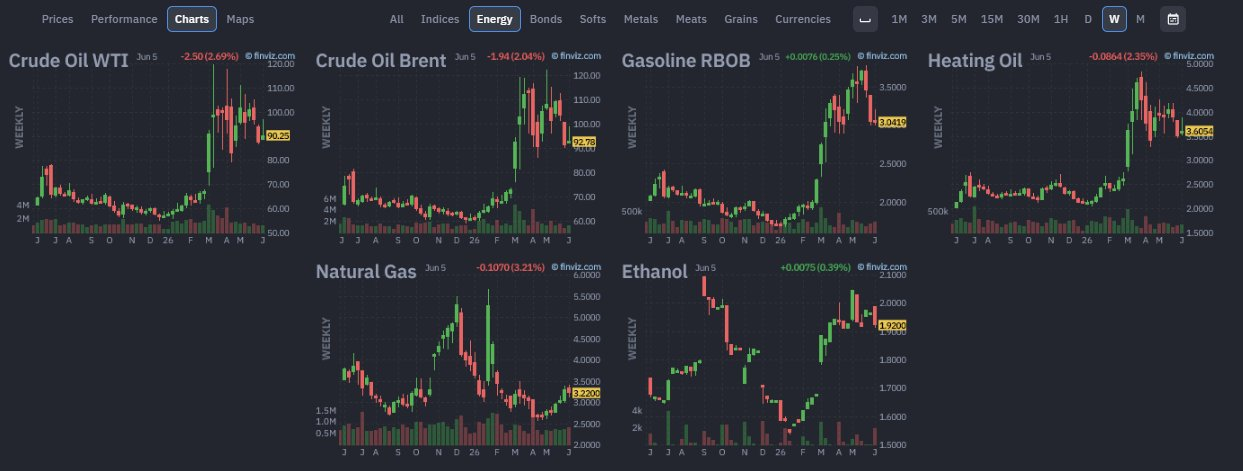
The petroleum complex rebounded after two weeks of heavy losses, lifting the sector to one of only two multi-contract positive readings on the board. Crude Oil WTI rose 3.64% to near 90.25, Heating Oil 2.83% near 3.61, Crude Oil Brent 2.16% near 92.78 and Gasoline RBOB 0.38%, while Natural Gas fell 1.85% to near 3.22 and Ethanol dropped 4.24%, so the sector stayed split internally even as it turned higher overall. Most of the petroleum gain was built earlier in the week, and the complex gave back ground on Friday alongside the broad risk-off, WTI off 2.69% on the day. Reports continued to cite ongoing Middle East uncertainty around the Strait of Hormuz as a swing factor. After the spring spike and the sharp two-week unwind that followed, the rebound reads as a stabilisation in the petroleum band rather than the resumption of a clean trend.
Metals (-6.18% | prev -0.02%)
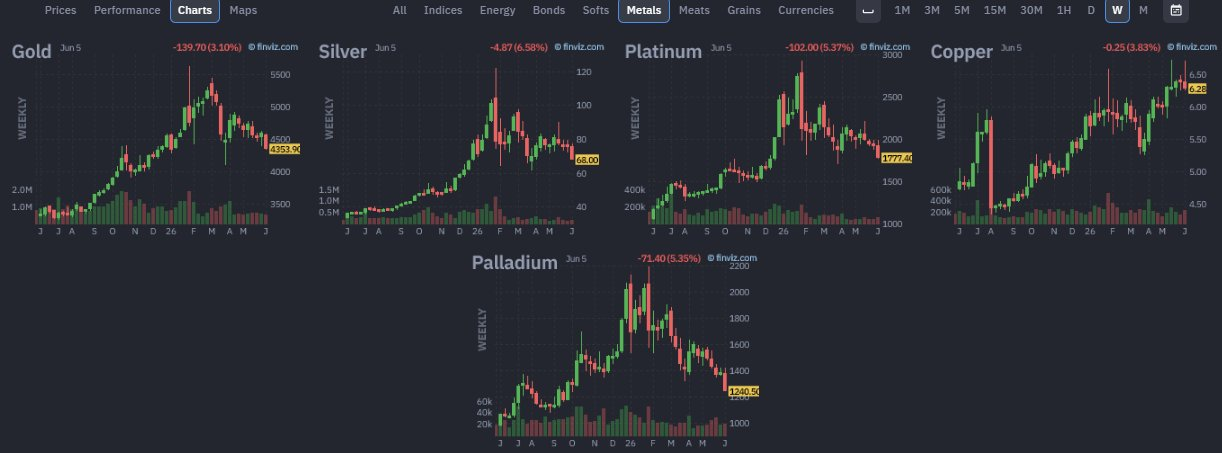
A clear breakdown, and the sharpest sector move outside crypto. All five contracts fell, the precious complex leading: Silver dropped 8.93% to near 68, Palladium 8.56% to near 1241, Platinum 6.82% to near 1777 and Gold 4.96% to near 4354, its lowest level of 2026, with Copper down 1.64% near 6.26. The decline was macro-driven and concentrated into Friday, when the firmer payrolls data lifted yields and the dollar: because the metals carry no yield, a higher rate path and a stronger dollar raise the cost of holding them, and the complex sold off together. This is the first uniform, sector-wide move lower in the metals in several weeks, replacing the mixed, range-bound picture of the prior fortnight with a single decisive break. Gold sits well below its January high and has now given back the firmer tone it had built through late May.
Soft Commodities (-1.70% | prev -1.98%)
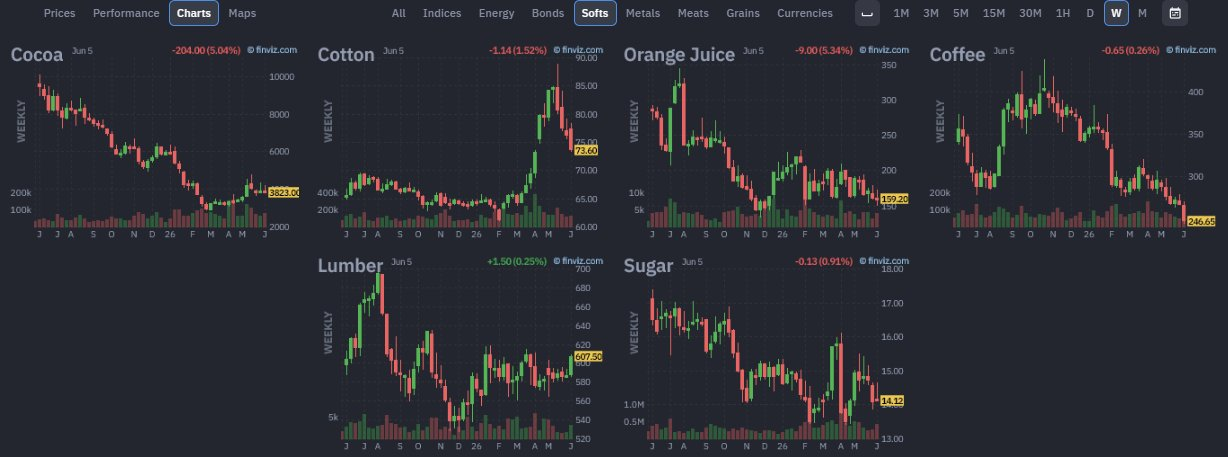
The sector stayed split at the contract level for a third week. Lumber led the upside at +3.49% near 607.50 and Sugar added 0.57%, with Orange Juice fractionally higher at +0.09%, while Coffee fell 7.19% to near 246.65, Cocoa 3.98% to near 3823 and Cotton 3.15% near 73.60. Coffee was the weakest contract in the sector and among the larger declines on the board, extending a steady descent from its late-2025 highs. Cocoa gave back ground after the prior week’s bounce, the contract continuing to swing two ways from week to week. The sector average of -1.70% again understates the internal dispersion: the moves here run in opposite directions inside the same group, with Lumber pushing higher while the tropical softs roll lower.
Grains (-5.40% | prev -1.12%)
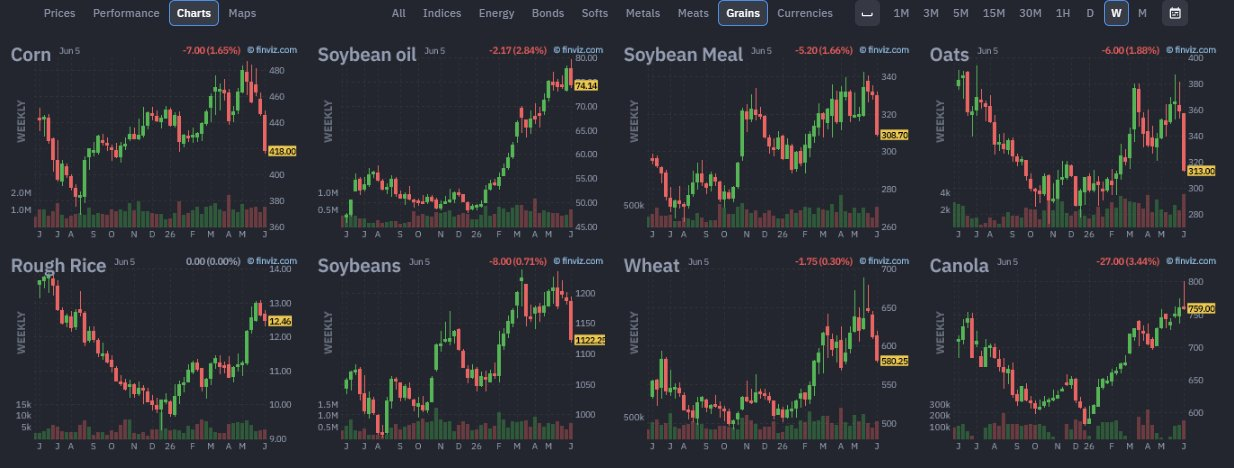
What began as a reversal last week became a broad decline. All eight contracts fell, a sharp change from the prior week’s oilseeds-up split. Oats led the drop at -12.89% near 313, the single largest move among the grains and one of the weakest prints on the board, with Corn -6.55% near 418, Soybean Meal -6.46% near 309, Soybeans -5.50% near 1122 and Wheat -5.00% near 580. Soybean Oil reversed hard at -4.63% near 74.14, giving back the bulk of the prior week’s 5% gain, while Canola fell 0.51% and Rough Rice 1.67%. The shift from a fractured two-way split to a uniform decline is the relevant change: the grains have moved from internal disagreement to a single direction, which is part of why the breadth of trending firmed even as prices fell. A second consecutive down week deepens the reversal off the spring run.
Meats (+0.65% | prev -0.51%)
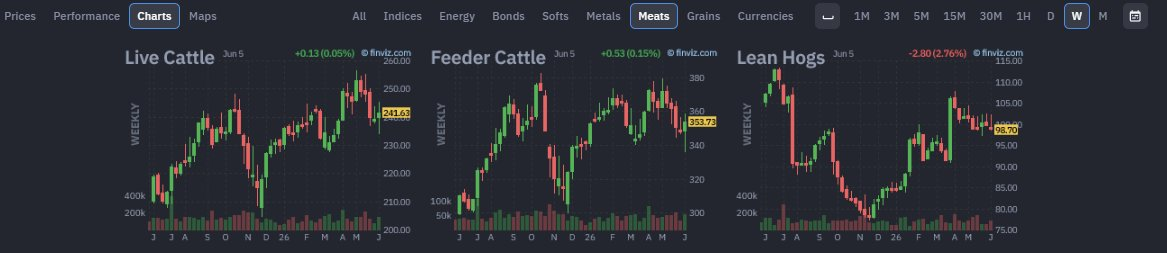
The sector turned higher after two weeks lower, the cattle complex leading. Feeder Cattle rose 1.57% to near 353.70 and Live Cattle 1.09% to near 241.60, while Lean Hogs eased 0.70% to near 98.70, the hogs slipping on Friday even as the cattle held firm. The move reframes the prior fortnight’s decline as a two-week pullback rather than the start of a sustained reversal: the cattle have stepped back up toward the upper part of their multi-month range, and the sector now sits among the firmer corners of the board in a week dominated by declines elsewhere. Meats were one of only two multi-contract sectors to close higher.
Bonds (-0.49% | prev +0.71%)
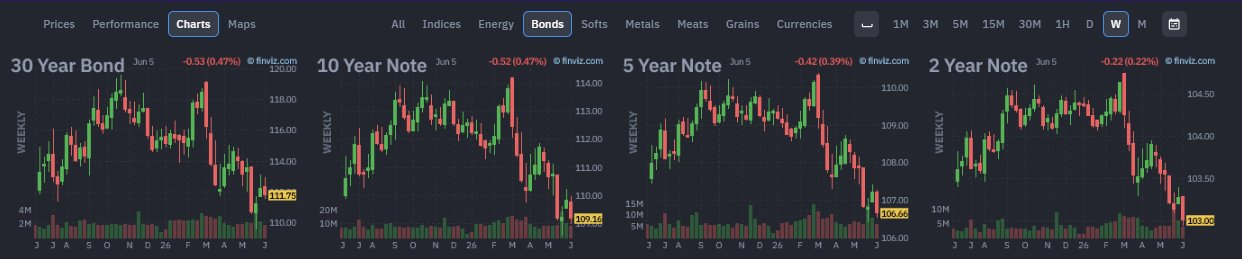
The complex eased across the curve, reversing the prior two weeks of firming. The 10 Year Note fell 0.68% to near 109.16, the 5 Year Note 0.56% near 106.66, the 30 Year Bond 0.42% near 111.75 and the 2 Year Note 0.29% near 103.00, the belly of the curve weakest. The move followed the payrolls report and the repricing toward a possible rate hike: the firmer labour data lifted yields and pulled prices lower, with the bulk of the decline landing on Friday. The recovery that had run since the prior month’s sell-off has paused, the curve giving back its recent gains in a single week. The reversal sat in line with the firmer dollar and the broader move out of risk and rate-sensitive assets.
Currencies (-1.22% | prev +0.41%)
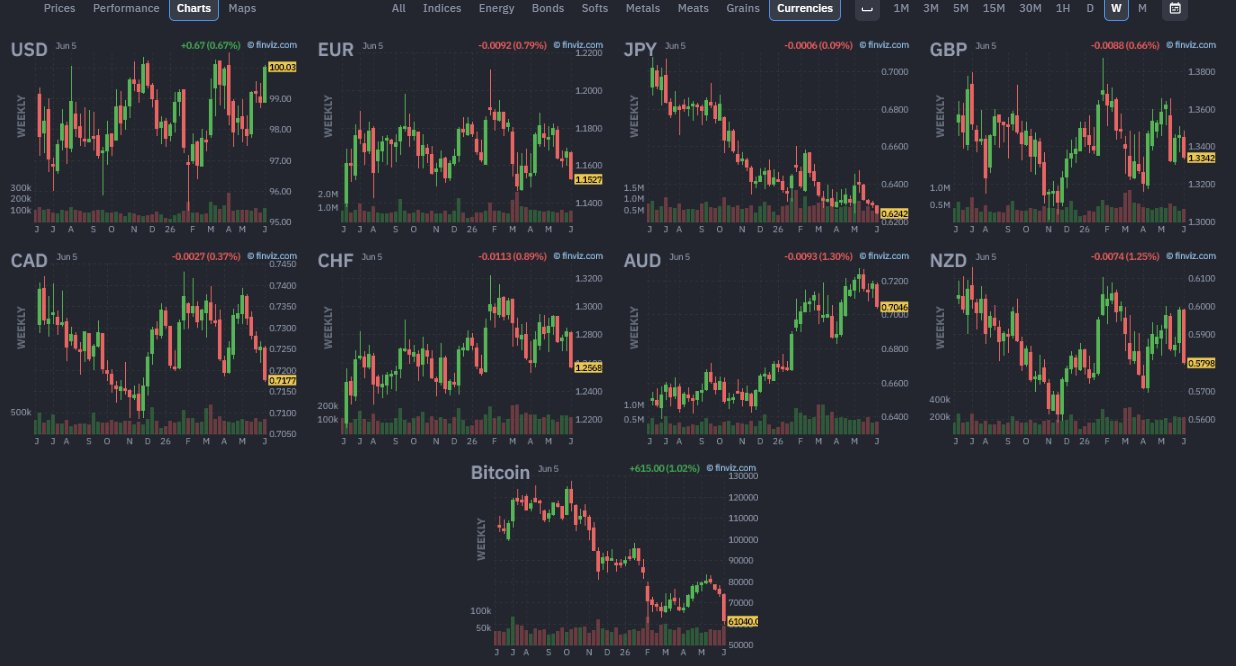
The dollar reversed sharply higher, unwinding the prior two weeks of softness. The USD index rose 1.21% back above 100 to near 100.03, and every other currency in the basket fell against it: NZD led the decline at -3.16%, with CHF -1.98%, AUD -1.92%, EUR -1.25%, CAD -1.13%, GBP -0.93% and JPY -0.62% all lower. The sector average of -1.22% reflects that broad move down in the non-dollar pairs rather than weakness in the dollar itself, which was among the firmest assets of the week. The driver was the same payrolls-led repricing toward higher US rates that lifted yields: a firmer rate path pulled the dollar back up and reversed the commodity-currency leadership of the prior fortnight. The basket has flipped from the weak-dollar tilt of late May back toward dollar strength in a single week.
Volatility, Crypto: VIX rose 8.99% to near 19.65, reversing two weeks of decline, with the bulk of the gain in Friday’s 12.78% jump as the equity selloff pulled implied volatility back up off its lows. Bitcoin fell 16.94% to near 61,040, the single weakest contract on the board and its sharpest week since the winter. The decline was front-loaded across the first half of the week rather than a Friday event: reports tied the move to record outflows from spot Bitcoin funds, a first sale of Bitcoin in years by a large corporate holder, and a sizeable transfer from a long-dormant wallet, with leveraged long positions liquidated as the price fell toward 61,000. Bitcoin now sits roughly 51% below its October 2025 high and has continued to track its own downtrend rather than the equity tape, which only joined the move lower on Friday.
Top Movers
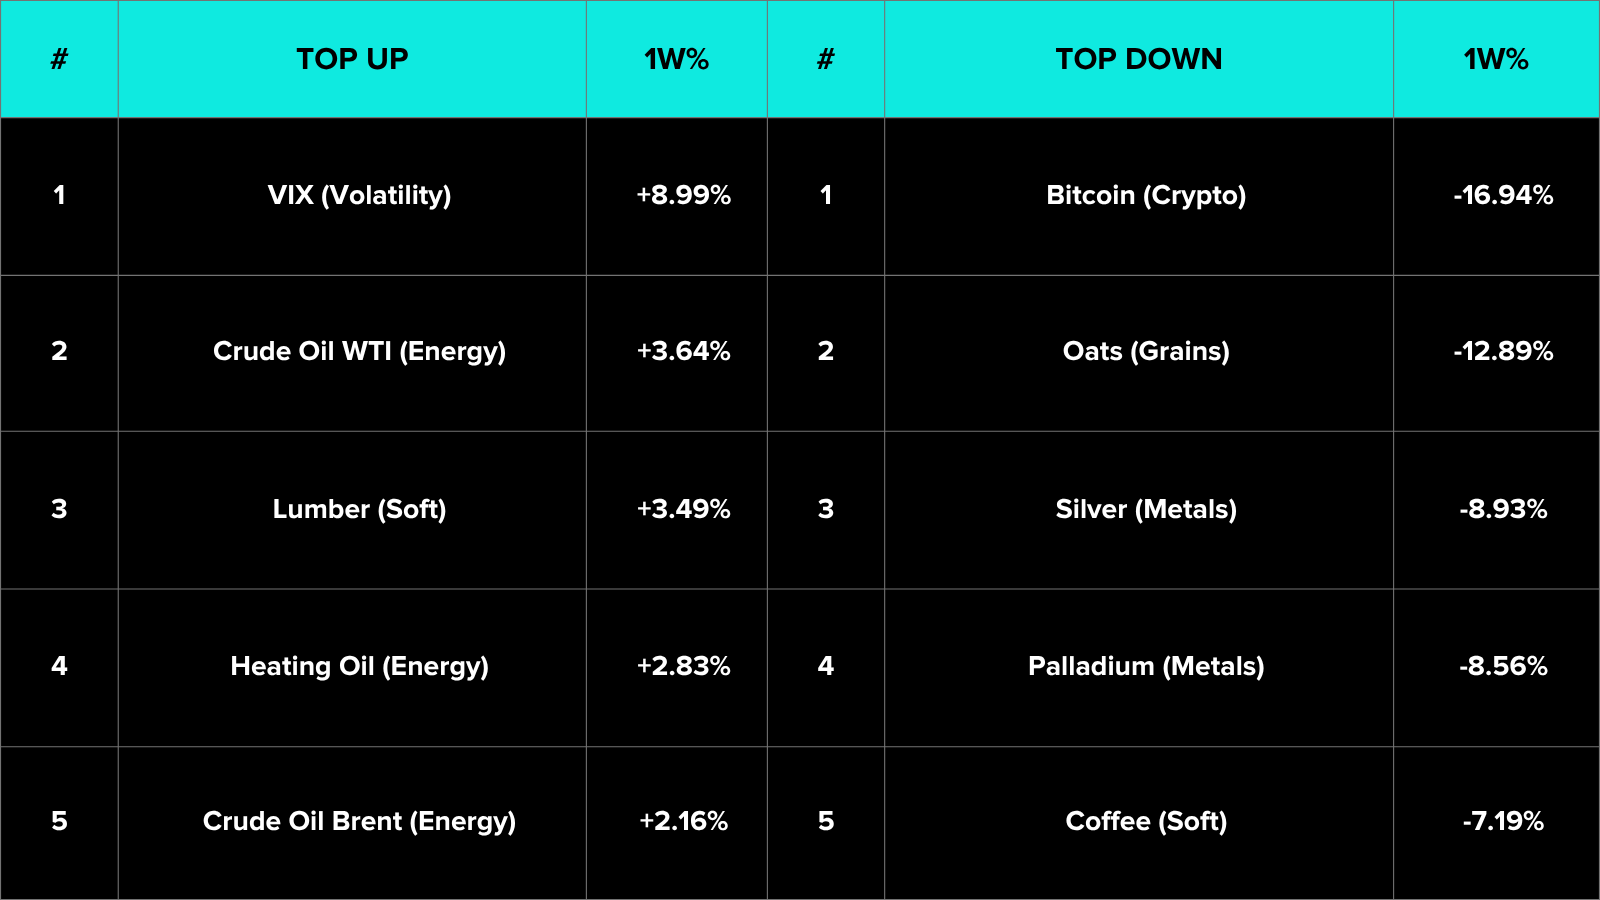
Top five up and top five down by single-week percentage move.
The composition tells a two-sided story, and a more uniform one than last week. The downside list spreads across sectors: Bitcoin leads the declines, followed by Oats, the precious metals pair of Silver and Palladium, and Coffee, four different sectors in the five largest losers. The upside list is narrower and concentrated in the petroleum complex, with Crude Oil WTI, Heating Oil and Crude Oil Brent joining Lumber, while the VIX tops the gainers as the equity selloff lifted volatility. The signal sits in the breadth of the decline: where last week the largest moves ran in opposite directions inside the same sectors, this week the heavy losses spread across crypto, grains, metals and softs at once, which is why the trend-strength reading firmed.
Portfolio View
Portfolios carrying short exposure in the complexes that had been trending lower captured the bulk of the week’s gains. Short crypto extended a position that has worked since January, short grains added as the sector fell across all eight contracts, and short non-dollar currencies benefited as the dollar reversed higher. Long-Equity exposure, which had contributed for several weeks running, became the main detractor as the indices reversed sharply on Friday, and any long-duration positioning built during the prior fortnight’s bond recovery gave back ground as yields rose. The metals breakdown rewarded short exposure but cut against any system still positioned long the precious complex off its multi-month uptrend. The week favoured systems able to hold short the established downtrends, and the directional contribution clustered where moves were broad and synchronised rather than where single sectors split two ways.
Final Reflections
The week ending 5 June 2026 inverted the prior week almost point for point. A hotter-than-expected payrolls report pushed market pricing toward a Federal Reserve that may raise rather than cut, yields rose, the dollar reversed higher, equities and the precious metals broke lower, and a semiconductor and AI selloff drove the sharpest single equity session since April 2025. The TTU Barometer recovered from 32% to 43%, back out of Moderately Weak and into Neutral, the SG Trend Index added 1.35% to reach +11.90% YTD, and contract-level breadth flipped hard to the downside at 12 of 49 positive against 37 negative. The result is the mirror image of late May: where the prior fortnight saw sharp moves fracture into two-way splits, this week saw a single macro catalyst pull market after market in the same direction, and the trend environment firmed as a result.
1. The barometer’s recovery to Neutral confirms that 32% marked a near-term low, and the firmer reading came from the downside, not the upside.
The five-week sequence (43, 57, 45, 32, 43) has retraced its single dip back to the level it held a month ago. The move from Moderately Weak back into Neutral, paired with a rate of change that flipped from Falling Rapidly to Rising Weakly, tilts the evidence toward stabilisation rather than a fresh leg down in the indicator. The mechanism matters more than the level: the reading rose because a broad, synchronised selloff restored the directional alignment that had fractured the prior week, not because conditions turned benign. A market falling together is a stronger trend environment than a market rising in places and falling in others, and that is precisely the shift the barometer captured.
2. A single macro catalyst replaced last week’s internal splits with cross-asset alignment, and the indicators converged as a result.
The payrolls print and the repricing toward higher rates pushed yields up, the dollar up, and equities, metals and rate-sensitive assets down at once, while crypto and grains extended declines already underway. That is the opposite of the prior fortnight, when Energy split petroleum against gas and the grains fractured oilseeds against the rest. The convergence shows in the indicators: the barometer and the SG Trend Index both firmed in the same week, the former because the breadth of trending improved and the latter because the established short trends paid. The steadier opportunity now sits on the short side of the complexes that broke down, with the equity reversal the main open question: whether Friday was a single repricing session or the start of a broader unwind of the multi-month advance.
For trend followers, the week was not defined by whether markets rose or fell. It was defined by whether the moves were persistent enough to be captured. The opportunity was directional, but not directionally biased.
One question defines the week ahead: was Friday’s payrolls-driven selloff a single repricing session that settles as the data is digested, or the first leg of a broader unwind in which the equity advance finally joins the declines already underway across metals, grains and crypto?

List of Resources used in the Week in Review
Important Disclaimers
This document is directly solely to Accredited Investors, Qualified Eligible Participants, Qualified Clients and Qualified Purchasers. No investment decision should be made until prospective investors have read the detailed information in the fund offering documents of any manager mentioned in this document. This document is furnished on a confidential basis only for the use of the recipient and only for discussion purposes and is subject to amendment This document is neither advice nor a recommendation to enter into any transaction. This document is not an offer to buy or sell, nor a solicitation of an offer to buy or sell, any security or other financial instrument. This presentation is based on information obtained from sources that TopTradersUnplugged (“TTU”) (“considers to be reliable however, TTU makes no representation as to, and accepts no responsibility or liability for, the accuracy or completeness of the information. TTU has not independently verified third party manager or benchmark information, does not represent it as accurate, true or complete, makes no warranty, express or implied regarding it and shall not be liable for any losses, damages, costs or expenses relating to its adequacy, accuracy, truth, completeness or use.
All projections, valuations, and statistical analyses are provided to assist the recipient in the evaluation of the matters described herein. Such projections, valuations and analyses may be based on subjective assessments and assumptions and may use one among many alternative methodologies that produce different results accordingly, such projections, valuations and statistical analyses should not be viewed as facts and should not be relied upon as an accurate prediction of future events. There is no guarantee that any targeted performance will be achieved Commodity trading involves substantial risk of loss and may not be suitable for everyone
TTU is not and does not purport to be an advisor as to legal, taxation, accounting, financial or regulatory matters in any jurisdiction. The recipient should independently evaluate and judge the matters referred to herein. TTU does not provide advice or recommendations regarding an investor’s decision to allocate to funds or accounts managed by any manager (“or to maintain or sell investments in funds or accounts managed by any manager, and no fiduciary relationship under ERISA is created by the investor investing in funds or accounts managed by any manager, or through any communication between TTU and the investor
In reviewing this document, it should be understood that the past performance results of any asset class, or any investment or trading program set forth herein, are not necessarily indicative of any future results that may be achieved in connection with any transaction. Any persons subscribing for an investment must be able to bear the risks involved and must meet the suitability requirements relating to such investment. Some or all alternative investment programs discussed herein may not be suitable for certain investors This document is directed only to persons having professional experience in matters relating to investments. Any investment or investment activity to which this document relates is available only to such investment professionals. Persons who do not have professional experience in matters relating to investments should not rely upon this document.
This document and its contents are proprietary information of TTU and may not be reproduced or otherwise disseminated in whole or in part without TTU’s prior written consent.
This document contains simulated or hypothetical performance results that have certain inherent limitations AND SHOULD BE VIEWED FOR ILLUSTRATIVE PURPOSES. Unlike the results shown in an actual performance record, these results do not represent actual trading. HYPOTHETICAL PERFORMANCE RESULTS HAVE MANY INHERENT LIMITATIONS, SOME OF WHICH ARE DESCRIBED BELOW. NO REPRESENTATION IS BEING MADE THAT ANY ACCOUNT WILL OR IS LIKELY TO ACHIEVE PROFITS OR LOSSES SIMILAR TO THOSE SHOWN IN FACT, THERE ARE FREQUENTLY SHARP DIFFERENCES BETWEEN HYPOTHETICAL PERFORMANCE RESULTS AND THE ACTUAL RESULTS SUBSEQUENTLY ACHIEVED BY ANY PARTICULAR INVESTMENT ACCOUNT.
ONE OF THE LIMITATIONS OF HYPOTHETICAL PERFORMANCE RESULTS IS THAT THEY ARE GENERALLY PREPARED WITH THE BENEFIT OF HINDSIGHT IN ADDITION, HYPOTHETICAL TRADING DOES NOT INVOLVE FINANCIAL RISK, AND NO HYPOTHETICAL TRADING RECORD CAN COMPLETELY ACCOUNT FOR THE IMPACT OF FINANCIAL RISK IN ACTUAL TRADING FOR EXAMPLE, THE ABILITY TO WITHSTAND LOSSES OR TO ADHERE TO A PARTICULAR TRADING PROGRAM OR OTHER ASSET.
There are numerous other factors related to the markets in general or to the implementation of any specific trading program which cannot be fully accounted for in the preparation of hypothetical performance results and all of which can adversely affect actual trading results. No representation is being made that any investment will or is likely to achieve profits or losses similar to those being shown.
Most Comprehensive Guide to the Best Investment Books of All Time

Most Comprehensive Guide to the Best Investment Books of All Time
Get the most comprehensive guide to over 600 of the BEST investment books, with insights, and learn from some of the wisest and most accomplished investors in the world. A collection of MUST READ books carefully selected for you. Get it now absolutely FREE!
Get Your FREE Guide HERE!