


Trend Following - Week in Review— April 10, 2026

“Relief, Not Resolution: Equities and Bitcoin Surge, Energy Reverses, and the Barometer Falls to 48%”
This Week in Trend – 10 April 2026
Welcome to This Week in Trend, your weekly view into the evolving structure of global futures markets and the behaviour of systematic trend following. This edition covers conditions through the close of US markets on Friday, 10 April 2026.
Bitcoin surged 9.46%, the best performer across all 49 assets in a powerful risk-on rotation. The Nikkei 225 gained 7.49%, leading all equity indices. Copper advanced 5.42% and Soybean Meal gained 5.27%. Silver rose 4.88%, Euro Stoxx 50 added 4.61%, Nasdaq 100 climbed 4.39%, and Platinum gained 4.13%. The Russell 2000 rose 3.95%, the S&P 500 advanced 3.52%, and the DAX gained 3.21%. All seven equity indices finished positive, with the sector averaging +4.31%, their strongest sector week in this report. The metals sector averaged +3.78%, with all five contracts positive for a second consecutive week.
The VIX collapsed 16.64%, the worst performer across all 49 assets, confirming a decisive shift in sentiment as equity fear unwound sharply. Heating Oil fell 13.75%, Crude Oil WTI declined 13.42%, and Crude Oil Brent dropped 12.68%, a dramatic reversal of last week’s energy surge as markets priced out part of the Gulf supply-shock premium on ceasefire optimism. Gasoline RBOB fell 7.62% and Natural Gas dropped 5.43%. The energy sector averaged -9.32%, the weakest sector by a substantial margin. Grains were broadly negative, averaging -1.78%, with Wheat falling 4.55% and Rough Rice, Oats, and Canola each declining more than 3%. Sugar declined 8.33%. Coffee advanced 1.81% and Cotton gained 3.15%, providing the soft commodity complex with its only meaningful positive contributions.
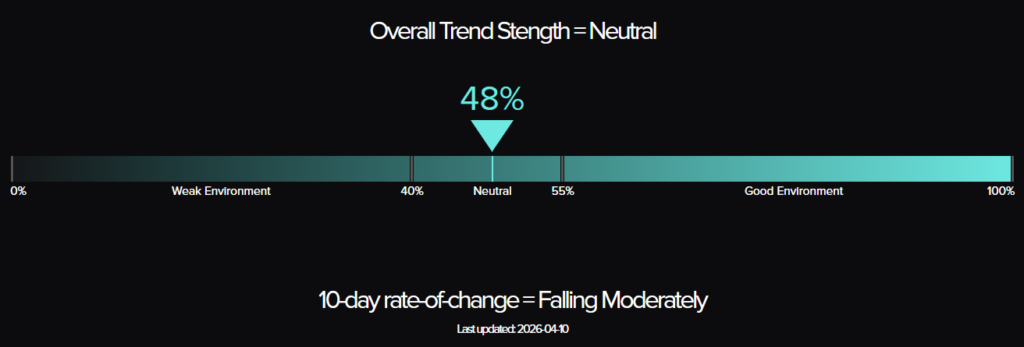
The TTU Trend Barometer fell from 55% to 48%, a drop of seven percentage points that moves the reading deeper into Neutral territory. The 10-day rate of change is “Falling Rapidly,” the most concerning momentum reading in several weeks. The SG Trend Index stands at +0.08% month-to-date for April and +7.16% year-to-date. This improvement is consistent with the broad equity and crypto surge partly offsetting the energy reversal, though the near-flat month-to-date figure after two weeks of extraordinary two-way volatility reflects the degree to which opposing moves have largely cancelled each other in net terms.
This was a relief week, not a resolution week. Equities and Bitcoin surged on ceasefire optimism, energy reversed sharply as markets priced out part of the Gulf supply-shock premium, metals held their constructive structure for a second consecutive week, and the TTU Barometer at 48% reminded systematic managers that violent rotation across sectors is not the same thing as durable trend breadth.
SG Trend Index Performance
Month to date: +0.08 percent
Year to date: +7.16 percent
Prior week reading (as of 3 April 2026):
Month to date: -0.15 percent
Year to date: +6.92 percent
The SG Trend Index has improved to +0.08% month-to-date for April and +7.16% year-to-date, up from -0.15% month-to-date and +6.92% year-to-date last week. The direction of improvement is consistent with the broad equity and crypto surge of this week providing a positive contribution to systematic portfolios, partially offset by the heavy losses in energy as petroleum contracts reversed sharply. The year-to-date reading of +7.16% is a further advance on the solid foundation established through the first quarter, and the MTD result of +0.08% after two weeks of extraordinary two-way volatility suggests that systematic portfolios have broadly navigated the April opening in near-neutral net terms.
The week’s relief-driven rotation has produced sharply different outcomes across sectors. Long equity exposure is likely the primary positive contributor this week, with seven indices averaging +4.31% and Bitcoin surging 9.46%. The metals complex, positive for a second consecutive week, appears to have provided a further constructive contribution. Against these, long energy positions established during last week’s surge have been the primary detractor, with the sector averaging -9.32% as markets priced out part of the Gulf supply-shock premium on ceasefire optimism. Grains and soft commodities added further drag, with sugar declining 8.33% and six of eight grains contracts finishing lower.
The TTU Barometer’s fall to 48% with a “Falling Rapidly” rate of change is the relevant forward-looking context for the SG Trend Index. The direction of the index over the coming weeks will depend on whether energy stabilises into a sustained directional structure or continues to whipsaw, and whether the equity recovery builds sufficient duration to generate medium-term trend signals. The near-neutral MTD result for April reflects a genuinely mixed signal environment, not a directional verdict.
TTU Trend Barometer
Current reading: 48 percent
Previous reading: 55 percent
10-day rate of change: Falling Rapidly
The TTU Trend Barometer fell from 55% to 48%, a drop of seven percentage points in a single week that moves the reading deeper into Neutral territory. The 10-day rate of change has deteriorated from “Falling Weakly” last week to “Falling Rapidly” this week, a meaningful escalation in the pace of barometer deterioration. This is the second consecutive week of significant decline: from 66% two weeks ago, to 55% last week, to 48% this week, a cumulative fall of eighteen percentage points across a fortnight. At 48%, the barometer remains inside the Neutral band between 40% and 55%, but the trajectory and rate of change place it on a path toward the 40% threshold that would confirm a transition into a Weak trend environment.
The barometer’s fall to 48% in a week of powerful equity and crypto gains is the key analytical signal. A barometer declining while equity markets post their strongest weekly performance in the current dataset confirms that the gains are not generating durable trend breadth across the systematic universe. The mechanism is the energy complex: last week’s petroleum surge established long energy signals across systematic portfolios. This week’s equally violent reversal, with Crude Oil WTI falling 13.42% and Heating Oil dropping 13.75% as markets priced out part of the Gulf supply-shock premium, has disrupted those signals and created whipsaw conditions across six energy contracts simultaneously. When a sector reverses this violently in consecutive weeks, the disruption to trend breadth overwhelms the positive contributions from seven equity indices and five metals contracts. That is what 48% is measuring.
At 48%, the barometer is below the 55% threshold that separates Neutral from Strong territory, and sitting in the middle of the Neutral band. For systematic managers, a reading at this level with a “Falling Rapidly” rate of change argues for greater caution in position sizing, a preference for the sectors generating the most reliable signals, and patience where whipsaw has disrupted signal quality. The metals complex, positive for two consecutive weeks across all five contracts, offers the most consistent long signals at current barometer levels. The energy complex, having reversed dramatically after last week’s surge, is the primary source of signal disruption and warrants a more selective posture until a sustained directional structure emerges.
The February low of 43% is no longer immediately within reach at 48%, but the “Falling Rapidly” rate of change means further deterioration remains the path of least resistance if market behaviour does not shift. The weeks ahead will reveal whether the equity and crypto recovery builds sufficient duration to generate new positive trend breadth, and whether energy finds a sustained direction after two weeks of extraordinary opposing moves. Until those questions are answered, systematic discipline over aggressive conviction is the appropriate posture.
The Top Traders Unplugged (TTU) Trend Barometer is a proprietary tool that measures the percentage of markets with medium to strong trends. Similar to a thermometer, where 0 degrees Celsius equates to freezing, a TTU Trend Barometer reading below 40% indicates a “cold” environment for trend-following, while readings above 55% signal a “hotter,” more favorable trend environment.
Weekly Asset Class Snapshot
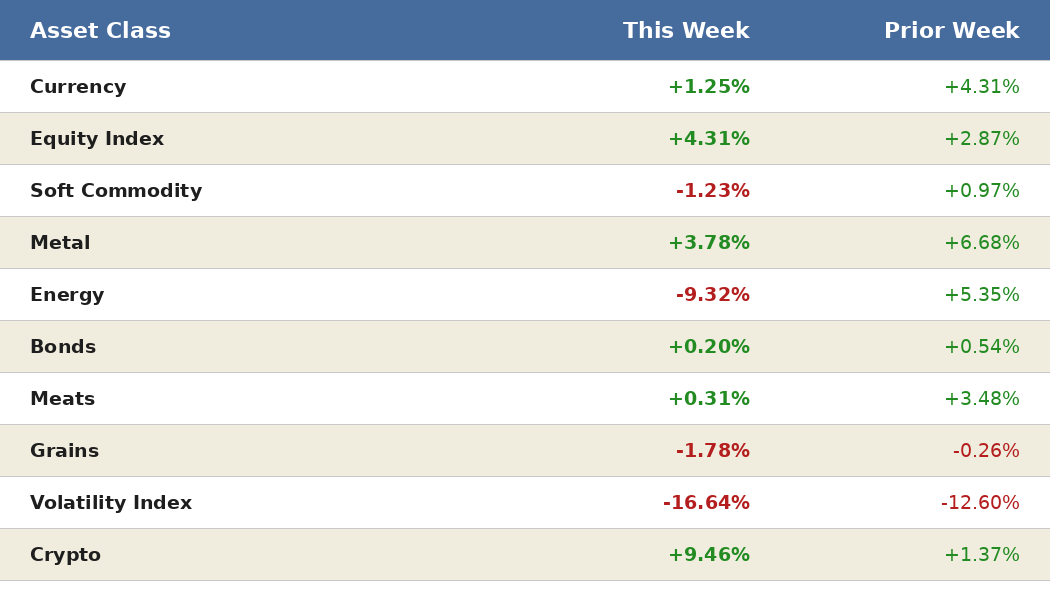
Source: Finviz.com
Energy (-9.32 percent | prev +5.35 percent)
Energy delivered the week’s most dramatic reversal, the sector averaging -9.32% after last week’s extraordinary +5.35% surge. Heating Oil led the declines with a fall of 13.75%, the second-worst performer across all 49 assets. Crude Oil WTI dropped 13.42% and Crude Oil Brent fell 12.68%, reversing a substantial portion of their prior-week gains as markets priced out part of the Gulf supply-shock premium on ceasefire optimism. Gasoline RBOB declined 7.62% and Natural Gas fell 5.43% for a second consecutive week of meaningful losses. Ethanol dropped 3.01%. All six energy contracts finished negative, the mirror image of last week’s near-uniform positive performance. The sector’s -9.32% average is the weakest result across all ten sectors by a substantial margin and confirms that the two-week pattern in energy has been a violent round trip rather than a sustained directional move.
The weekly charts confirm the whipsaw: Crude Oil WTI, Brent, Heating Oil, and Gasoline RBOB each show last week’s large positive candle followed immediately by an almost equally large negative candle. Neither long nor short positions carry conviction from that structure. Natural Gas is the one exception, its steady decline across consecutive weeks providing the only durable directional signal within the sector.
Bonds (+0.20 percent | prev +0.54 percent)
Bonds posted a second consecutive week of small gains, the sector averaging +0.20% after last week’s +0.54%. The 10-year Note gained 0.31%, the 5-year Note edged up 0.22%, the 30-year Bond advanced 0.19%, and the 2-year Note gained 0.09%. All four contracts finished positive. It is worth noting that the weekly bond futures gains sit alongside a backdrop of hotter-than-expected inflation data late in the week, which pushed cash yields higher and created a mixed signal environment for the complex. The weekly positive result for bond futures is the relevant systematic data point, but the interpretation should be cautious: two consecutive small positive weeks do not yet constitute a clear new uptrend, and the inflation backdrop introduces uncertainty about the durability of recent gains.
The weekly charts across the yield curve continue to show cautious recovery from the prior four-week losing streak. Two consecutive positive weeks across all four contracts represent a change of character, and for systematic strategies the signal is shifting from negative to neutral. A third consecutive positive week would provide more meaningful confirmation of a directional change. Until then, the bonds complex warrants monitoring rather than high-conviction positioning.
Soft Commodity (-1.23 percent | prev +0.97 percent)
Soft commodities turned negative this week after two consecutive positive weeks, the sector averaging -1.23% with significant internal divergence. Sugar fell 8.33%, the fifth-worst performer across all 49 assets and a continuation of the established multi-week downtrend. Lumber declined 3.52% and Orange Juice fell 0.98%, ending a powerful two-week recovery sequence. Against these, Cotton gained 3.15%, the most constructive chart in the sector and the twelfth-best performer across all 49 assets. Coffee advanced 1.81% and Cocoa edged up 0.48%. The sector’s negative average masks a genuine split: Cotton and Coffee are generating positive signals while Sugar’s persistent decline and Lumber’s weakness drag the sector result lower.
Cotton continues to be the most reliable uptrend in the sector, its multi-week positive structure intact and confirmed by this week’s 3.15% advance. For systematic strategies, Cotton is the high-conviction long in soft commodities, Sugar is the high-conviction short or flat justification, and the remaining contracts are generating signals that warrant monitoring rather than aggressive positioning.
Metals (+3.78 percent | prev +6.68 percent)
Metals delivered a second consecutive week of positive sector performance, averaging +3.78% after last week’s +6.68%, with all five contracts finishing positive. Copper led the complex with a gain of 5.42%, the third-best performer across all 49 assets. Silver rose 4.88%, Platinum gained 4.13%, Gold advanced 2.30%, and Palladium gained 2.18%. Two consecutive weeks of uniform positive performance across all five metals contracts is the most constructive sector signal in the current report and the most reliable source of multi-contract trend breadth in a week when the barometer is under pressure. The sector’s +3.78% average is the second-best result this week behind only the equity complex.
Gold’s established uptrend continues with authority, the weekly chart showing a sustained series of higher closes. Copper’s 5.42% gain and two-week cumulative advance confirm that the industrial metals bid is strengthening alongside the broader risk-on rotation, consistent with improved global demand expectations. Silver and Platinum are building two-week positive structures that are beginning to generate medium-term trend signals. For systematic strategies, the metals complex is offering some of the most consistent long signals in the current portfolio: two consecutive weeks of broad positive performance across all five contracts, with individual chart structures showing improving medium-term trend quality. In an environment where the barometer is at 48% and falling, that kind of sustained consistency across a full sector carries real analytical weight.
Meats (+0.31 percent | prev +3.48 percent)
Meats moderated sharply from last week’s +3.48% to a near-flat +0.31%, with performance diverging within the complex. Live Cattle led with a gain of 1.17% and Feeder Cattle added 0.47%, both decelerating meaningfully from last week’s powerful advances of 4.91% and 5.37% respectively. Lean Hogs declined 0.72%. The sector’s near-flat result after two strongly positive weeks reflects a pause in momentum rather than a reversal: the underlying multi-week trend structures in Live Cattle and Feeder Cattle remain intact, and a week of consolidation after two large advances is consistent with a healthy trend rather than a signal change.
For systematic trend-following strategies, both cattle contracts retain their positive trend signals at current levels. The deceleration this week reduces short-term conviction but does not alter the medium-term chart structure that has been building across multiple consecutive weeks. Lean Hogs’ 0.72% decline is consistent with its more volatile character and does not change the broader sector assessment.
Grains (-1.78 percent | prev -0.26 percent)
Grains turned more decisively negative this week, the sector averaging -1.78% after last week’s modest -0.26%, with losses broadening across most contracts. Soybean Meal was the notable exception, gaining 5.27%, the fourth-best performer across all 49 assets and a powerful reversal candle within a broadly weak sector. Soybeans gained 1.05%. Against these, Wheat fell 4.55%, the eighth-worst performer across all 49 assets. Rough Rice declined 3.87%, Oats fell 3.84%, Canola dropped 3.14%, Soybean Oil fell 2.68%, and Corn declined 2.49%. Six of eight grains contracts finished negative, with the magnitude of losses across Wheat, Rough Rice, and Oats outweighing the positive contributions from Soybean Meal and Soybeans.
Soybean Meal’s 5.27% gain is the most actionable signal in the grains complex this week: a powerful positive candle that breaks from the sector’s broader weakness. If followed by continuation next week, it becomes a meaningful positive trend signal on the weekly chart. For now it is a watchlist signal rather than a high-conviction position. Wheat’s 4.55% decline extends a pattern of lower lows and is among the more consistent negative signals in the grains complex. For systematic strategies, Soybean Meal is the most actionable emerging positive, while Wheat, Rough Rice, Oats, Corn, Canola, and Soybean Oil are generating negative to neutral signals.
Equity Index (+4.31 percent | prev +2.87 percent)
Equity indices delivered their strongest sector week in this report, averaging +4.31% and building on last week’s +2.87%. The Nikkei 225 led all indices with a gain of 7.49%, the second-best performer across all 49 assets. Euro Stoxx 50 gained 4.61%, Nasdaq 100 advanced 4.39%, Russell 2000 rose 3.95%, the S&P 500 advanced 3.52%, the DAX gained 3.21%, and the DJIA rose 2.99%. All seven equity indices finished positive for a second consecutive week. The VIX collapsed 16.64%, the worst performer across all 49 assets, confirming that the reduction in equity fear was broad and decisive. The relief driving this week’s gains appears to reflect the fragile Gulf ceasefire and optimism ahead of weekend U.S.-Iran talks, with markets pricing out part of the supply-shock premium that had weighed on risk sentiment.
Two consecutive weeks of uniform positive performance across all seven equity indices is a significant breadth signal. The Nikkei 225 continues to show exceptional relative strength, its 7.49% gain this week following last week’s equally powerful advance, making it the highest-conviction chart in the equity complex for systematic strategies. The S&P 500 and Nasdaq 100 are building two-week positive structures that are beginning to repair the prior multi-week downtrend, though the medium-term charts still show lower highs relative to earlier 2026 peaks and a sustained positive structure is not yet confirmed. Critically, the barometer’s continued fall to 48% despite this equity strength confirms that the whipsaw in energy is overwhelming the positive breadth contribution of the equity recovery at the portfolio level.
Currency (+1.25 percent | prev -0.17 percent)
Currencies turned positive this week, the sector averaging +1.25% after last week’s -0.17%, with the USD weakening broadly as risk appetite improved. The AUD led with a gain of 2.72%, consistent with commodity-linked currency strength in a risk-on environment. The NZD gained 2.62%, GBP advanced 2.01%, EUR rose 1.80%, and CHF gained 1.32%. CAD added 0.83% and JPY gained 0.13%. The USD declined 1.42%, one of its more meaningful weekly losses in recent months, as the ceasefire-driven risk-on rotation and a weaker energy complex reduced safe-haven and petrodollar demand. Seven of eight currency contracts finished positive.
The USD’s 1.42% decline suggests that the established dollar-strength trend of prior weeks is under pressure. AUD and NZD gains are consistent with improved risk sentiment and commodity demand expectations. For systematic strategies, the currency complex is undergoing a potential rotation: the USD’s prior strength trend appears to be pausing or reversing, while commodity-linked and European major currencies are generating new positive signals. The breadth of this week’s positive performance across seven of eight contracts is the strongest currency reading in several weeks and warrants monitoring for continuation.
Volatility Index (-16.64 percent | prev -12.60 percent)
The VIX collapsed 16.64%, the worst performer across all 49 assets, accelerating last week’s already significant 12.60% decline. Two consecutive weeks of large VIX falls, totalling approximately 29 percentage points in combined decline, have substantially unwound the fear spike that characterised the prior weeks of energy shock and market disruption. The VIX at its current level is approaching the range that preceded February’s volatility surge, signalling meaningful normalisation of the equity volatility regime.
For systematic strategies, two consecutive weeks of large VIX declines are generating clear negative trend signals for implied equity volatility, and short or flat VIX positioning is supported by the weekly chart structure. The normalisation of the volatility regime is a broadly positive development for systematic equity positioning, consistent with the equity recovery narrative building some durability. The barometer’s continued fall to 48% despite these encouraging equity and VIX dynamics confirms that the signal disruption from the energy whipsaw is the dominant driver of barometer deterioration, not equity behaviour.
Crypto (+9.46 percent | prev +1.37 percent)
Bitcoin surged 9.46%, the best performer across all 49 assets and its largest single-week gain in this report. The weekly chart shows a powerful positive candle that breaks from the prior pattern of lower closes and represents a meaningful shift in the short-term trend structure. Bitcoin’s leadership in a week of broad global equity strength is consistent with the risk-on character of the move, suggesting that crypto is amplifying rather than independently driving the week’s sentiment shift.
A single week of 9.46% gains, while significant, does not yet confirm a sustained trend reversal given the prior multi-week corrective structure. For systematic strategies, Bitcoin’s performance elevates its signal quality and moves it toward watchlist status for long positioning, but confirmation from a second consecutive week of meaningful gains would provide a more reliable systematic signal. The magnitude and direction of this week’s move are unambiguously positive; the question of sustainability is what the coming weeks will answer.
Performance Highlights – This Week’s Market Leaders & Laggards
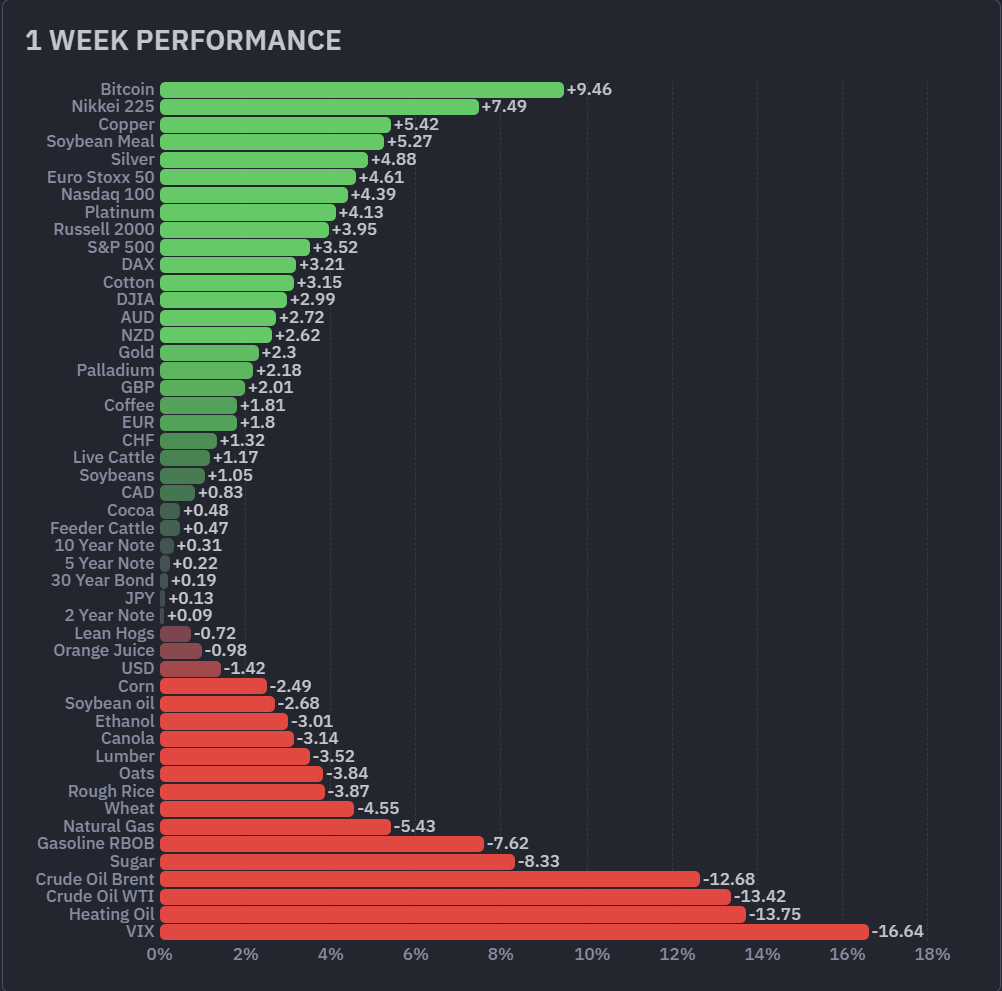
Source: Finviz.com
Top Market Movers
Top Gainers
1. Bitcoin +9.46 percent
Bitcoin surged 9.46% this week, the best performer across all 49 assets. The weekly chart shows a powerful positive candle that breaks from the prior pattern of lower closes. Bitcoin’s outperformance in a broadly risk-on week is consistent with crypto amplifying the global sentiment shift rather than trading on independent dynamics. For systematic strategies, the 9.46% gain elevates Bitcoin’s signal quality and introduces it as a candidate for long positioning, with confirmation from follow-through performance in subsequent weeks the key condition for establishing high conviction.
2. Nikkei 225 +7.49 percent
The Nikkei 225 gained 7.49%, the second-best performer across all 49 assets and the equity index leader for a second consecutive week. Two consecutive weeks of substantial gains are building a medium-term positive trend structure on the weekly chart, and the Nikkei’s sustained relative strength compared to US and European peers makes it the highest-conviction long signal within the equity index sector. For systematic strategies, the trend duration is building, the magnitude of weekly gains is significant, and the chart structure is improving week by week.
3. Copper +5.42 percent
Copper gained 5.42%, the third-best performer across all 49 assets and the leader within the metals complex. Two consecutive weeks of positive performance, with meaningful gains in both, are building a constructive medium-term trend structure. Copper’s strength in a risk-on week is consistent with improved global industrial demand expectations, and its position as the metals sector leader for a second consecutive week makes it the highest-conviction long signal within the metals complex for systematic strategies.
4. Soybean Meal +5.27 percent
Soybean Meal gained 5.27%, the fourth-best performer across all 49 assets and a powerful outlier within a broadly negative grains sector. The 5.27% advance stands in stark contrast to the 4.55% decline in Wheat, the 3.87% fall in Rough Rice, and the 3.84% drop in Oats within the same sector. For systematic strategies, Soybean Meal’s positive candle this week is the most actionable emerging signal in the grains complex, but confirmation from a second consecutive positive week is needed before it becomes a high-conviction long. It is the one contract in the grains sector that warrants close attention over the coming week.
Top Losers
1. VIX -16.64 percent
The VIX collapsed 16.64%, the worst performer across all 49 assets and an acceleration of last week’s 12.60% decline. Two consecutive weeks of large VIX falls are confirming the transition away from the elevated-volatility regime of the prior weeks. For systematic strategies, the weekly chart is generating clear negative trend signals for implied volatility, and the normalisation of the VIX is a constructive development for systematic equity positioning broadly.
2. Heating Oil -13.75 percent
Heating Oil fell 13.75%, the second-worst performer across all 49 assets, following last week’s powerful surge with an almost equally powerful reversal. The two-week round trip leaves the weekly chart in a deeply ambiguous structure: two consecutive extreme opposing candles create whipsaw conditions that are directly hostile to medium-term trend models. For systematic strategies, Heating Oil is among the most signal-disrupted contracts in the universe, and reduced exposure until a more sustained directional structure emerges is the appropriate response.
3. Crude Oil WTI -13.42 percent
Crude Oil WTI declined 13.42%, the third-worst performer across all 49 assets. Last week’s 18.06% surge has been followed by a 13.42% reversal as markets priced out part of the Gulf supply-shock premium on ceasefire optimism. The net two-week change remains positive in nominal terms, but the chart structure created by two consecutive weeks of extreme opposing moves is analytically the most disruptive pattern for systematic trend-following models. Patience while a more sustained directional structure develops is preferable to re-establishing high-conviction positions on the basis of either week’s candle in isolation.
4. Crude Oil Brent -12.68 percent
Crude Oil Brent fell 12.68%, the fourth-worst performer across all 49 assets, following the same narrative as WTI: ceasefire relief reversing last week’s energy surge. The weekly chart shows the same two-week whipsaw structure as WTI, with an extraordinary positive candle last week followed by a large negative candle this week. The analytical conclusion is identical to WTI: the signal quality has reset to near-neutral following consecutive extreme opposing moves, and disciplined patience is the appropriate systematic response.
Portfolio View - Positioning and Impact
Equity index positioning was the week’s dominant positive contributor. Long Nikkei 225 exposure gained 7.49%, long Euro Stoxx 50 added 4.61%, long Nasdaq 100 gained 4.39%, long Russell 2000 advanced 3.95%, long S&P 500 rose 3.52%, long DAX gained 3.21%, and long DJIA rose 2.99%. The sector’s +4.31% average across all seven indices, with no negative contract, makes the equity complex the most uniformly positive contributor this week.
Metals positioning was the second-largest positive contributor for a second consecutive week. Long Copper gained 5.42%, long Silver rose 4.88%, long Platinum advanced 4.13%, long Gold gained 2.30%, and long Palladium added 2.18%. The sector’s +3.78% average with all five contracts positive confirms that diversified long metals exposure is providing a consistent and meaningful positive contribution across consecutive weeks.
Crypto exposure produced a strong single-contract positive. Long Bitcoin gained 9.46%, the best individual performer across all 49 assets. Currency positioning turned positive: long AUD gained 2.72%, long NZD added 2.62%, long GBP rose 2.01%, long EUR gained 1.80%, long CHF added 1.32%, long CAD gained 0.83%, and long JPY rose 0.13%, while USD short or flat positioning benefited from a 1.42% dollar decline. The sector averaged +1.25%.
Energy positioning was the week’s dominant negative contributor by a wide margin. Long Heating Oil lost 13.75%, long Crude Oil WTI declined 13.42%, long Crude Oil Brent fell 12.68%, long Gasoline RBOB dropped 7.62%, long Natural Gas fell 5.43%, and long Ethanol declined 3.01%. The sector that was the portfolio’s strongest contributor last week became its heaviest detractor this week.
Grains positioning was a negative contributor averaging -1.78%, with long Soybean Meal gaining 5.27% and long Soybeans adding 1.05% offset by declines across six other contracts. Soft commodities produced a mixed result: long Cotton gained 3.15%, long Coffee added 1.81%, and long Cocoa edged up 0.48%, while long Sugar fell 8.33%, long Lumber dropped 3.52%, and long Orange Juice declined 0.98%. Meats were near-neutral, with Live Cattle gaining 1.17%, Feeder Cattle adding 0.47%, and Lean Hogs declining 0.72%. Bonds contributed a modest positive across all four contracts. The VIX’s 16.64% collapse created meaningful drawdown for any long volatility exposure.
Final Reflections: Relief, Not Resolution
The week ending 10 April 2026 was a relief week, not a resolution week. The fragile Gulf ceasefire and optimism ahead of weekend U.S.-Iran talks prompted markets to price out part of the supply-shock premium that had sent energy prices surging the prior week. Equities and Bitcoin responded with their strongest weekly performance in this report. Energy reversed dramatically. Metals held their constructive structure for a second consecutive week. And the TTU Barometer fell from 55% to 48%, registering a “Falling Rapidly” rate of change and signalling clearly that violent sector rotation is not the same thing as durable trend breadth. The SG Trend Index stands at +0.08% month-to-date and +7.16% year-to-date, a near-neutral April opening that accurately reflects the degree to which two weeks of opposing extremes have largely cancelled each other in net systematic terms.
Three observations define the week:
1. The barometer at 48% is the week's most important signal, and it is more important because it arrived in a week of extraordinary equity and crypto performance.
Bitcoin surged 9.46%. All seven equity indices averaged +4.31%. The Nikkei 225 gained 7.49% for a second consecutive week. The VIX collapsed 16.64%. And the TTU Barometer fell from 55% to 48% with a “Falling Rapidly” rate of change. The barometer does not measure the size of individual weekly moves. It measures the proportion of markets generating medium to strong trend signals across the full 49-asset universe. When the energy complex delivers +5.35% one week and -9.32% the next, six contracts whipsawing in both directions simultaneously create signal disruption that overwhelms the positive breadth contribution of seven equity indices and five metals contracts. The week’s spectacular performance numbers and the deteriorating trend environment are both real. The barometer is the instrument that holds them in the correct relationship.
2. The metals complex is providing the portfolio's most reliable anchor, and two consecutive weeks of uniform positive performance across all five contracts is the report's most important positive signal.
Gold’s multi-week uptrend continues without interruption. Copper has led the metals complex in both of the past two weeks, its two-week advance consistent with improving global industrial demand expectations. Silver and Platinum are building positive two-week structures. Palladium is recovering from prior weakness. All five metals contracts positive across two consecutive weeks is the kind of broad, sustained, multi-contract positive performance that systematic trend-following strategies are built to capture. Unlike the equity surge, which follows a prior multi-week downtrend and raises questions about whether two recovery weeks are sufficient to establish a new trend, the metals complex has been building positive structure across a longer timeframe with less whipsaw character. In a barometer environment of 48% with a “Falling Rapidly” rate of change, that kind of sustained consistency across a full sector has genuine analytical weight.
3. The energy complex's two-week round trip is the defining portfolio risk event of April's opening fortnight, and its resolution will determine the barometer's direction.
Crude Oil WTI surged 18.06% last week and fell 13.42% this week. Heating Oil surged 6.97% and fell 13.75%. Across six contracts the pattern is identical: extraordinary gains on the Gulf supply shock, followed by dramatic reversals as markets priced out part of that premium on ceasefire optimism. This is not merely a portfolio performance event. It is a signal disruption event. The energy complex had been generating positive trend signals across prior weeks. Last week’s surge reinforced those signals with exceptional force. This week’s reversal has not simply reduced those gains: it has disrupted the trend signal structure of the entire sector. Neither the prior long signals nor new short signals carry conviction from two consecutive weeks of opposing extremes. The barometer’s fall to 48% is the direct expression of this disruption. Until energy stabilises into a new sustained directional structure, the metals complex is the portfolio’s most constructive cluster, the equity and crypto recovery is its emerging signal, and the energy sector is its primary source of noise.
Bitcoin leads all 49 assets with a 9.46% surge. Equities deliver the strongest sector week in the current dataset. Metals post their second consecutive week of uniform positive performance. Energy reverses nearly as sharply as it surged the week before. And the TTU Barometer falls to 48% with a rapidly falling rate of change. The ceasefire that drove this week’s relief remains fragile. The weekend talks remain unresolved. Shipping disruptions persist. The market priced out part of the supply-shock premium, not all of it. The barometer at 48% keeps those extraordinary performance numbers in their correct systematic context: metals are the cleanest signal, energy is the noise, and the weeks ahead will reveal whether this was the start of a new trend or the second half of a round trip.

List of Resources used in the Week in Review
Important Disclaimers
This document is directly solely to Accredited Investors, Qualified Eligible Participants, Qualified Clients and Qualified Purchasers. No investment decision should be made until prospective investors have read the detailed information in the fund offering documents of any manager mentioned in this document. This document is furnished on a confidential basis only for the use of the recipient and only for discussion purposes and is subject to amendment This document is neither advice nor a recommendation to enter into any transaction. This document is not an offer to buy or sell, nor a solicitation of an offer to buy or sell, any security or other financial instrument. This presentation is based on information obtained from sources that TopTradersUnplugged (“TTU”) (“considers to be reliable however, TTU makes no representation as to, and accepts no responsibility or liability for, the accuracy or completeness of the information. TTU has not independently verified third party manager or benchmark information, does not represent it as accurate, true or complete, makes no warranty, express or implied regarding it and shall not be liable for any losses, damages, costs or expenses relating to its adequacy, accuracy, truth, completeness or use.
All projections, valuations, and statistical analyses are provided to assist the recipient in the evaluation of the matters described herein. Such projections, valuations and analyses may be based on subjective assessments and assumptions and may use one among many alternative methodologies that produce different results accordingly, such projections, valuations and statistical analyses should not be viewed as facts and should not be relied upon as an accurate prediction of future events. There is no guarantee that any targeted performance will be achieved Commodity trading involves substantial risk of loss and may not be suitable for everyone
TTU is not and does not purport to be an advisor as to legal, taxation, accounting, financial or regulatory matters in any jurisdiction. The recipient should independently evaluate and judge the matters referred to herein. TTU does not provide advice or recommendations regarding an investor’s decision to allocate to funds or accounts managed by any manager (“or to maintain or sell investments in funds or accounts managed by any manager, and no fiduciary relationship under ERISA is created by the investor investing in funds or accounts managed by any manager, or through any communication between TTU and the investor
In reviewing this document, it should be understood that the past performance results of any asset class, or any investment or trading program set forth herein, are not necessarily indicative of any future results that may be achieved in connection with any transaction. Any persons subscribing for an investment must be able to bear the risks involved and must meet the suitability requirements relating to such investment. Some or all alternative investment programs discussed herein may not be suitable for certain investors This document is directed only to persons having professional experience in matters relating to investments. Any investment or investment activity to which this document relates is available only to such investment professionals. Persons who do not have professional experience in matters relating to investments should not rely upon this document.
This document and its contents are proprietary information of TTU and may not be reproduced or otherwise disseminated in whole or in part without TTU’s prior written consent.
This document contains simulated or hypothetical performance results that have certain inherent limitations AND SHOULD BE VIEWED FOR ILLUSTRATIVE PURPOSES. Unlike the results shown in an actual performance record, these results do not represent actual trading. HYPOTHETICAL PERFORMANCE RESULTS HAVE MANY INHERENT LIMITATIONS, SOME OF WHICH ARE DESCRIBED BELOW. NO REPRESENTATION IS BEING MADE THAT ANY ACCOUNT WILL OR IS LIKELY TO ACHIEVE PROFITS OR LOSSES SIMILAR TO THOSE SHOWN IN FACT, THERE ARE FREQUENTLY SHARP DIFFERENCES BETWEEN HYPOTHETICAL PERFORMANCE RESULTS AND THE ACTUAL RESULTS SUBSEQUENTLY ACHIEVED BY ANY PARTICULAR INVESTMENT ACCOUNT.
ONE OF THE LIMITATIONS OF HYPOTHETICAL PERFORMANCE RESULTS IS THAT THEY ARE GENERALLY PREPARED WITH THE BENEFIT OF HINDSIGHT IN ADDITION, HYPOTHETICAL TRADING DOES NOT INVOLVE FINANCIAL RISK, AND NO HYPOTHETICAL TRADING RECORD CAN COMPLETELY ACCOUNT FOR THE IMPACT OF FINANCIAL RISK IN ACTUAL TRADING FOR EXAMPLE, THE ABILITY TO WITHSTAND LOSSES OR TO ADHERE TO A PARTICULAR TRADING PROGRAM OR OTHER ASSET.
There are numerous other factors related to the markets in general or to the implementation of any specific trading program which cannot be fully accounted for in the preparation of hypothetical performance results and all of which can adversely affect actual trading results. No representation is being made that any investment will or is likely to achieve profits or losses similar to those being shown.
Most Comprehensive Guide to the Best Investment Books of All Time

Most Comprehensive Guide to the Best Investment Books of All Time
Get the most comprehensive guide to over 600 of the BEST investment books, with insights, and learn from some of the wisest and most accomplished investors in the world. A collection of MUST READ books carefully selected for you. Get it now absolutely FREE!
Get Your FREE Guide HERE!