


Trend Following: Week in Review - April 17, 2026

“A Violent Repricing of Geopolitical Risk: Hormuz Opens, the Dollar Falls, and the Barometer Clears 55% into Strong”
This Week in Trend – 17 April 2026
Welcome to This Week in Trend, your weekly view into the evolving structure of global futures markets and the behaviour of systematic trend following. This edition covers conditions through the close of US markets on Friday, 17 April 2026.
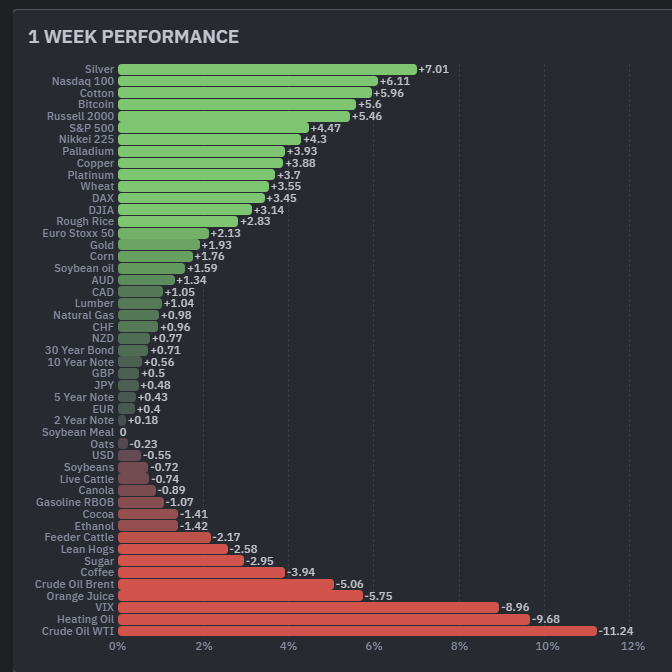
Silver led all 49 assets at +7.01%, the Nasdaq 100 advanced 6.11%, Cotton rose 5.96%, and Bitcoin gained 5.60%. The Russell 2000 climbed 5.46% to a record high. Metals averaged +4.09%, all five contracts higher for a third straight week. Equities averaged +4.15%, all seven indices higher for a second. The unifying thread was a weaker U.S. dollar, which slipped to multi-week lows as oil fell and rate-cut expectations firmed.
Crude Oil WTI fell 11.24%, the worst performer across all 49 assets. The Hormuz reopening stripped out the remaining geopolitical risk premium, and OPEC cut its Q2 2026 demand forecast by 500,000 barrels per day on war-related damage, shifting the market’s focus to softer demand. Heating Oil dropped 9.68%, Brent fell 5.06%. The VIX declined a further 8.96% as equity hedges came off. Orange Juice fell 5.75% after the USDA raised its U.S. orange forecast 4% from March and 7% year-on-year, a clean supply reset. Coffee dropped 3.94%. Softs averaged -1.18% despite Cotton’s 5.96% advance on continuing dry-weather concerns across U.S. growing areas. Meats turned negative at -1.83%.
The TTU Trend Barometer cleared from 48% to 55%, crossing the threshold that separates Neutral from Strong trend territory. The 10-day rate of change reads “Falling Weakly”, a note of caution inside an otherwise constructive reading. The SG Trend Index advanced to +0.87% MTD and +8.01% YTD, a new 2026 high. The violent repricing has settled into cleaner trends.
Duration, equities, metals, and crypto all rallied through the same channel. Oil and volatility fell through it. That is what makes this week different from the last two.
SG Trend Index Performance
Month to date: +0.87 percent
Year to date: +8.01 percent
Prior week reading (as of 10 April 2026):
Month to date: +0.08 percent
Year to date: +7.16 percent
The SG Trend Index advanced to +0.87% MTD and +8.01% YTD, up from +0.08% and +7.16% last week. The MTD reading gained nearly a full percentage point in a single week, and the YTD figure is a new 2026 high. After a fortnight in which opposing weekly candles largely cancelled, systematic portfolios have finally begun to capture sustained directional moves.
Three sectors are doing the heavy lifting: equities long, metals long, energy short. Grains turned net positive for a further breadth contribution. Short USD exposure captured the dollar’s slip. Softs and meats were modest drags.
The barometer has cleared 55%, placing the cycle in a Strong trend environment for the first time in several weeks. The question now shifts: whether this is a clean entry into a sustained Strong reading, or whether the “Falling Weakly” 10-day tilt is an early warning that the level will not hold. April’s +0.87% MTD suggests the environment is delivering the kind of directional moves trend strategies are designed for.
TTU Trend Barometer
Current reading: 55 percent
Previous reading: 52 percent
10-day rate of change: Falling Weakly
The barometer cleared from 52% to 55%, a seven-point recovery across two weeks and entry into the Strong trend band. The sequence now reads 66, 55, 48, 52, 55: sharp fall, full recovery. The 10-day rate of change is “Falling Weakly”, a softening in momentum that sits in quiet tension with the level itself. The reading marks the first Strong-band print since the early-April decline, though the rate-of-change note argues that conviction in the transition should build with confirmation, not precede it.
The mechanism is energy. The prior fortnight delivered +5.35% and then -9.32%: pure whipsaw, hostile to trend models. This week’s -4.58% is different. It is a second consecutive decline, and this time there is a story behind it: Hormuz and OPEC’s demand cut. Short signals have re-established themselves. Combined with three straight weeks of metals strength and two of equity gains, at 55% the barometer has crossed into Strong trend territory. The market is back to tradable structure.
A 55% reading argues for an actively engaged posture across the sectors generating the clearest signals. Metals, with three weeks of uniform strength across all five contracts, are where the long conviction sits. Energy, with two consecutive weekly declines and a clear story behind them, is where the short conviction sits.
The 55% threshold has been cleared. Whether the reading holds, and whether the cycle can push deeper into Strong territory, turns on three things: duration in the equity and metals uptrends, persistence of the energy decline, and how far the dollar weakness runs. The “Falling Weakly” 10-day tilt argues that at least one of those three will need to deliver over the coming fortnight.

The Top Traders Unplugged (TTU) Trend Barometer is a proprietary tool that measures the percentage of markets with medium to strong trends. Similar to a thermometer, where 0 degrees Celsius equates to freezing, a TTU Trend Barometer reading below 40% indicates a “cold” environment for trend-following, while readings above 55% signal a “hotter,” more favorable trend environment.
Weekly Asset Class Snapshot

Source: Finviz.com
Energy (-4.58 percent | prev -9.32 percent)
Energy extended its decline for a second consecutive week, the sector averaging -4.58% after last week’s -9.32%. Iran’s declaration that the Strait of Hormuz was open to commercial shipping removed the remaining geopolitical risk premium, and OPEC’s revised Q2 2026 demand forecast, cut by 500,000 barrels per day on account of war-related economic damage, shifted the market’s focus from supply shock to softer demand fundamentals. Crude Oil WTI led the declines with a fall of 11.24%, the worst performer across all 49 assets, with Reuters reporting that WTI dropped around 11% on Friday alone as the Hormuz declaration landed. Heating Oil dropped 9.68% and Crude Oil Brent fell 5.06%. Ethanol declined 1.42% and Gasoline RBOB fell 1.07%. Natural Gas was the lone positive in the complex, edging up 0.98% after last week’s 5.43% decline. Five of six contracts finished negative for a second consecutive week. The prior fortnight’s two-way round trip has given way to a trend.
The charts have started to cohere. WTI, Brent, and Heating Oil each print two consecutive weekly declines from the Gulf supply-shock peak, the kind of shape systematic models can actually work with. Candle-by-candle disruption is giving way to a downtrend with shape and memory. WTI now sits near 84.00, having retraced a sizeable portion of the supply-shock spike. Natural Gas, after several weeks of steady decline, printed a small positive candle this week. Pause or base is the question, and the next one to two weeks will answer it.
Bonds (+0.47 percent | prev +0.20 percent)
Bonds logged a quiet but telling third consecutive week of gains, the sector averaging +0.47% after last week’s +0.20%. The long end led: 30-year Bond +0.71%, 10-year Note +0.56%, 5-year +0.43%, 2-year +0.18%. All four contracts positive for a third straight week, with the pace modestly accelerating. The mechanics are straightforward. The energy-driven inflation impulse is fading, the dollar is weaker, rate-cut expectations are firming, and duration collects the benefit of all three. Three quiet weeks going the same direction tell a louder story than one noisy one.
The charts are still early-stage: cautiously positive rather than trend-confirmed. Bonds have earned a closer look, not yet a full allocation. A fourth week would settle the matter.
Soft Commodity (-1.18 percent | prev -1.23 percent)
Soft commodities remained negative for a second consecutive week, the sector averaging -1.18% after last week’s -1.23%, with a clearer internal divergence than last week. Cotton surged 5.96%, the third-best performer across all 49 assets, extending its multi-week uptrend. While macro traders were focused on Hormuz and the relief rally, Cotton remained driven by continuing concern about hot, dry conditions across key U.S. cotton areas, and USDA’s April WASDE raised the season-average farm price despite unchanged supply and demand balances. Lumber edged up 1.04%, recovering from last week’s sharp decline. Against these, Orange Juice fell 5.75%, the fourth-worst performer across all 49 assets, after USDA’s April crop report raised the U.S. orange forecast 4% from March and 7% from the prior season, easing the scarcity narrative that had driven prior strength. Coffee dropped 3.94%, extending an ongoing correction from prior highs. Sugar declined 2.95% and Cocoa fell 1.41%.
Cotton is the standout long in softs, with weather-driven momentum independent of the macro pivot. Orange Juice, Coffee, and Sugar line up on the short side. Lumber and Cocoa are noise.
Metals (+4.09 percent | prev +3.78 percent)
Metals logged a third straight positive week, the sector averaging +4.09% after last week’s +3.78%, with all five contracts higher. Silver led the complex at +7.01%, the best performer across all 49 assets. Palladium +3.93%, Copper +3.88%, Platinum +3.70%, Gold +1.93%. The weaker dollar and firming rate-cut expectations were the macro tailwind. Silver and gold got a specific nudge as well: reports that Indian banks halted gold and silver imports on a clearance delay, raising the prospect of near-term supply tightness into festival demand. Three weeks of uniform strength across all five contracts is the most constructive sector signal in the report. This is the kind of advance trend-following is designed around.
Gold’s established uptrend continues, the weekly chart showing a further higher close. Silver’s 7.01% gain extends a three-week advance that is building real medium-term trend authority, and its position as the best performer across all 49 assets this week confirms the acceleration. Copper’s 3.88% gain continues a multi-week advance consistent with improving global industrial demand expectations, reinforced by the weaker dollar. Platinum and Palladium are building three-week positive structures that are generating increasingly reliable medium-term trend signals. For systematic strategies, three consecutive weeks of broad gains across all five contracts now meets the threshold for high-conviction positioning. With the barometer at 55% and the cycle now in Strong territory, this is the report’s single most important positive signal.
Meats (-1.83 percent | prev +0.31 percent)
Meats broke stride at -1.83% after last week’s +0.31%. Lean Hogs fell 2.58%, Feeder Cattle 2.17%, Live Cattle 0.74%. All three contracts lower for the first time in several weeks. Feeder Cattle is the one to watch: the multi-week uptrend that had been building is still intact but now under scrutiny, and a second soft week would start to call it into question.
The cattle uptrend remains intact on the weekly charts. One soft week is a pause, not a verdict. Lean Hogs’ drop fits its usual volatile pattern.
Grains (+0.99 percent | prev -1.78 percent)
Grains flipped to positive at +0.99% after last week’s -1.78%, a near-complete rotation of the complex. Wheat led with a 3.55% gain, a sharp reversal from last week’s 4.55% decline. Rough Rice advanced 2.83%, Corn rose 1.76%, Soybean Oil gained 1.59%. Soybean Meal finished flat after last week’s 5.27% surge. On the other side: Oats -0.23%, Soybeans -0.72%, Canola -0.89%. Five of eight contracts finished positive. The character of the moves matters as much as the sector average: most contracts modestly up rather than a single outlier carrying the week, which points to broader participation than last week’s concentrated Soybean Meal spike.
Wheat’s 3.55% reversal interrupts what had been a steady pattern of lower lows; a second positive week would turn that interruption into a change. Rough Rice is building a base. The sector bias has moved from broadly negative to genuinely mixed, with Canola and Soybeans still the weaker end.
Equity Index (+4.15 percent | prev +4.31 percent)
Equity indices delivered a second consecutive strong sector week, averaging +4.15% after last week’s +4.31%. The Nasdaq 100 led the complex this week with a gain of 6.11%, with Reuters reporting that Wall Street hit fresh highs as lower oil reduced inflation anxiety. The Russell 2000 climbed 5.46% to a record high as cyclicals and small caps benefited from the improved outlook. The S&P 500 added 4.47%, the Nikkei 225 rose 4.30%, the DAX gained 3.45%, the DJIA advanced 3.14%, and Euro Stoxx 50 gained 2.13%. All seven equity indices finished positive for a second consecutive week. The unifying thread was the reopening premium replacing the war premium: Iran’s Hormuz declaration reduced the geopolitical risk overhang, the weaker dollar firmed rate-cut expectations, and the VIX collapsed a further 8.96% as equity hedges were unwound.
Two consecutive weeks of uniform gains across all seven indices is a real breadth signal. The Russell 2000’s record high matters most: small caps, which lagged for much of 2026, are now participating fully. The Nasdaq 100’s 6.11% extends a two-week run that repairs a meaningful portion of the prior downtrend.
Currency (+0.62 percent | prev +1.25 percent)
The dollar story is the spine of the week, and it continues to drive broadly across the complex. Currencies posted a second consecutive positive week, the sector averaging +0.62% after last week’s +1.25%, as the U.S. dollar extended its slide to multi-week lows on improved risk appetite, lower oil, and firming rate-cut expectations. The AUD led at +1.34%, consistent with commodity-linked strength on a risk-on tape. CAD +1.05%, CHF +0.96%, NZD +0.77%, GBP +0.50%, JPY +0.48%, EUR +0.40%. The USD declined 0.55%, its second consecutive weekly decline and confirmation of a multi-week shift away from the dollar-strength trend that dominated earlier in 2026. Seven of eight currency contracts finished positive.
The USD’s two-week cumulative decline of around 2% ends the dollar-strength regime of earlier 2026. Breadth across commodity and European majors, rather than a single-catalyst pop, points to a genuine regime change rather than a one-off move. Short USD paired with long AUD and CAD is how the theme expresses itself most directly.
Volatility Index (-8.96 percent | prev -16.64 percent)
The VIX fell 8.96%, extending last week’s 16.64% decline for a third consecutive week of meaningful losses. The cumulative three-week decline is approximately 36 percentage points, representing the most sustained volatility normalisation in the current dataset. Equity hedges continued to be unwound as the reopening premium replaced the war premium, and the VIX now trades near 20.40, at levels consistent with a normal equity volatility regime. The fear spike that characterised the prior period of energy shock and market disruption has been fully reversed.
Three consecutive weeks of VIX declines is a decisive short signal. The regime has normalised, and that normalisation is itself a tailwind for the equity advance.
Crypto (+5.60 percent | prev +9.46 percent)
Bitcoin added 5.60% to last week’s 9.46% surge, a second straight positive week. The two-week advance repairs much of the prior corrective structure and carries the chart back toward the upper end of its recent range. There is no independent crypto story here. Bitcoin is moving with the week’s broader cluster, risk on and dollar down, a passenger on the same pivot as equities, metals, and duration.
Two positive weeks are the confirmation a single candle could not provide. Bitcoin has earned its long signal. A third week removes any remaining doubt.
Performance Highlights – This Week’s Market Leaders & Laggards
Source: Finviz.com
Top Market Movers
Top Gainers
1. Silver +7.01 percent
Silver gained 7.01%, leading all 49 assets and heading a metals complex in its third straight week of uniform gains. The chart is accelerating rather than merely advancing: Silver now trades near 80.93 after a string of higher weekly closes. Behind the move sit a weaker dollar, firming rate-cut expectations, and a specific supply story: Indian banks halted gold and silver imports on a clearance delay, raising the prospect of near-term tightness into festival demand. Three weeks of gains, accelerating momentum, and supportive fundamentals all point the same way.
2. Nasdaq 100 +6.11 percent
The Nasdaq 100 gained 6.11%, the second-best performer across all 49 assets and the equity index leader. The index hit fresh highs as lower oil eased inflation anxiety and the weaker dollar firmed rate-cut expectations, a combination particularly supportive for long-duration growth. Two straight weeks of substantial gains have built a positive structure on the weekly chart, repairing much of the prior corrective decline. Trend duration is building, magnitude is real, and each week reinforces the one before.
3. Cotton +5.96 percent
Cotton gained 5.96%, the third-best performer across all 49 assets and the standout in softs. While macro traders chased Hormuz and the relief rally, Cotton tracked something else entirely: dry-weather concern across key U.S. growing areas, with the USDA’s April WASDE raising the season-average farm price. The weekly chart is breaking into a new higher range with momentum. A clean long, with a crop-specific story that is independent of the week’s macro theme.
4. Bitcoin +5.60 percent
Bitcoin gained 5.60%, the fourth-best performer across all 49 assets and a second straight week of gains after last week’s 9.46% surge. The two-week advance of around 15% repairs a significant chunk of the prior corrective structure. Bitcoin is not running on its own story: it is moving with the same pivot as equities and metals, risk on and dollar down. Two positive weeks settle what one could not.
Top Losers
1. Crude Oil WTI -11.24 percent
Crude Oil WTI fell 11.24%, the worst performer across all 49 assets. Iran’s Hormuz declaration removed what remained of the geopolitical risk premium, and OPEC’s revised Q2 2026 demand forecast, cut by 500,000 barrels per day on war damage, pushed the market’s focus to softer demand. Reuters reported WTI dropped around 11% on Friday alone as the Hormuz news landed. Two straight weekly declines have given the chart its shape back, a sharp improvement in signal quality after the prior fortnight’s round trip.
2. Heating Oil -9.68 percent
Heating Oil fell 9.68%, the second-worst performer across all 49 assets and a second consecutive week of sharp decline after last week’s 13.75% drop. A cumulative two-week fall of around 23% has given the chart its shape back, replacing the round trip of the immediately prior period. A third weak week would settle the short signal entirely.
3. VIX -8.96 percent
The VIX fell 8.96%, the third-worst performer across all 49 assets and a third straight weekly decline. The three-week cumulative fall of around 36 percentage points completes the normalisation of the volatility regime, with the VIX now near 20.40 as hedges came off and markets rotated from war premium to reopening premium. Short VIX is strongly supported by the chart; the decline is itself a tailwind for the equity advance.
4. Orange Juice -5.75 percent
Orange Juice fell 5.75%, the fourth-worst performer across all 49 assets, after the USDA’s April crop report raised the U.S. orange forecast 4% from March and 7% year-on-year, easing the scarcity narrative that had driven prior strength. The weekly chart shows a sustained decline from multi-year highs, tracking the supply reset. A clean short, and a useful bookend to Cotton within the same sector: both driven by crop fundamentals, not the week’s macro theme.
Portfolio View - Positioning and Impact
Long equity indices were again the dominant positive contributor for a second straight week. Nasdaq 100 +6.11%, Russell 2000 +5.46% (record high), S&P 500 +4.47%, Nikkei 225 +4.30%, DAX +3.45%, DJIA +3.14%, Euro Stoxx 50 +2.13%. Sector +4.15% with no negative contract.
Long metals delivered a third straight week of uniform gains. Silver +7.01%, Palladium +3.93%, Copper +3.88%, Platinum +3.70%, Gold +1.93%. Sector +4.09% with all five contracts positive.
Long Bitcoin +5.60% added to last week’s 9.46%, a two-week gain of about 15%. Long majors, short USD extended their run: AUD +1.34%, CAD +1.05%, CHF +0.96%, NZD +0.77%, GBP +0.50%, JPY +0.48%, EUR +0.40%; USD -0.55%. Currency sector +0.62%.
Short energy was a positive for portfolios that re-established the position after the prior fortnight’s round trip. WTI -11.24%, Heating Oil -9.68%, Brent -5.06%, Ethanol -1.42%, Gasoline RBOB -1.07%. Natural Gas rose 0.98%, the lone long positive. Five of six finished negative for a second consecutive week.
Long grains turned positive at +0.99%: Wheat +3.55%, Rough Rice +2.83%, Corn +1.76%, Soybean Oil +1.59%, with modest declines in Canola, Soybeans, Oats. Softs split: Cotton +5.96% and Lumber +1.04% against Orange Juice -5.75%, Coffee -3.94%, Sugar -2.95%, Cocoa -1.41%. Meats negative across all three. Long bonds modest across all four for a third week. Short VIX captured a further 8.96% decline.
Final Reflections: A Violent Repricing of Geopolitical Risk
The week ending 17 April 2026 was a violent repricing of geopolitical risk. The Hormuz reopening and OPEC’s revised demand outlook stripped out what remained of the supply-shock premium. The dollar fell to multi-week lows. Capital rotated hard back into duration, equities, metals, and crypto, while volatility and energy were left behind. The TTU Barometer cleared 55%, entering the Strong trend band for the first time since the early-April decline. The SG Trend Index advanced to +0.87% MTD and +8.01% YTD, a new 2026 high.
Three observations define the week:
1. The barometer has crossed from Neutral into Strong. That transition is the week’s most important signal.
The barometer does not measure the size of weekly moves. It measures how many markets are generating medium-to-strong trend signals across the full 49-asset universe. When energy shifts from two-way whipsaw to sustained directional decline, the signal disruption that had been overwhelming the positive breadth from equities and metals resolves. Short energy becomes reliable again. The barometer rises. Seven points across two weeks, and the cycle has cleared into Strong. The “Falling Weakly” 10-day tilt is the one cautionary note inside an otherwise constructive picture: a reminder that the transition is fresh, not yet entrenched.
2. Metals are the portfolio’s anchor, and three consecutive weeks of uniform strength across all five contracts is now authoritative.
Silver at +7.01% leads all 49 assets and extends an advance now three weeks deep and accelerating. Gold’s uptrend continues. Copper’s advance tracks improving industrial demand. Platinum and Palladium are building structures of their own. The macro tailwind is the weaker dollar and firming rate-cut expectations; the specific tailwind is the reported halt to Indian precious metals imports into festival demand. Uniform strength across a full sector, held for this many weeks, is the signal that trend-following is designed to capture.
3. Energy has resolved from whipsaw into a proper decline, and whether it holds will set the barometer’s ceiling in the near term.
WTI -13.42% then -11.24%. Heating Oil -13.75% then -9.68%. Brent -12.68% then -5.06%. Two consecutive weekly declines across the petroleum complex is no longer a round trip. It is a trend, and it has a story behind it: Hormuz and OPEC. The barometer’s clearance from 48 to 55 across two weeks is the direct expression of that shift. A third weak week in energy would entrench the short signal and give the strong reading room to build.
Was this the week the whipsaw ended? The Hormuz premium came out of oil. The dollar broke lower. Metals ran for a third week, equities for a second, Bitcoin for a second, bonds for a third. The VIX completed its three-week unwind. Energy extended its decline with Hormuz and OPEC behind it. The barometer cleared 55 and crossed into Strong. Metals are where the long conviction sits. Equities and crypto are building genuine durability. One question defines the week ahead: can Strong be held, or will the Falling Weakly tilt pull the cycle back into Neutral.

List of Resources used in the Week in Review
Important Disclaimers
This document is directly solely to Accredited Investors, Qualified Eligible Participants, Qualified Clients and Qualified Purchasers. No investment decision should be made until prospective investors have read the detailed information in the fund offering documents of any manager mentioned in this document. This document is furnished on a confidential basis only for the use of the recipient and only for discussion purposes and is subject to amendment This document is neither advice nor a recommendation to enter into any transaction. This document is not an offer to buy or sell, nor a solicitation of an offer to buy or sell, any security or other financial instrument. This presentation is based on information obtained from sources that TopTradersUnplugged (“TTU”) (“considers to be reliable however, TTU makes no representation as to, and accepts no responsibility or liability for, the accuracy or completeness of the information. TTU has not independently verified third party manager or benchmark information, does not represent it as accurate, true or complete, makes no warranty, express or implied regarding it and shall not be liable for any losses, damages, costs or expenses relating to its adequacy, accuracy, truth, completeness or use.
All projections, valuations, and statistical analyses are provided to assist the recipient in the evaluation of the matters described herein. Such projections, valuations and analyses may be based on subjective assessments and assumptions and may use one among many alternative methodologies that produce different results accordingly, such projections, valuations and statistical analyses should not be viewed as facts and should not be relied upon as an accurate prediction of future events. There is no guarantee that any targeted performance will be achieved Commodity trading involves substantial risk of loss and may not be suitable for everyone
TTU is not and does not purport to be an advisor as to legal, taxation, accounting, financial or regulatory matters in any jurisdiction. The recipient should independently evaluate and judge the matters referred to herein. TTU does not provide advice or recommendations regarding an investor’s decision to allocate to funds or accounts managed by any manager (“or to maintain or sell investments in funds or accounts managed by any manager, and no fiduciary relationship under ERISA is created by the investor investing in funds or accounts managed by any manager, or through any communication between TTU and the investor
In reviewing this document, it should be understood that the past performance results of any asset class, or any investment or trading program set forth herein, are not necessarily indicative of any future results that may be achieved in connection with any transaction. Any persons subscribing for an investment must be able to bear the risks involved and must meet the suitability requirements relating to such investment. Some or all alternative investment programs discussed herein may not be suitable for certain investors This document is directed only to persons having professional experience in matters relating to investments. Any investment or investment activity to which this document relates is available only to such investment professionals. Persons who do not have professional experience in matters relating to investments should not rely upon this document.
This document and its contents are proprietary information of TTU and may not be reproduced or otherwise disseminated in whole or in part without TTU’s prior written consent.
This document contains simulated or hypothetical performance results that have certain inherent limitations AND SHOULD BE VIEWED FOR ILLUSTRATIVE PURPOSES. Unlike the results shown in an actual performance record, these results do not represent actual trading. HYPOTHETICAL PERFORMANCE RESULTS HAVE MANY INHERENT LIMITATIONS, SOME OF WHICH ARE DESCRIBED BELOW. NO REPRESENTATION IS BEING MADE THAT ANY ACCOUNT WILL OR IS LIKELY TO ACHIEVE PROFITS OR LOSSES SIMILAR TO THOSE SHOWN IN FACT, THERE ARE FREQUENTLY SHARP DIFFERENCES BETWEEN HYPOTHETICAL PERFORMANCE RESULTS AND THE ACTUAL RESULTS SUBSEQUENTLY ACHIEVED BY ANY PARTICULAR INVESTMENT ACCOUNT.
ONE OF THE LIMITATIONS OF HYPOTHETICAL PERFORMANCE RESULTS IS THAT THEY ARE GENERALLY PREPARED WITH THE BENEFIT OF HINDSIGHT IN ADDITION, HYPOTHETICAL TRADING DOES NOT INVOLVE FINANCIAL RISK, AND NO HYPOTHETICAL TRADING RECORD CAN COMPLETELY ACCOUNT FOR THE IMPACT OF FINANCIAL RISK IN ACTUAL TRADING FOR EXAMPLE, THE ABILITY TO WITHSTAND LOSSES OR TO ADHERE TO A PARTICULAR TRADING PROGRAM OR OTHER ASSET.
There are numerous other factors related to the markets in general or to the implementation of any specific trading program which cannot be fully accounted for in the preparation of hypothetical performance results and all of which can adversely affect actual trading results. No representation is being made that any investment will or is likely to achieve profits or losses similar to those being shown.
Most Comprehensive Guide to the Best Investment Books of All Time

Most Comprehensive Guide to the Best Investment Books of All Time
Get the most comprehensive guide to over 600 of the BEST investment books, with insights, and learn from some of the wisest and most accomplished investors in the world. A collection of MUST READ books carefully selected for you. Get it now absolutely FREE!
Get Your FREE Guide HERE!