


Trend Following - Week in Review— April 3, 2026
"Energy Explodes, Metals Surge, and Equities Reverse"
This Week in Trend – 3 April 2026
Welcome to This Week in Trend, your weekly view into the evolving structure of global futures markets and the behaviour of systematic trend following. This edition covers conditions through the close of US markets on Friday, 3 April 2026.
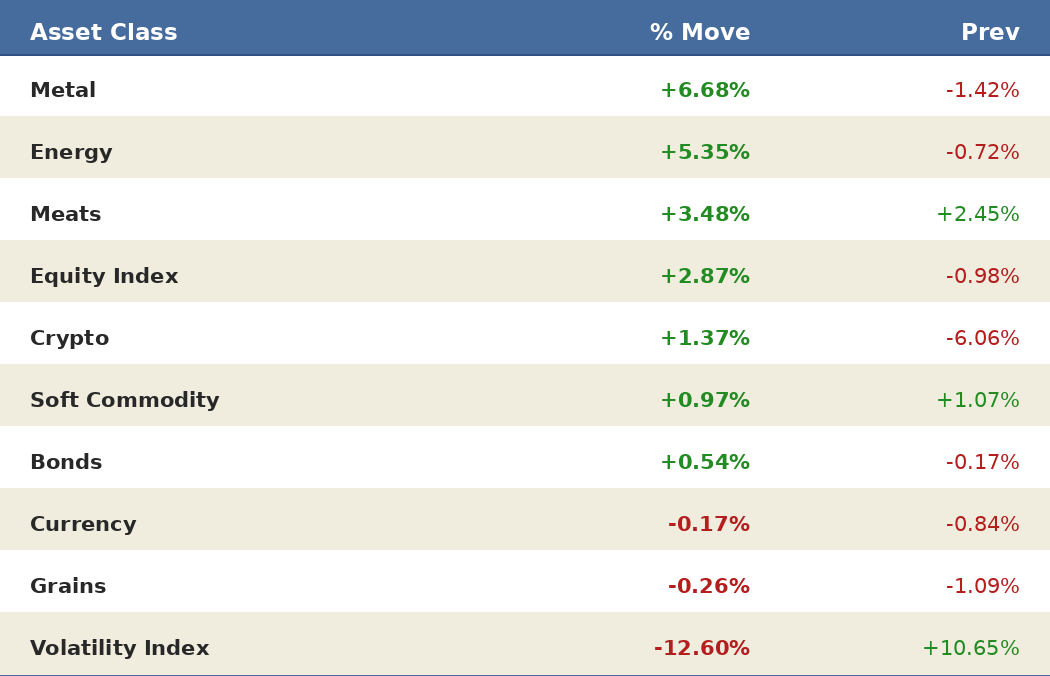
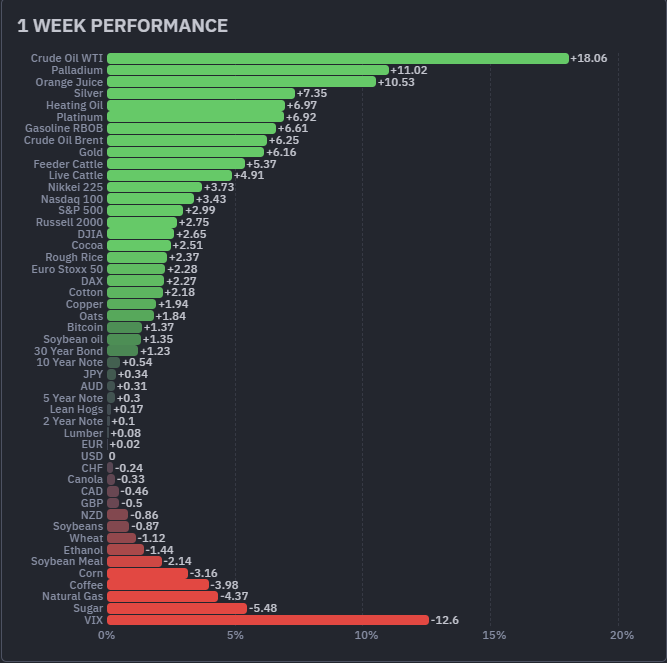
Crude Oil WTI surged 18.06%, the best performer across all 49 assets and the most powerful single-week move in the energy complex in recent memory. Palladium gained 11.02% and Orange Juice advanced 10.53%, extending an already dramatic recovery. Silver rose 7.35%, Heating Oil gained 6.97%, Platinum added 6.92%, Gasoline RBOB climbed 6.61%, and Crude Oil Brent gained 6.25%. Gold added 6.16%, Feeder Cattle rose 5.37%, and Live Cattle gained 4.91%. All seven equity indices finished in positive territory, with the Nikkei 225 gaining 3.73% and the Nasdaq 100 adding 3.43%. The metals sector averaged +6.68% and energy averaged +5.35%, the two strongest sectors of the week by a wide margin.
The VIX collapsed 12.60%, the worst performer across all 49 assets, a dramatic signal that the spike in equity fear from prior weeks partially unwound as markets processed the tariff shock. The tariff shock refers to the one-year anniversary actions of President Trump’s “Liberation Day” of April 2, 2025, when sweeping reciprocal import tariffs were announced on goods from most US trading partners, sending shockwaves through global markets. On April 2, 2026, the administration marked the anniversary by signing fresh executive orders adjusting duties on metals and pharmaceuticals, reigniting commodity volatility. Sugar fell 5.48%, Coffee declined 3.98%, Natural Gas lost 4.37%, and Corn dropped 3.16%. Soybean Meal fell 2.14%. Grains were the weakest commodity sector, averaging -0.26%, with Canola, Soybeans, Wheat, and Corn all finishing in the red. Currencies were mixed: the NZD fell 0.86%, GBP lost 0.50%, and CAD declined 0.46%, while JPY gained 0.34%, AUD added 0.31%, and EUR edged up 0.02%. The USD was flat at 0.00%.
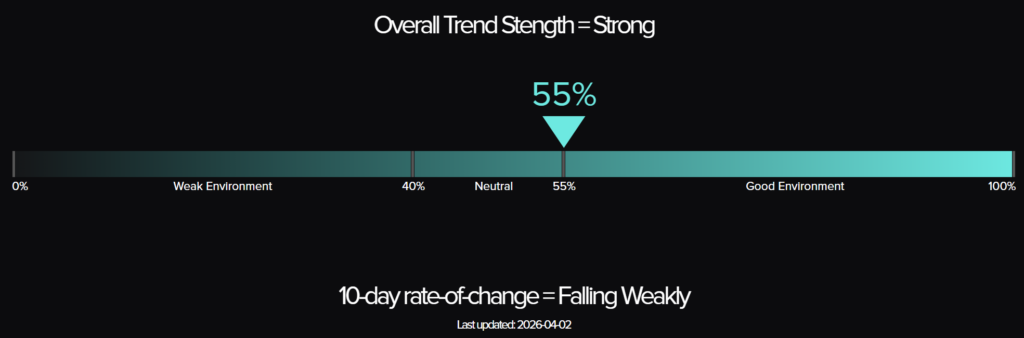
The trend environment is sending a split signal. The TTU Barometer fell from 66% to 55%, dropping eleven percentage points in a single week and retreating to the neutral threshold, with a 10-day rate of change of “Falling Weakly.” The SG Trend Index stands at -0.15% month-to-date after four April trading days and +6.92% year-to-date, improving on March’s close of -1.94% month-to-date and +6.68% year-to-date. The week’s narrative was one of macro shock driving extraordinary commodity strength, with energy and metals exploding higher on tariff-related demand fears, while the barometer’s sharp decline reflects the disruption to trend structure across many markets simultaneously. Breadth contracted sharply, with the barometer’s retreat to 55% signalling that the violent multi-sector repricing is creating confusion rather than clarity for systematic trend signals.
Crude Oil WTI surged 18.06% and led all 49 assets. Metals exploded higher. Equities reversed sharply to the upside. And the TTU Barometer fell from 66% to 55%, a jarring disconnect between raw performance and trend signal quality. The violent repricing driven by the tariff shock is the week’s defining event, delivering spectacular percentage moves that are simultaneously impressive and structurally disruptive. The barometer’s retreat to 55% is the essential reality check: when markets move this fast in this many directions at once, trend breadth suffers even when individual assets produce extraordinary gains.
SG Trend Index Performance
Month to date: -0.15 percent
Year to date: +6.92 percent
March close:
Month to date: -1.94 percent
Year to date: +6.68 percent
The SG Trend Index opens April at -0.15% month-to-date after just four trading days, reflecting the net positive impact of this week’s extraordinary commodity surge on systematic portfolios with broad long exposure across energy and metals. March closed at -1.94% month-to-date and +6.68% year-to-date, with the corrective character of March driven by equity weakness, mixed metals, and uniform currency declines across the final weeks of the month. The year-to-date reading has now improved to +6.92%, a meaningful recovery from March’s close, as the energy and metals explosion of this first week of April has more than offset the month’s modest carry costs. The April month-to-date figure of -0.15% after four days is an early and tentative reading, and its direction over the coming weeks will depend heavily on whether the tariff-driven commodity surge of this week sustains or partially retraces.
This week’s dynamic is defined by a macro shock of unusual magnitude. The tariff-driven commodity explosion delivered some of the largest single-week moves seen in years across the energy and metals complex. Crude Oil WTI surged 18.06%, Palladium gained 11.02%, Silver rose 7.35%, Heating Oil added 6.97%, Platinum gained 6.92%, Gasoline RBOB climbed 6.61%, Crude Oil Brent added 6.25%, and Gold rose 6.16%. The metals sector averaged +6.68% and energy averaged +5.35%, together providing an extraordinary positive contribution for systematic long positions in both complexes. Against these gains, the VIX collapsed 12.60%, Sugar fell 5.48%, Coffee declined 3.98%, Natural Gas lost 4.37%, and Corn dropped 3.16%. Grains averaged -0.26% and currencies were modestly mixed. Equities reversed sharply higher across all seven indices, with the sector averaging +2.87%, providing an additional positive contribution for the week.
The year-to-date reading of +6.92% is a solid foundation, improving on March’s close of +6.68% as this week’s commodity explosion has added to the year-to-date base. The April month-to-date figure of -0.15% after just four trading days is a near-neutral starting point for the new month. The critical nuance is the TTU Barometer’s sharp fall to 55%, which signals that the violent repricing across markets is disrupting trend structure even as it delivers large raw percentage moves. Systematic managers with established long energy and metals positions will have benefited substantially this week, but the barometer’s retreat to 55% with a “Falling Weakly” rate of change is a caution signal: the quality of trend signals is deteriorating even as recent positions perform. The SG Trend Index’s near-flat April opening confirms that the net result is positive, but the environment is becoming more complex to navigate.
TTU Trend Barometer
Current reading: 55 percent
Previous reading: 66 percent
10-day rate of change: Falling Weakly
The TTU Trend Barometer fell from 66% to 55%, a sharp retreat of eleven percentage points in a single week that returns the reading to the neutral threshold and registers a 10-day rate of change of “Falling Weakly.” This is a significant reversal from last week’s “Rising Moderately” rate of change, which had been the strongest barometer momentum reading in several weeks. The drop of eleven percentage points in a single week reflects the disruption to trend breadth caused by the week’s tariff-driven macro shock: when markets reprice violently across multiple sectors simultaneously, trend signals become confused even when raw percentage moves are extraordinary. The barometer has now traced a sharp recovery and partial reversal arc: from its February low of 43%, rising to 61%, pulling back to 55%, stabilising at 57%, accelerating to 66%, and now retreating to 55%, a pattern that reflects a trend environment still within “Strong” territory but showing meaningful fragility at current levels.
The barometer’s retreat to 55% reflects the disruptive nature of this week’s macro shock rather than a broad deterioration in individual market trends. The tariff-driven repricing produced extraordinary one-week moves: Crude Oil WTI surging 18.06%, Palladium gaining 11.02%, Silver rising 7.35%, and Gold adding 6.16% are all large enough to create new trend signals but also volatile enough to disrupt prior established signals in adjacent markets. On the positive side, the energy complex is generating powerful new directional signals with four of six contracts finishing strongly higher. Metals are similarly generating renewed positive signals across the complex. Equity indices reversed sharply higher across all seven markets, the sector averaging +2.87%, which on its own would be constructive, but the speed and size of the reversal from prior weekly lows creates signal confusion on medium-term trend timeframes. The VIX’s 12.60% collapse to 24.90 is a counter-signal to the prior weeks’ negative equity trend. The barometer’s fall to 55% is the direct expression of these competing and rapidly shifting signals across the universe.
At 55% with a “Falling Weakly” rate of change, the barometer is sitting precisely at the threshold between “Strong” and “Neutral” territory. The retreat from 66% to 55% in a single week, combined with a weakening rate of change, is a more important signal than the headline number alone. It confirms that trend breadth has not simply paused but has actively contracted, with a meaningful reduction in the number of markets generating medium to strong trends across the systematic universe. The critical observation is that this deterioration arrived in a week of extraordinary commodity performance: Crude Oil WTI surged 18.06% and metals exploded higher, yet the barometer fell. That divergence between raw performance and trend signal quality is the defining analytical tension in this report. Large and rapid price moves, particularly reversals from prior multi-week declines, disrupt the established trend signals that the barometer measures. The environment remains technically classified as “Strong,” but at exactly 55% and with a falling rate of change, that classification is precarious.
The barometer’s trajectory now tells a more complex story: from 43% in February, recovering to 61%, pulling back to 55% and 57%, accelerating to 66%, and now retreating to 55% with a “Falling Weakly” rate of change. This is a trend environment being tested by an unusual macro event. The tariff shock has produced a week where the direction of individual moves is clear but the sustainability and consistency required for medium-term trend signals is uncertain. If energy holds its extraordinary gains and begins to build a new, sustained directional structure, and if metals continue to advance from their repriced levels, the barometer has a path back toward 60% and higher. But if this week’s commodity surge proves a one-week shock rather than the beginning of an extended trend, the barometer could deteriorate further toward the 40% threshold. The “Falling Weakly” rate of change at 55% is a caution signal that warrants attentive risk management. Systematic positioning remains appropriate, but the barometer’s retreat to the neutral threshold this week requires that confidence in position sizing be tempered by the recognition that signal quality has declined even as recent performance has been positive.
The Top Traders Unplugged (TTU) Trend Barometer is a proprietary tool that measures the percentage of markets with medium to strong trends. Similar to a thermometer, where 0 degrees Celsius equates to freezing, a TTU Trend Barometer reading below 40% indicates a “cold” environment for trend-following, while readings above 55% signal a “hotter,” more favorable trend environment.
Weekly Asset Class Snapshot
Source: Finviz.com
Energy (+5.35 percent | prev -0.72 percent)
Energy delivered the most explosive sector performance in recent memory, with the sector averaging +5.35% as the petroleum complex surged on tariff-driven demand shock fears. Crude Oil WTI led all 49 assets with an extraordinary gain of 18.06%, closing at 112.06 on the weekly chart. Crude Oil Brent advanced 6.25% to 109.24. Heating Oil surged 6.97% to 4.4315 and Gasoline RBOB climbed 6.61% to 3.2790, both reversing last week’s corrective declines with force. Ethanol declined 1.44% to 1.9950, a counter-trend move within the broader energy surge. Natural Gas was the weakest contract in the sector, falling 4.37% to 2.8070, continuing its trendless and volatile pattern. Four of six energy contracts finished positive, with the sector’s +5.35% average recovering sharply from last week’s -0.72% and marking one of the most powerful single-week sector performances in this report’s history.
The weekly charts across the energy complex tell a story of powerful breakout extension rather than consolidation. Crude Oil WTI at 112.06 has produced the largest single weekly candle in the current dataset, a vertical surge that completely overwhelms the prior week’s modest pullback and reasserts the dominant uptrend with exceptional force. The weekly chart shows price breaking decisively above the prior range, and the 18.06% gain is a trend acceleration signal, not a new trend initiation. Crude Oil Brent at 109.24 is showing a similarly powerful weekly candle, the 6.25% gain confirming broad energy strength beyond the WTI contract. Heating Oil at 4.4315 and Gasoline RBOB at 3.2790 have both fully reversed last week’s corrective declines and are resuming their uptrends with large positive candles. For systematic trend-following systems, the energy complex is now generating some of the strongest directional signals in the entire 49-asset universe, with four of six contracts in clear uptrends supported by this week’s extraordinary price action. Ethanol at 1.9950 declined 1.44%, a notable divergence from the broader petroleum surge. Natural Gas at 2.8070 remains the weakest chart in the sector, its continued decline confirming the trendless and choppy character that has persisted for several weeks. The energy sector is the dominant positive contributor to the barometer at current levels.
Bonds (+0.54 percent | prev -0.17 percent)
Bonds turned positive this week after four consecutive weeks of losses, with the sector averaging +0.54% as a flight-to-quality bid emerged alongside the week’s macro uncertainty. The 30-year bond gained 1.23% to 113.53 on the weekly chart, the strongest performer in the complex. The 10-year note advanced 0.54% to 119.77. The 5-year note edged up 0.30% to 107.96, and the 2-year note gained a modest 0.10% to 103.63. The uniform positive performance across the yield curve marks the first positive week for all four bond contracts after four consecutive weeks of declining prices, a meaningful shift in character that warrants monitoring for continuation.
For systematic trend-following systems, four consecutive weeks of bond declines had established a clear negative bias across the yield curve. This week’s uniform positive turn is the first signal that the downtrend may be losing momentum. The 30-year bond at 113.53 is showing the strongest weekly candle in the complex, its 1.23% gain the most decisive positive in four weeks. The 10-year note at 119.77 has recovered meaningfully from recent lows, and the weekly candle is constructive. The dynamic this week is a classic tariff-shock flight-to-quality: as energy prices surge and equity markets whipsaw, bonds benefit from safe-haven demand that temporarily overwhelms the inflationary pressure of higher commodity prices. Whether this positive week represents a genuine trend reversal or a one-week relief rally will be determined in the coming weeks. For now, the bonds complex has printed its first positive week in five, and the deceleration in the prior downtrend combined with this week’s recovery is a development that systematic managers should monitor closely.
Soft Commodity (+0.97 percent | prev +1.07 percent)
Soft commodities maintained a positive sector average for a second consecutive week, averaging +0.97% though with significant internal divergence. Orange Juice extended its recovery with a further gain of 10.53% to 199.45 on the weekly chart, following last week’s 9.32% surge and establishing a powerful two-week recovery from the prior crash. Cocoa advanced 2.51% to 3250.00, a constructive reversal from recent declines. Cotton gained 2.18% to 70.88, continuing its orderly uptrend. Lumber edged up a modest 0.08% to 596.00. Against these gains, Coffee fell 3.98% to 295.95, the sector’s weakest performer and a meaningful reversal from recent highs. Sugar declined 5.48% to 14.96, extending its corrective drift and ranking as the second-worst performer across all 49 assets this week. The sector average of +0.97% is a marginal pullback from last week’s +1.07%, with orange juice’s continued surge masking meaningful weakness in coffee and sugar.
Orange Juice at 199.45 is now completing a remarkable two-week recovery: from the prior crash low, two consecutive weeks of gains totalling nearly 20% have restored the weekly chart to a constructive structure. The price is approaching levels that preceded the original collapse, and if the recovery continues, the weekly chart will have largely repaired the damage from the spike-and-crash sequence. For systematic strategies, the two-week pattern is now beginning to generate positive trend signals on shorter timeframes, and the sustained recovery is more actionable than the initial bounce of last week. Cotton at 70.88 continues to be the most reliable uptrend in the soft commodity complex, its orderly weekly candle building on the prior constructive structure without the violent oscillations seen in orange juice. Cocoa at 3250.00 is showing a positive reversal candle this week after a period of corrective drift, a tentative sign that the selling pressure may be abating. Coffee at 295.95 is pulling back from its recent surge and the weekly chart is showing conflicting signals, neither a confirmed downtrend nor a clean recovery. Sugar at 14.96 continues its multi-week decline, the weekly chart showing lower lows and a consistent negative structure that is generating clear negative signals for systematic strategies.
Metal (+6.68 percent | prev -1.42 percent)
Metals delivered an extraordinary week, the sector averaging +6.68% as the complex surged on tariff-driven safe-haven demand and commodity repricing. Palladium led the complex with a gain of 11.02% to 1515.00 on the weekly chart, the second-best performer across all 49 assets. Silver rose 7.35% to 73.17, a powerful reversal from recent weakness. Platinum gained 6.92% to 1999.90, a dramatic recovery from its multi-week downtrend. Gold added 6.16% to 4702.70, extending its established uptrend with a powerful weekly candle. Copper advanced 1.94% to 5.6815, a more modest gain within the context of the broader metals surge but nonetheless positive. All five metals contracts finished in the green, the first uniformly positive week for the sector after a period of significant internal divergence and the strongest single-week sector performance in the current dataset.
The metals complex is showing a sector-wide repricing that goes beyond any single contract. Gold at 4702.70 is extending a clearly established uptrend on the weekly chart, the 6.16% gain adding to an already powerful series of higher highs that has characterised the gold chart throughout 2026. The weekly candle at 4702.70 is a strong continuation signal and gold remains the highest-conviction long in the precious metals complex. Silver at 73.17 has produced a powerful recovery candle that partially reverses the sharp losses from prior weeks; the 7.35% gain is a significant positive signal but the weekly chart remains in a complex structure following the recent spike-and-crash sequence, and the sustainability of the recovery requires confirmation. Palladium at 1515.00 and Platinum at 1999.90 have both produced their largest positive weekly candles in recent history: Palladium’s 11.02% gain and Platinum’s 6.92% surge are dramatic reversals from the established downtrends of prior weeks. For systematic strategies, these are powerful signals but they carry the caveat that single-week moves of this magnitude following multi-week downtrends are often volatile repricing events rather than clean trend reversals. Copper at 5.6815 is advancing in a more measured way, its weekly chart showing a continuation of the medium-term recovery structure. The critical observation across the complex is that the uniformity of this week’s gains, all five contracts positive, is a meaningful breadth signal even if the magnitude of individual moves introduces caution about signal quality.
Meats (+3.48 percent | prev +2.45 percent)
Meats extended their leadership for a second consecutive week, averaging +3.48% and improving on last week’s already strong +2.45%. Feeder Cattle gained 5.37% to 370.68 on the weekly chart, the tenth-best performer across all 49 assets and a powerful continuation of the multi-week uptrend. Live Cattle added 4.91% to 246.20, the sector’s second-best performer and extending its own uptrend with a significant positive candle. Lean Hogs gained a modest 0.17% to 104.45, the weakest contract within the complex but nonetheless positive for a second consecutive week. All three meats contracts finished in the green for a second straight week, confirming the sector’s consistency as a positive contributor in the current environment.
The weekly charts across all three meats contracts continue to show constructive structures that are generating genuine positive signals for systematic trend-following systems. Feeder Cattle at 370.68 is extending one of the most clearly defined uptrends in the entire 49-asset universe, with price making higher highs and higher closes across multiple consecutive weeks. The 5.37% gain this week is the largest single-week advance for this contract in the current dataset and represents a meaningful acceleration of the already established trend. The weekly chart shows no sign of exhaustion at current levels. Live Cattle at 246.20 is similarly strong, its 4.91% gain this week producing a powerful continuation candle that builds on the prior week’s gains. Two consecutive weeks of meaningful gains in both cattle contracts confirm that the meats sector uptrend has genuine depth and momentum. Lean Hogs at 104.45 remains the more volatile and less directionally committed chart of the three, but its second consecutive positive week is a supporting signal. For systematic strategies, Feeder Cattle and Live Cattle are now generating two of the highest-conviction long signals in the full portfolio, and the sector’s uniform positive performance for a second consecutive week confirms that meats are the most reliable source of positive trend contribution in the current environment. The barometer’s retreat to 55% despite the meats sector’s strength confirms that the breadth deterioration is coming from elsewhere in the universe.
Grains (-0.26 percent | prev -1.09 percent)
Grains were modestly negative for a third consecutive week, though losses were the most contained in that stretch with the sector averaging -0.26%. Rough Rice led the sector with a gain of 2.37% to 11.23 on the weekly chart. Soybean Oil advanced 1.35% to 69.00 and Oats gained 1.84% to 346.75, providing positive contributions. Against these, Corn declined 3.16% to 452.00, the sector’s weakest performer and one of the weaker performers across all 49 assets this week. Soybean Meal fell 2.14% to 315.20, extending its corrective drift. Soybeans declined 0.87% to 1162.75, Wheat fell 1.12% to 597.75, and Canola slipped 0.33% to 727.10. The sector produced a split picture, with three contracts positive and five negative, with the magnitude of the losses in Corn and Soybean Meal outweighing the gains from Rough Rice, Oats, and Soybean Oil.
The grains complex continues to show a sector searching for direction after its extended positive run ended three weeks ago. Rough Rice at 11.23 is showing a constructive weekly candle, its 2.37% gain providing a positive signal within a complex that has otherwise been under pressure. Soybean Oil at 69.00 is the most constructive chart in the grains sector, building on the prior week’s recovery with a further modest gain that keeps the short-term trend positive. Oats at 346.75 produced a positive week after two consecutive sharp declines, a tentative stabilisation signal though the prior volatility makes the chart unreliable for systematic signals. Corn at 452.00 is the most concerning chart in the grains complex: the 3.16% decline extends a pattern of lower lows and the weekly chart is showing a confirmed short-term downtrend. Soybean Meal at 315.20 and Soybeans at 1162.75 are also drifting lower without clear reversal signals. Wheat at 597.75 has given back last week’s recovery gain and remains in an ambiguous chart structure. For systematic strategies, Soybean Oil and Rough Rice are the most actionable positive signals in the sector, while Corn and Soybean Meal are generating the clearest negative signals. The sector’s near-flat average of -0.26% reflects genuine internal uncertainty rather than a clear directional trend in either direction.
Equity Index (+2.87 percent | prev -0.98 percent)
Equity indices reversed sharply higher this week after four consecutive weeks of declines, with the sector averaging +2.87% as markets whipsawed on tariff shock headlines. The Nikkei 225 led all indices with a gain of 3.73% to 53300.00 on the weekly chart. The Nasdaq 100 advanced 3.43% to 24129.80, recovering a meaningful portion of its prior multi-week decline. The S&P 500 gained 2.99% to 6603.75 and the Russell 2000 added 2.75% to 2531.70. The DJIA rose 2.65% to 46629.00. The Euro Stoxx 50 gained 2.28% to 5640.00 and the DAX advanced 2.27% to 23995.00. All seven equity indices finished positive, a complete reversal from the prior week’s uniform weakness. The VIX fell 12.60% to 24.90, declining from last week’s elevated 28.30 as a partial unwind of equity fear accompanied the indices’ recovery.
The weekly charts across equity indices present a complex analytical picture. The sharp positive reversal this week follows four consecutive weeks of declines, and a single strong week does not erase the established downtrend that had developed across most major indices. The S&P 500 at 6603.75 has recovered from the prior week’s lows but the weekly chart still shows a pattern of lower highs relative to the February peak, and the recovery candle, while significant, does not yet constitute a trend reversal signal on a medium-term timeframe. The Nasdaq 100 at 24129.80 is in a similar position: the 3.43% gain is the largest positive weekly candle in several weeks, but the broader chart structure remains in a corrective phase. The Nikkei 225 at 53300.00 continues to show relative strength compared to its US and European peers, and this week’s 3.73% gain is the largest of any equity index. The VIX at 24.90, while still elevated relative to the pre-February levels near 18, has declined meaningfully from last week’s 28.30. For systematic trend-following systems, a single week of sharp positive reversal after four weeks of decline creates signal confusion rather than a clean new positive trend signal. The prior downtrend signals across most indices have not been erased by one week of recovery, and the appropriate systematic response is caution about adding new long equity exposure at current levels until a more sustained positive structure establishes itself.
Currency (-0.17 percent | prev -0.84 percent)
Currencies were modestly negative for a third consecutive week, the sector averaging -0.17% in a week of mixed and muted moves relative to the extraordinary action in energy and metals. The JPY was the strongest performer in the complex, gaining 0.34% to 0.6303 on the weekly chart, benefiting from safe-haven demand alongside gold as the tariff shock unfolded. The AUD advanced 0.31% to 0.6887 and the EUR edged up 0.02% to 1.1563. The USD was essentially unchanged at 0.00% to 99.99, reflecting the competing forces of commodity-driven inflation expectations and safe-haven demand that offset each other precisely this week. Against these, the NZD declined 0.86% to 0.5708, the CAD fell 0.46% to 0.7193, the GBP lost 0.50% to 1.3199, and the CHF declined 0.24% to 1.2602. The near-flat sector average masks a split between safe-haven currencies gaining and commodity-linked currencies declining, a pattern consistent with the tariff shock environment.
The weekly charts across currency pairs reflect a complex environment where the normal USD-strength narrative that had dominated recent weeks is being disrupted by the macro shock. The JPY at 0.6303 is showing a constructive weekly candle, its safe-haven character driving modest appreciation in a week when equity volatility remained elevated even as indices recovered. The AUD at 0.6887 and EUR at 1.1563 edging higher suggests that the prior several weeks of broad USD strength may be pausing or reversing as tariff uncertainty complicates the dollar’s trajectory. The USD itself at 99.99 is essentially unchanged, its flat weekly candle reflecting genuine uncertainty about the dollar’s direction in the current macro environment. The CAD at 0.7193 and NZD at 0.5708 are the weakest charts in the complex, both continuing to make lower lows on the weekly chart and extending established downtrends against the dollar. GBP at 1.3199 is showing a modest pullback within a medium-term recovery structure. For systematic strategies, the currency complex is in a transitional phase: the USD’s flat week signals a pause in the prior strength trend, the JPY’s safe-haven bid is constructive on the long side, and the CAD and NZD continue to generate clear negative signals as commodity-linked currencies under pressure from trade uncertainty.
Volatility Index (-12.60 percent | prev +10.65 percent)
The VIX collapsed 12.60% to 24.90 this week, the worst performer across all 49 assets and a dramatic reversal from last week’s 10.65% surge to 28.30. The weekly chart at 24.90 shows a significant bearish candle that partially unwinds the prior week’s fear spike, but at 24.90 the VIX remains well above the pre-February levels near 18, confirming that the elevated-volatility regime established over the past five weeks has not been resolved. The VIX’s 12.60% decline is a mechanical consequence of equity indices recovering sharply across all seven markets this week: as implied volatility is priced out of equity options during a relief rally, the VIX falls. However, the critical context is that the VIX at 24.90 is still elevated by historical standards, and the tariff shock environment that drove last week’s spike to 28.30 has not been resolved. For systematic strategies, a VIX at 24.90 and declining from an elevated peak signals a reduction in acute fear but not a return to the low-volatility regime that characterised late 2025. Position sizing discipline remains essential in this environment, and the VIX’s one-week decline does not negate the broader elevated-volatility context that has prevailed since February.
Crypto (+1.37 percent | prev -6.06 percent)
Bitcoin gained 1.37% to 67165.00 this week, a modest recovery from last week’s 6.06% decline and a tentative stabilisation signal for the crypto sector. The weekly chart at 67165.00 shows a small positive candle that interrupts the pattern of lower lows characterising Bitcoin’s price action in recent months, though the gain is too modest to constitute a reversal signal on a medium-term trend timeframe. In the context of a week where energy and metals delivered extraordinary double-digit gains driven by the tariff shock, Bitcoin’s 1.37% advance is a muted and independent response, confirming that crypto continued to trade on its own dynamics rather than correlating with the broader commodity complex.
The weekly chart at 67165.00 remains in a complex structure following several weeks of decline from the highs of earlier in 2026. The small positive candle this week does not negate the prior pattern of lower highs and lower closes, and the weekly chart provides no high-conviction directional signal in either direction at current levels. For systematic strategies, Bitcoin at 67165.00 with a 1.37% gain after a 6.06% loss is a market in tentative stabilisation rather than confirmed recovery. The appropriate response is to monitor for a more sustained positive structure before adding conviction to long crypto positioning. The crypto sector’s muted behaviour this week, delivering a modest positive in a week of extraordinary commodity moves, confirms that Bitcoin is currently trading as a standalone asset rather than as a correlated element of the macro commodity complex.
Performance Highlights – This Week’s Market Leaders & Laggards
Source: Finviz.com
Top Market Movers
Top Gainers
1. Crude Oil WTI +18.06 percent
Crude Oil WTI surged 18.06% to 112.06 this week, the best performer across all 49 assets and one of the most powerful single-week moves in the energy complex in recent memory. The weekly chart at 112.06 shows a vertical surge candle that overwhelms all recent price action, extending the established uptrend with extraordinary force. The 18.06% gain is not a trend initiation but a trend acceleration: WTI had already been building a positive structure over prior weeks, and this week’s tariff-driven demand shock has propelled the contract dramatically higher in a single session. For systematic trend-following strategies, an 18.06% weekly gain in an already-established uptrend is an exceptional signal, but it carries an important caveat: moves of this magnitude in a single week can overshoot medium-term fair value and create conditions for consolidation or partial retracement in subsequent weeks. The appropriate systematic response is to recognise the signal quality of an extended uptrend while being attentive to the risk that one-week gaps of this size can create volatile follow-through. WTI at 112.06 is the dominant positive contributor across all 49 assets this week and the energy complex’s strength is broadly confirmed by the gains across Heating Oil, Gasoline RBOB, and Crude Oil Brent.
2. Palladium +11.02 percent
Palladium gained 11.02% to 1515.00 on the weekly chart, the second-best performer across all 49 assets and a dramatic reversal from the established downtrend of prior weeks. The weekly chart at 1515.00 shows a large positive candle that breaks sharply from the pattern of lower lows that had characterised Palladium’s price action over the preceding several weeks. The 11.02% gain is the largest single-week advance for Palladium in the current dataset and reflects the broader tariff-driven repricing across the metals complex, with industrial metals and precious metals alike benefiting from supply-chain uncertainty and safe-haven demand simultaneously. For systematic trend-following strategies, Palladium’s 11.02% gain creates a genuinely complex analytical situation: it is large enough to generate new positive signals on shorter trend timeframes, but it arrives after a multi-week downtrend and is driven by a macro shock rather than the gradual price discovery that produces the most reliable trend signals. The critical question for systematic managers is whether this week’s surge represents the beginning of a new sustained uptrend in Palladium or a violent one-week repricing within a broader downtrend. The weekly chart alone cannot answer that question yet, and a period of follow-through confirmation will be needed before Palladium can be considered a high-conviction long signal.
3. Orange Juice +10.53 percent
Orange Juice gained 10.53% to 199.45 on the weekly chart, the third-best performer across all 49 assets and a second consecutive week of powerful recovery following the prior crash. The chart at 199.45 shows a market that has now recovered substantially from its lows, with two consecutive weeks of double-digit gains rebuilding the price structure that was destroyed in the original collapse. For systematic trend-following strategies, the two-week recovery pattern in Orange Juice is becoming more analytically meaningful than the initial single-week bounce of last week: two consecutive weeks of strong gains, both exceeding 9%, begin to establish a positive trend signal on shorter timeframes and reduce the concern that the initial recovery was a dead-cat bounce. At 199.45, Orange Juice is approaching the levels that preceded the original crash and the weekly chart is now showing a V-shaped recovery that, if it continues, could generate meaningful positive trend signals. The caveat for systematic managers remains the extreme volatility history of this contract: the crash-and-recovery sequence of the past three weeks is not the profile of a clean, low-noise trend. But two consecutive weeks of strong gains are more constructive than one, and Orange Juice is beginning to earn reconsideration as a positive systematic signal.
4. Feeder Cattle +5.37 percent
Feeder Cattle gained 5.37% to 370.68 on the weekly chart, the fourth-best performer across all 49 assets and the cleanest trending chart in this week’s top gainers. In a week dominated by tariff-shock volatility events in energy and metals, Feeder Cattle’s 5.37% gain stands out as the continuation of a methodical, multi-week uptrend that requires no macro shock for its justification. The weekly chart at 370.68 shows a series of higher highs and higher closes across multiple consecutive weeks, with each candle reinforcing the prior directional signal. The 5.37% gain this week is the largest single-week advance for Feeder Cattle in the current dataset and represents an acceleration of the already established uptrend rather than a new trend initiation. For systematic managers, Feeder Cattle remains the highest-conviction long signal in the entire 49-asset universe: the trend is clear, the duration is now multi-week, the weekly chart structure is technically sound, and the gain this week confirms that the uptrend is strengthening rather than stalling. Unlike the energy and metals surges, which require caution about one-week shock dynamics, Feeder Cattle’s advance is the kind of sustained, low-noise directional movement that systematic trend-following strategies are specifically designed to capture and profit from.
Top Losers
1. VIX -12.60 percent
The VIX collapsed 12.60% to 24.90 this week, the worst performer across all 49 assets and a dramatic reversal from last week’s 10.65% surge to 28.30. The weekly chart at 24.90 shows a significant bearish candle that partially unwinds the fear spike of the prior week, but the context matters: at 24.90, the VIX remains more than 38% above the levels of late 2025 and early 2026, confirming that the elevated-volatility regime of the past several weeks has not been resolved by a single week of equity recovery. For systematic trend-following strategies, the VIX’s 12.60% decline is a direct mechanical consequence of all seven equity indices recovering sharply this week: as implied volatility is priced out of equity options during a relief rally, the VIX falls. The critical analytical question is whether this week’s VIX decline represents a genuine normalisation of the volatility regime or a temporary relief rally within an ongoing elevated-volatility environment. The weekly chart at 24.90, still well above the prior range of 15 to 20, supports the interpretation of temporary relief rather than regime change. Systematic managers should maintain disciplined position sizing in this environment, as the VIX at 24.90 with its recent history of sharp weekly swings in both directions is not a stable, low-volatility backdrop.
2. Sugar -5.48 percent
Sugar fell 5.48% to 14.96 on the weekly chart, the second-worst performer across all 49 assets and a continuation of the established multi-week downtrend. The weekly chart at 14.96 shows a significant bearish candle that extends the pattern of lower lows that has characterised Sugar’s price action over recent weeks. At 14.96, Sugar is approaching multi-month lows and the downtrend is one of the most consistently negative structures in the soft commodity complex. The 5.48% decline this week stands in stark contrast to the broad commodity strength driven by energy and metals, highlighting the selective nature of the tariff-driven repricing: not all commodities benefited equally, and Sugar’s continued decline confirms that demand-side concerns and supply dynamics specific to the soft commodity sector are driving this market independently of the broader macro shock. For systematic trend-following strategies, Sugar is generating clear negative signals on the weekly chart, with a consistent pattern of lower lows providing high-conviction short or flat positioning justification. The weekly chart provides no technical basis for expecting a near-term reversal, and the continued decline in the face of a broadly positive commodity week adds credibility to the downtrend’s persistence.
3. Natural Gas -4.37 percent
Natural Gas fell 4.37% to 2.8070 on the weekly chart, the third-worst performer across all 49 assets and a notable outlier within a broadly surging energy sector. While the four petroleum contracts posted extraordinary gains this week, Natural Gas continued its independent decline alongside Ethanol, confirming that the contract is trading on its own supply-demand dynamics rather than tracking the broader petroleum complex. The weekly chart at 2.8070 shows a market in a persistent choppy downtrend, with price making lower lows and the weekly candle extending the pattern of corrective drift that has characterised Natural Gas throughout the current period. The 4.37% decline is particularly striking in the context of Crude Oil WTI’s 18.06% surge: the two contracts, both classified as energy, moved in opposite directions with dramatically different magnitudes this week. For systematic trend-following strategies, Natural Gas at 2.8070 is generating clear negative signals on the weekly chart, with a consistent pattern of lower lows and no meaningful positive reversal candle visible in recent history. The contract’s persistent weakness within an otherwise strongly positive energy sector reinforces the importance of treating each market as an independent trend signal rather than assuming sector-level correlation. Natural Gas is generating one of the cleaner negative signals in the current portfolio, and its continued decline in a week of energy strength adds conviction to the view that the downtrend is genuine rather than macro-driven.
4. Coffee -3.98 percent
Coffee fell 3.98% to 295.95 on the weekly chart, the fourth-worst performer across all 49 assets and a meaningful pullback from the elevated levels reached in prior weeks. The weekly chart at 295.95 shows a bearish candle that interrupts the tentative recovery structure that had been building after the prior extended decline. At 295.95, Coffee remains well below the highs of earlier in 2026, and the weekly chart structure is showing a pattern of lower highs on medium-term timeframes that is not yet resolved in favour of either a sustained recovery or an extended downtrend. The 3.98% decline this week follows a period of sharp two-way volatility in Coffee, a pattern that creates genuine difficulty for systematic trend-following systems attempting to establish a clean directional signal. For systematic strategies, Coffee at 295.95 is generating ambiguous signals: the medium-term chart structure shows a market that surged dramatically, corrected sharply, partially recovered, and is now correcting again. This kind of multi-swing, high-volatility behaviour is not the profile of a cleanly trending market, and the appropriate response is caution about position sizing until a more sustained directional structure emerges. The weekly chart provides no high-conviction signal in either direction at current levels, and Coffee warrants monitoring rather than aggressive positioning.
Portfolio View - Positioning and Impact
Energy positioning was the week’s dominant positive contributor by a substantial margin. Long Crude Oil WTI exposure gained 18.06%, the largest single-week gain of any contract across all 49 assets. Long Crude Oil Brent added 6.25%, long Heating Oil gained 6.97%, and long Gasoline RBOB advanced 6.61%. Two detractors within the complex were Natural Gas, which fell 4.37%, and Ethanol, which declined 1.44%, but these losses were dwarfed by the gains across the petroleum complex. The energy sector’s +5.35% average confirms that diversified long energy exposure was the primary driver of positive portfolio performance this week, and systematic managers with established long positions across the petroleum complex will have experienced their strongest week of positive contribution in the current dataset.
Metals positioning was the second-largest positive contributor. Long Gold exposure gained 6.16%, long Silver advanced 7.35%, long Palladium surged 11.02%, long Platinum gained 6.92%, and long Copper added 1.94%. The sector’s uniformly positive week, with all five contracts finishing higher, marks a dramatic reversal from the mixed and negative results of prior weeks. Systematic managers with diversified long metals exposure saw their entire complex contribute positively in a single week, a sharp contrast to the internal differentiation that had characterised the metals sector in recent weeks.
Meats positioning was a positive contributor for a second consecutive week. Long Feeder Cattle exposure gained 5.37%, the largest single-week advance for the contract in the current dataset. Long Live Cattle added 4.91%, and long Lean Hogs gained 0.17%. The sector’s +3.48% average confirms that meats long positions are now generating meaningful and accelerating positive contributions, and the pace of gains this week exceeded last week’s already strong +2.45% contribution.
Equity positioning produced a positive result for the first time in five weeks. Long Nikkei 225 exposure gained 3.73%, long Nasdaq 100 added 3.43%, long S&P 500 advanced 2.99%, long Russell 2000 gained 2.75%, long DJIA rose 2.65%, long Euro Stoxx 50 added 2.28%, and long DAX gained 2.27%. The sector’s +2.87% average is a meaningful positive reversal. However, systematic managers who had rotated to short or flat equity positioning following four consecutive weeks of decline may not have fully participated in this recovery. The VIX’s 12.60% collapse to 24.90 confirms that the most acute phase of equity fear has passed for now, though the broader elevated-volatility environment is not yet resolved.
Bonds positioning turned positive for the first time in five weeks. Long 30-year Bond exposure gained 1.23%, long 10-year Note added 0.54%, long 5-year Note gained 0.30%, and long 2-year Note added 0.10%. The sector’s +0.54% average is a modest but directionally meaningful positive contribution after four consecutive negative weeks, and the uniformity of the gains across all four contracts is a constructive signal worth monitoring for continuation.
Grains positioning was a modest negative contributor for a third consecutive week. Long Rough Rice gained 2.37%, long Soybean Oil added 1.35%, and long Oats rose 1.84%, while long Corn lost 3.16%, long Soybean Meal fell 2.14%, long Soybeans declined 0.87%, long Wheat fell 1.12%, and long Canola slipped 0.33%. The sector’s -0.26% average is the most contained grains result in three weeks, with the positive and negative contributors nearly balanced. Currency positioning was a marginal negative contributor. Long JPY gained 0.34%, long AUD added 0.31%, and long EUR edged up 0.02%, while long NZD lost 0.86%, long GBP fell 0.50%, long CAD declined 0.46%, and long CHF fell 0.24%. Soft commodity exposure produced a bifurcated result: long Orange Juice gained 10.53% and long Cocoa added 2.51%, long Cotton gained 2.18%, while long Coffee lost 3.98% and long Sugar fell 5.48%. Long Lumber edged up 0.08%. Bitcoin gained 1.37%, a modest positive contribution for long Crypto exposure. The VIX’s 12.60% collapse was the week’s largest single loss across all 49 assets, creating meaningful drawdown for any long volatility exposure.
Final Reflections: Energy Explodes, Metals Surge, and Equities Reverse
The first week of April delivered one of the most extraordinary single-week performances across the 49-asset universe in the current dataset, driven by a macro shock of unusual force. Crude Oil WTI surged 18.06%, Palladium gained 11.02%, Orange Juice extended its recovery with a further 10.53% gain, Silver rose 7.35%, Gold added 6.16%, and every metals contract and most energy contracts finished strongly positive. All seven equity indices recovered sharply, averaging +2.87% after four consecutive weeks of decline. Bonds turned positive for the first time in five weeks. And through all of this extraordinary commodity and equity strength, the TTU Barometer fell from 66% to 55%, dropping eleven percentage points to the neutral threshold with a “Falling Weakly” rate of change. The SG Trend Index stands at -0.15% month-to-date after four April trading days and +6.92% year-to-date, improving on March’s close of +6.68% year-to-date. The barometer’s sharp retreat is the week’s essential analytical signal: raw performance and trend signal quality have diverged dramatically, and that divergence defines the challenge facing systematic managers as April begins.
Three observations define the week:
1. The barometer’s fall from 66% to 55% is the most important signal of the week, and it matters that it arrived in a week of extraordinary commodity gains.
This week, Crude Oil WTI surged 18.06%. Every metals contract finished higher. All seven equity indices recovered. Bonds turned positive. And yet the TTU Barometer fell from 66% to 55%, dropping eleven percentage points to the neutral threshold. That is the most important signal in this report. It tells you something critical about the nature of this week’s performance: the extraordinary percentage moves across energy, metals, and equities were driven by a macro shock, a violent repricing event, not by the gradual, sustained directional movement that generates reliable trend signals for systematic strategies. When markets move 10%, 15%, and 18% in a single week simultaneously across multiple sectors, trend signals become disrupted rather than reinforced. The barometer measures trend breadth, not performance breadth. You can have spectacular one-week percentage moves and deteriorating trend quality at the same time, and that is precisely what this week has delivered. A trend environment that falls to the neutral threshold during a week when WTI surges 18.06% is telling you that the quality and sustainability of current signals is lower than the raw performance numbers suggest. The barometer’s retreat to 55% is not a contradiction of this week’s extraordinary gains. It is the essential context for interpreting them.
2. Feeder Cattle and Live Cattle are now the highest-conviction trend signals in the portfolio, precisely because they do not need a macro shock to explain their gains.
Feeder Cattle’s 5.37% gain to 370.68 this week is not the flashiest move in the report. Crude Oil WTI surged 18.06% and Palladium gained 11.02%. But those moves require a macro shock for their explanation. Feeder Cattle’s 5.37% gain does not. It is the continuation of a methodical, multi-week uptrend that has been building consistently across consecutive weeks, making higher highs and higher closes in a pattern that is exactly what systematic trend-following strategies are designed to capture. Live Cattle’s 4.91% gain at 246.20 is equally constructive, and the two-week sequence of meaningful gains in both cattle contracts confirms that the meats sector uptrend has depth, momentum, and duration behind it. Unlike the energy and metals surges of this week, which carry the analytical caveat of macro-shock dynamics and the question of sustainability, the meats uptrend has been building gradually and consistently without requiring external shock for its justification. For systematic managers, Feeder Cattle and Live Cattle are generating two of the cleanest and most reliable positive trend signals in the full 49-asset universe. In a week dominated by extraordinary volatility events, the meats sector is providing exactly the kind of quiet, sustained, low-noise directional movement that produces the strongest risk-adjusted returns over time. The barometer’s retreat to 55% makes the consistency of the meats signals even more valuable as anchor positions in a disrupted portfolio environment.
3. Last year’s tariff shock has created a portfolio environment where recent performance and forward signal quality are pointing in different directions.
Systematic trend-following is built on the premise that price trends persist long enough to be identified and profited from before they reverse. This week has delivered a set of conditions that tests that premise acutely. Long energy positions established over prior weeks have produced extraordinary gains this week, with WTI surging 18.06% and the sector averaging +5.35%. Long metals positions have benefited from Palladium’s 11.02% surge and Gold’s 6.16% gain. These are exceptional short-term returns. And yet the TTU Barometer has fallen to 55%, signalling that the trend environment quality is deteriorating even as recent positions perform. The reason is straightforward: the tariff shock has simultaneously disrupted prior negative signals in equities, reversed prior weakness in metals, and amplified prior positive signals in energy to an extreme degree. When all of these things happen at once within a single week, the systematic trend environment becomes genuinely uncertain. The SG Trend Index at -0.15% month-to-date after four April trading days and +6.92% year-to-date reflects the net positive impact of this week on systematic portfolios, and the year-to-date foundation of +6.92% remains a strong base. But the barometer’s retreat to 55% with a “Falling Weakly” rate of change is the forward-looking signal that matters most: it tells you that the week ahead will require attentive risk management, that position sizing should remain disciplined, and that the extraordinary performance of this week should not be extrapolated into high-conviction directional forecasts for the week to come. The meats sector’s quiet consistency is the portfolio’s anchor. The energy and metals gains are the portfolio’s tailwind. And the barometer at 55% is its reality check.
Crude Oil WTI surges 18.06%. Palladium explodes 11.02% higher. Metals and energy deliver their strongest combined week in the current dataset. Equities recover sharply. And the TTU Barometer falls from 66% to 55%. The week’s most important story is not the extraordinary performance numbers. It is the gap between what the markets delivered and what the trend environment can confirm. Feeder Cattle and Live Cattle are the portfolio’s clearest signals. The barometer at 55% is its most important warning. And the week ahead will reveal whether the tariff shock has launched a new sustained commodity trend or delivered a powerful but transient repricing event.

List of Resources used in the Week in Review
Important Disclaimers
This document is directly solely to Accredited Investors, Qualified Eligible Participants, Qualified Clients and Qualified Purchasers. No investment decision should be made until prospective investors have read the detailed information in the fund offering documents of any manager mentioned in this document. This document is furnished on a confidential basis only for the use of the recipient and only for discussion purposes and is subject to amendment This document is neither advice nor a recommendation to enter into any transaction. This document is not an offer to buy or sell, nor a solicitation of an offer to buy or sell, any security or other financial instrument. This presentation is based on information obtained from sources that TopTradersUnplugged (“TTU”) (“considers to be reliable however, TTU makes no representation as to, and accepts no responsibility or liability for, the accuracy or completeness of the information. TTU has not independently verified third party manager or benchmark information, does not represent it as accurate, true or complete, makes no warranty, express or implied regarding it and shall not be liable for any losses, damages, costs or expenses relating to its adequacy, accuracy, truth, completeness or use.
All projections, valuations, and statistical analyses are provided to assist the recipient in the evaluation of the matters described herein. Such projections, valuations and analyses may be based on subjective assessments and assumptions and may use one among many alternative methodologies that produce different results accordingly, such projections, valuations and statistical analyses should not be viewed as facts and should not be relied upon as an accurate prediction of future events. There is no guarantee that any targeted performance will be achieved Commodity trading involves substantial risk of loss and may not be suitable for everyone
TTU is not and does not purport to be an advisor as to legal, taxation, accounting, financial or regulatory matters in any jurisdiction. The recipient should independently evaluate and judge the matters referred to herein. TTU does not provide advice or recommendations regarding an investor’s decision to allocate to funds or accounts managed by any manager (“or to maintain or sell investments in funds or accounts managed by any manager, and no fiduciary relationship under ERISA is created by the investor investing in funds or accounts managed by any manager, or through any communication between TTU and the investor
In reviewing this document, it should be understood that the past performance results of any asset class, or any investment or trading program set forth herein, are not necessarily indicative of any future results that may be achieved in connection with any transaction. Any persons subscribing for an investment must be able to bear the risks involved and must meet the suitability requirements relating to such investment. Some or all alternative investment programs discussed herein may not be suitable for certain investors This document is directed only to persons having professional experience in matters relating to investments. Any investment or investment activity to which this document relates is available only to such investment professionals. Persons who do not have professional experience in matters relating to investments should not rely upon this document.
This document and its contents are proprietary information of TTU and may not be reproduced or otherwise disseminated in whole or in part without TTU’s prior written consent.
This document contains simulated or hypothetical performance results that have certain inherent limitations AND SHOULD BE VIEWED FOR ILLUSTRATIVE PURPOSES. Unlike the results shown in an actual performance record, these results do not represent actual trading. HYPOTHETICAL PERFORMANCE RESULTS HAVE MANY INHERENT LIMITATIONS, SOME OF WHICH ARE DESCRIBED BELOW. NO REPRESENTATION IS BEING MADE THAT ANY ACCOUNT WILL OR IS LIKELY TO ACHIEVE PROFITS OR LOSSES SIMILAR TO THOSE SHOWN IN FACT, THERE ARE FREQUENTLY SHARP DIFFERENCES BETWEEN HYPOTHETICAL PERFORMANCE RESULTS AND THE ACTUAL RESULTS SUBSEQUENTLY ACHIEVED BY ANY PARTICULAR INVESTMENT ACCOUNT.
ONE OF THE LIMITATIONS OF HYPOTHETICAL PERFORMANCE RESULTS IS THAT THEY ARE GENERALLY PREPARED WITH THE BENEFIT OF HINDSIGHT IN ADDITION, HYPOTHETICAL TRADING DOES NOT INVOLVE FINANCIAL RISK, AND NO HYPOTHETICAL TRADING RECORD CAN COMPLETELY ACCOUNT FOR THE IMPACT OF FINANCIAL RISK IN ACTUAL TRADING FOR EXAMPLE, THE ABILITY TO WITHSTAND LOSSES OR TO ADHERE TO A PARTICULAR TRADING PROGRAM OR OTHER ASSET.
There are numerous other factors related to the markets in general or to the implementation of any specific trading program which cannot be fully accounted for in the preparation of hypothetical performance results and all of which can adversely affect actual trading results. No representation is being made that any investment will or is likely to achieve profits or losses similar to those being shown.
Most Comprehensive Guide to the Best Investment Books of All Time

Most Comprehensive Guide to the Best Investment Books of All Time
Get the most comprehensive guide to over 600 of the BEST investment books, with insights, and learn from some of the wisest and most accomplished investors in the world. A collection of MUST READ books carefully selected for you. Get it now absolutely FREE!
Get Your FREE Guide HERE!