


Trend Following - Week in Review—February 20, 2026

"Energy Surges and Metals Extend as Bonds Reverse and the Barometer Stabilises"
This Week in Trend – 20 February 2026
Welcome to This Week in Trend, your weekly view into the evolving structure of global futures markets and the behaviour of systematic trend following. This edition covers conditions through the close of US markets on Friday, 20 February 2026.
The story of the week was a powerful risk-on rotation. Energy roared back to the top of the performance table, led by heating oil’s explosive 8.29% surge, the single best performer across all 49 assets. Crude oil Brent gained 5.90% and WTI added 5.83%. Metals extended gains across the board, with silver surging 5.62%, platinum adding 4.76%, and palladium rising 4.50%. Gold continued its march higher with a 0.69% gain, extending to fresh all-time highs above $5,130. The VIX collapsed 4.56%, signalling a decisive shift back toward risk appetite after last week’s 9.89% spike.
Bonds reversed after four consecutive weeks of gains, with the 30-year bond declining 0.32% and the 10-year note falling 0.21%. The reversal was modest, a pause rather than a breakdown, but it marks the first negative week for the complex since mid-January. Equities recovered, with European indices leading: Euro Stoxx 50 gained 2.28% and the DAX rose 1.35%. US indices posted modest gains, though the Nikkei was the lone decliner at -0.82%. Soft commodities remained the weakest sector, dragged down by cocoa’s relentless collapse (-13.48%) and orange juice’s continued decline (-7.66%).
The trend environment showed tentative signs of stabilisation. The TTU Barometer recovered from 43% to 45%, remaining in "Neutral" territory with the 10-day rate of change holding at "Falling Weakly." The improvement is modest, just 2 percentage points, suggesting stabilisation rather than recovery. The SG Trend Index advanced to +1.76% month-to-date, with the year-to-date reading climbing to +6.55%, extending the positive divergence between fund performance and underlying trend conditions.
This was a week of aggressive rotation and tentative stabilisation. Cyclical assets led. Defensive assets paused. The barometer stopped falling. And systematic fund performance continued to build.
SG Trend Index Performance
Month to date: +1.76 percent
Year to date: +6.55 percent
Last week:
Month to date: +1.09 percent
Year to date: +5.85 percent
The SG Trend Index extended its February recovery, climbing from +1.09% to +1.76% month-to-date. The year-to-date reading advanced to +6.55%, building further on January’s +4.76% foundation and confirming that 2026 continues to deliver strong returns for systematic trend-following strategies. February is now on track to add meaningfully to the year’s gains.
The improvement was driven by several converging factors: the energy complex’s sharp recovery rewarding repositioned long exposure, continued precious metals strength with gold and silver both advancing, and the broad equity recovery benefiting residual long positioning. The bond sector’s modest pullback was insufficient to offset the gains elsewhere. The currency sector’s modest weakness, led by the yen’s 1.60% reversal after last week’s 2.79% surge, may have trimmed some gains from JPY-long positions, but the overall portfolio impact remained positive. The SG Index's continued advance despite the TTU Barometer sitting at only 45% demonstrates the power of diversification and sector rotation in generating returns even when the aggregate trend environment is merely neutral.
TTU Trend Barometer
Current reading: 45 percent
Previous reading: 43 percent
10-day rate of change: Falling Weakly
The TTU Trend Barometer edged up 2 percentage points from 43% to 45%, providing a marginal uptick after three consecutive weeks of decline. The barometer remains in "Neutral" territory and the improvement is modest. The critical question posed in last week's report, whether conditions would continue deteriorating or find support, has received an inconclusive answer. The barometer did not break lower. But it did not recover meaningfully either. It has stabilised at a low level.
The 10-day rate of change held at "Falling Weakly," unchanged from the prior update. Trend breakdowns have decelerated but not reversed. This is neither a recovery signal nor continued deterioration. It is a pause. The January recovery from 45% to 68% remains almost entirely erased, and 45% sits squarely in the neutral zone where trend-following historically faces mixed conditions. The barometer is back at the same level it reached in mid-January before the surge began.
The modest recovery reflects the re-establishment of trends in energy and the continued strengthening of metals trends, offset by ongoing disarray in soft commodities, the bond sector's pause, and currency reversals. The net effect is marginal improvement rather than genuine recovery. The question now shifts: can the barometer push higher as energy and metals trends mature, or will it drift toward the critical 40% threshold that marks the boundary of the "Weak" environment? The answer will depend on whether this week's cyclical strength proves durable or fades.
At 45% with weakly falling momentum, the barometer sends a cautious message. The environment remains neutral, not yet favourable, and only marginally improved from last week's concerning reading. The divergence between the barely improving barometer and the advancing SG Trend Index (+1.76% MTD, +6.55% YTD) remains wide. Fund performance continues to outrun the underlying trend conditions. That divergence was flagged as unsustainable two weeks ago, and it has yet to resolve convincingly in either direction.
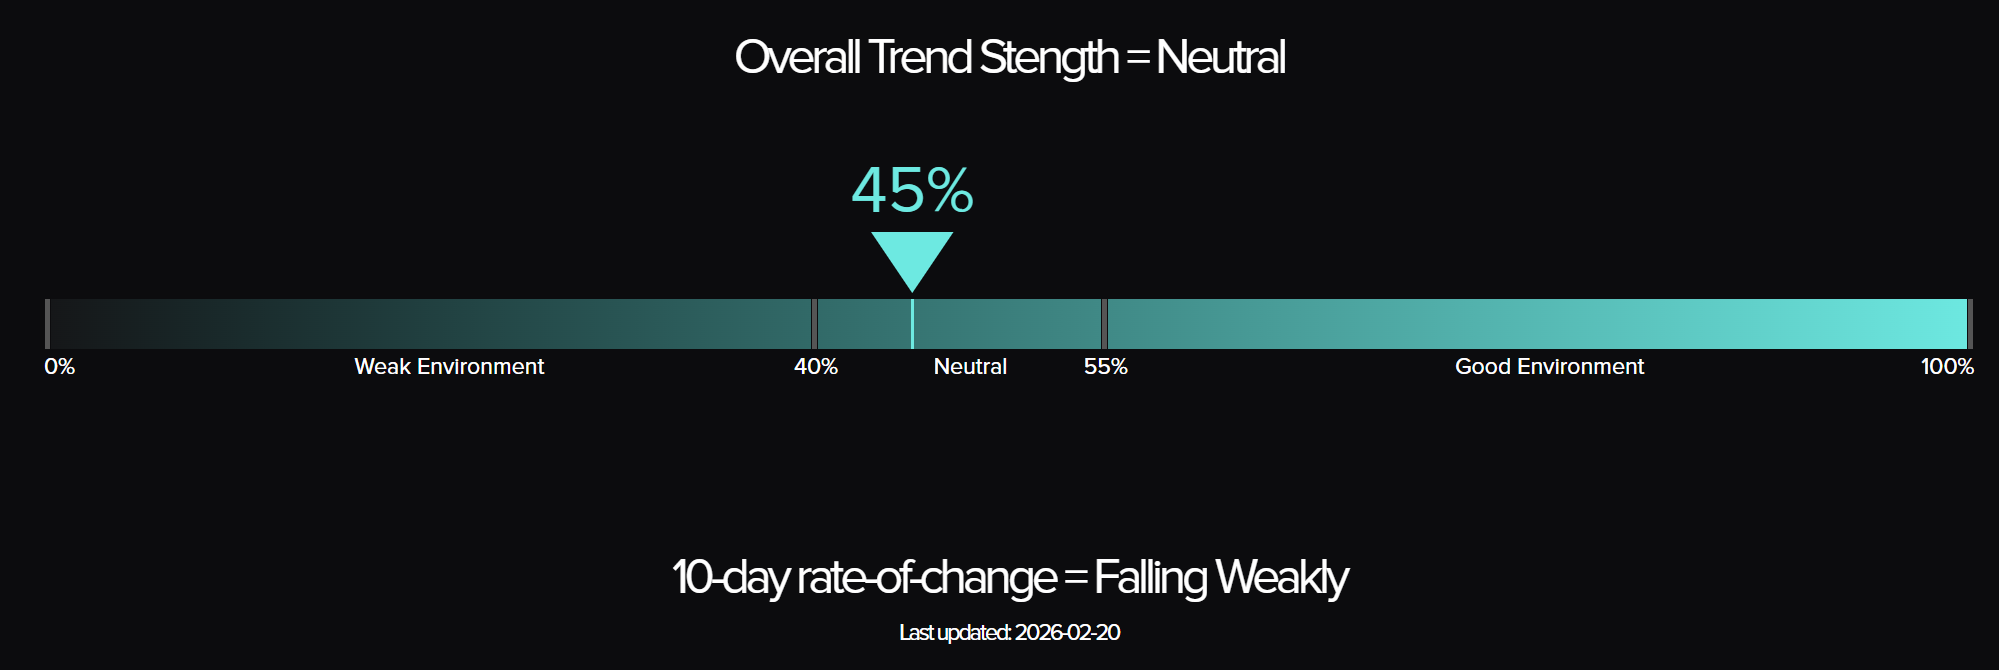
The Top Traders Unplugged (TTU) Trend Barometer is a proprietary tool that measures the percentage of markets with medium to strong trends. Similar to a thermometer, where 0 degrees Celsius equates to freezing, a TTU Trend Barometer reading below 40% indicates a “cold” environment for trend-following, while readings above 55% signal a “hotter,” more favorable trend environment.
Weekly Asset Class Snapshot
| Asset Class | % Move | Prev |
| Metal | +3.24% | −0.37% |
| Energy | +3.04% | −1.18% |
| Meats | +1.21% | −1.97% |
| Grains | +0.89% | +1.38% |
| Equity Index | +0.82% | −0.10% |
| Bonds | −0.22% | +0.91% |
| Currency | −0.65% | +0.52% |
| Crypto | −1.47% | −2.03% |
| Soft Commodity | −3.94% | +1.01% |
| Volatility Index | −4.56% | +9.89% |
Source: Finviz.com
Metal (+3.24 percent | prev −0.37 percent)
Metals surged back to the top of the asset class rankings after last week’s marginally negative performance. Silver was the standout at +5.62%, extending its powerful rally with the weekly chart showing prices surging to $84.57, a continuation of the explosive move that has characterised early 2026. Platinum gained 4.76% to reach $2,171, and palladium added 4.50% to push above $1,786. Gold posted a more modest 0.69% gain but extended to fresh all-time highs above $5,130, confirming the parabolic trend’s durability. Copper added 0.62%. All five metals were positive, a clean sweep that contrasts sharply with the precious-industrial divergence of recent weeks. The weekly charts show silver and platinum breaking higher with conviction, while gold’s steady advance continues unabated. The breadth of metals strength is the most constructive signal for the sector since January.
Energy (+3.04 percent | prev −1.18 percent)
Energy delivered its strongest week since late January, reversing two consecutive weeks of declines. Heating oil exploded higher with an 8.29% gain, the best single-asset performance across all 49 markets. The weekly chart shows a powerful breakout to $2.58, reclaiming levels not seen since the October highs. Crude oil Brent surged 5.90% to $71.75 and WTI gained 5.83% to $66.31, both printing strong bullish candles on the weekly charts. Gasoline RBOB added 4.52%. Ethanol was marginally negative at -0.15%. Natural gas remained the outlier, declining 6.16% to $3.07, continuing its extended correction from the historic January rally. The energy complex is bifurcated: petroleum products are reasserting trends while natural gas remains in corrective mode. For trend followers, the petroleum recovery represents the re-establishment of opportunity after the mid-February washout.
Meats (+1.21 percent | prev −1.97 percent)
Meats recovered from last week’s sharp decline, with the sector average flipping from -1.97% to +1.21%. Lean hogs led the recovery with a 2.63% gain, partially recouping last week’s devastating 6.81% collapse. The weekly chart at $93.63 shows the contract attempting to stabilise after the prior week’s sharp breakdown. Live cattle added 0.57% to reach $241.73, continuing to trade near historic highs. Feeder cattle gained 0.44% at $364.28, maintaining its established uptrend. The cattle trends remain firmly intact. The hog recovery is encouraging but follows a severe breakdown, and it’s too early to determine whether the rebound represents genuine stabilisation or merely a dead-cat bounce within a developing downtrend.
Grains (+0.89 percent | prev +1.38 percent)
Grains posted a third consecutive positive week, though with narrower breadth than the prior two weeks. Oats led at +4.93%, followed by wheat at +4.83%. The weekly chart shows prices pushing to $581.75 in what increasingly looks like a genuine trend reversal from the extended decline. Soybean oil added 3.04% and canola gained 1.67%. Soybeans rose 0.48%. However, the complex showed internal divergence: soybean meal slipped -0.13%, corn declined -0.34%, and rough rice dropped sharply at -7.40%, the worst performer in the grains complex and the fourth-worst across all 49 assets. Six of eight components were positive. The grain sector continues to provide a constructive backdrop for trend followers, though the rough rice collapse and internal divergence suggest selectivity remains important.
Equity Index (+0.82 percent | prev −0.10 percent)
Equities recovered from last week’s risk-off decline, with the sector average returning to positive territory. European indices led the recovery: Euro Stoxx 50 surged 2.28% and the DAX gained 1.35%. US indices posted modest gains. Nasdaq 100 added 1.07%, S&P 500 rose 1.06%, Russell 2000 gained 0.59%, and DJIA edged up 0.21%. The Nikkei 225 was the notable laggard at -0.82%, pausing after several weeks of strong outperformance. The weekly charts show the S&P 500 at 6,924 and Nasdaq at 25,077 holding near recent highs, with the DJIA pushing to 49,680. The DAX at 25,296 and Euro Stoxx 50 at 5,147 continue their powerful European rally. The VIX’s collapse to 20.15 confirms the risk-on shift. For trend followers, the equity sector has returned to a broadly constructive posture, with European indices offering the cleanest directional signals.
Bonds (−0.22 percent | prev +0.91 percent)
Bonds posted their first negative week in five, ending the four-week rally that had carried the complex from mid-January. The 30-year bond led the decline at -0.32%, followed by the 10-year note (-0.21%), 5-year note (-0.18%), and 2-year note (-0.15%). The weekly charts show all four instruments printing small bearish candles. The 30-year at 117.41 and the 10-year at 112.94 remain well within the uptrend established over the prior month. This looks more like a consolidation pause than a trend reversal. The magnitude of the pullback is modest relative to the cumulative gains. For systematic trend followers, the question is whether this represents a natural breather within an emerging bond trend or the early stage of a more meaningful reversal. The risk-on rotation elsewhere, with energy surging, equities recovering, and the VIX collapsing, provides context for the bond pause.
Currency (−0.65 percent | prev +0.52 percent)
Currencies reversed last week’s broad gains against the US dollar, with the dollar index strengthening 0.94%. The Japanese yen was the weakest major, falling 1.60% after last week’s powerful 2.79% surge, a sharp mean reversion that unwound much of the safe-haven bid. The British pound declined 1.15%, New Zealand dollar fell 1.12%, Swiss franc lost 1.01%, and the euro dropped 0.76%. Canadian dollar declined 0.52%. Australian dollar was essentially flat at +0.01%. The weekly charts show the dollar index at 97.72 consolidating within its broader downtrend, while the yen at 0.6461 and euro at 1.1795 remain in their established ranges. The currency sector lacks clear directional conviction, with the dollar’s week-to-week oscillations reflecting the push and pull between risk-on and risk-off flows rather than establishing sustained trends.
Soft Commodity (−3.94 percent | prev +1.01 percent)
Soft commodities returned to their position as the worst-performing asset class, giving back last week’s modest gains and then some. Cocoa crashed another 13.48%, taking the contract to around $3,184 on the weekly chart, extending the brutal bear market that has now seen prices fall approximately 73% from the 2024 highs. Orange juice declined 7.66% to $169.35, resuming its downtrend after the prior week’s 15.83% relief rally. Coffee fell 4.22% to $285.35, pulling back sharply from its recent highs. Lumber dropped 3.43%. On the positive side, sugar gained 2.82% and cotton added 2.34%. The sector remains deeply dysfunctional from a trend perspective. Cocoa’s accelerating decline continues to dominate, and short positions have been enormously profitable. But the extreme volatility in OJ, coffee, and cocoa makes position sizing the critical risk management challenge.
Volatility Index (−4.56 percent | prev +9.89 percent)
The VIX collapsed 4.56% after last week’s dramatic 9.89% surge, settling at 20.15 on the weekly chart. The sharp reversal confirms the shift back toward risk-on sentiment, with implied volatility declining as equity markets recovered. The VIX’s return toward the 20 level, after briefly pushing above 21 last week, suggests that the equity market anxiety was temporary rather than the beginning of a sustained volatility expansion. For systematic strategies, the VIX’s mean-reverting behaviour continues to make it a challenging instrument for trend-following. Sharp spikes followed by rapid declines are the norm rather than the exception.
Crypto (−1.47 percent | prev −2.03 percent)
Bitcoin declined 1.47% to approximately $67,925, continuing the gradual deceleration in selling pressure that began last week. The weekly chart shows the cryptocurrency consolidating in a range, with the bearish momentum that drove prices from December’s highs clearly fading. The three-week sequence of -16.46%, -2.03%, and now -1.47% suggests the selling is exhausting itself, though the trend remains bearish. For trend-following systems, Bitcoin likely remains in a flat or short position. The key question is whether the deceleration leads to genuine basing or simply precedes another leg lower.
Performance Highlights – This Week’s Market Leaders & Laggards
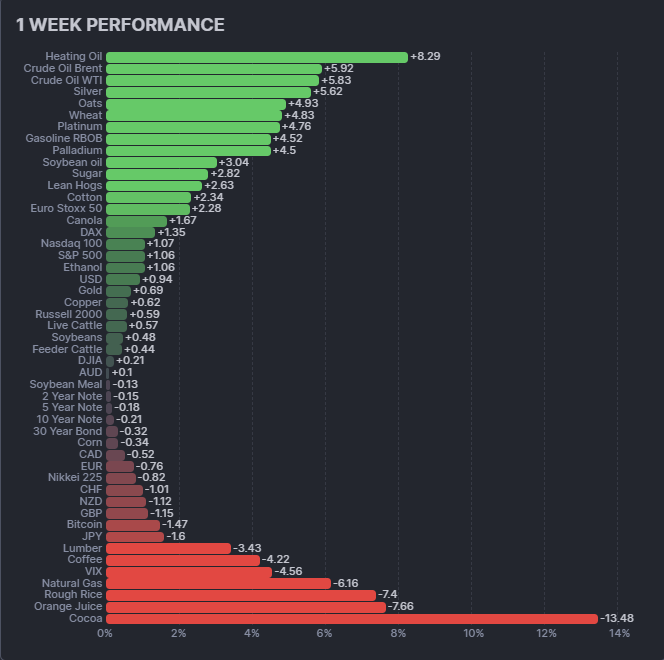
Source: Finviz.com
Top Market Movers
Top Gainers
1. Heating Oil +8.29 percent
Heating oil delivered the week’s best performance and the strongest single-asset move across all markets. The 8.29% surge took prices to $2.58 on the weekly chart, a powerful breakout that reclaims the October high zone. The move was supported by seasonal demand factors and crude oil strength, but the magnitude suggests genuine trend re-establishment. For systematic followers, heating oil’s breakout is the clearest new trend signal in the energy complex and validates patience through the mid-February correction.
2. Crude Oil Brent +5.90 percent
Brent crude surged 5.90% to $71.75, printing a strong bullish weekly candle that reverses the recent downward drift. The move takes Brent back above the $70 level that had served as a pivot through late 2025. Combined with WTI’s 5.83% gain to $66.31, the petroleum complex is signalling renewed upside conviction. Supply concerns and geopolitical factors continue to provide fundamental support for the directional move.
3. Silver +5.62 percent
Silver extended its explosive 2026 rally with another 5.62% weekly gain, pushing to $84.57 on the weekly chart. The precious metal continues to outpace gold on a percentage basis, benefiting from both safe-haven demand and industrial applications. The weekly chart shows a parabolic advance that shows no signs of exhaustion. Silver’s strength alongside gold, platinum, and palladium makes the metals complex the most coherent trending sector in the market.
4. Oats +4.93 percent
Oats surged 4.93% to reach $324.25, continuing the grains complex’s constructive run. The weekly chart shows prices breaking higher from a consolidation zone, suggesting trend formation in the agricultural space is gaining momentum. While oats is a thinner market, its strength alongside wheat (+4.83%) reinforces the broad-based nature of the grain rally now entering its third consecutive positive week.
Top Losers
1. Cocoa −13.48 percent
Cocoa’s collapse continued unabated, with a further 13.48% decline taking the contract to approximately $3,184 on the weekly chart. This follows last week’s 14.30% crash and extends the brutal bear market that has now erased roughly 73% of the contract’s value from the 2024 highs. The accelerating downtrend shows no sign of capitulation or stabilisation. For trend followers, the short cocoa trade remains one of the most profitable positions of early 2026, though the pace of decline raises the question of how much further the move can extend.
2. Orange Juice −7.66 percent
Orange juice fell 7.66% to $169.35, resuming its decline after last week’s dramatic 15.83% relief rally. The bounce proved temporary. Prices have returned to the downward trajectory that has characterised the contract since its 2024 peaks. The weekly chart confirms the continued downtrend with the relief rally now appearing as nothing more than a counter-trend correction within a deeply bearish structure. The citrus market remains an extremely volatile and challenging environment.
3. Rough Rice −7.40 percent
Rough rice dropped 7.40% to $10.52, the sharpest weekly decline in the grains complex and a significant outlier against the broader grain strength. The weekly chart shows prices continuing their extended decline from the 2024 highs, now trading near multi-year lows. The move contrasts starkly with the positive performance in wheat, oats, and soybean oil, highlighting the internal divergence that characterizes the current grain environment.
4. Natural Gas −6.16 percent
Natural gas fell 6.16% to $3.07, extending its correction from the historic January rally for a third consecutive week. The cumulative decline from peak levels is now approximately 30%, though prices remain well above the 2025 lows. The weekly chart shows the contract settling into a consolidation range after the extreme volatility of recent weeks. The correction continues to moderate in percentage terms week over week, suggesting the sharpest phase of the unwind may be passing, though the trend remains firmly bearish in the near term.
Portfolio View - Positioning and Impact
Metals positioning delivered the week’s strongest systematic returns. Long silver exposure was the standout contributor with a 5.62% gain, while platinum (+4.76%) and palladium (+4.50%) added meaningfully. Gold’s continued advance (+0.69%) compounded the gains from what remains the single most consistent trend across all asset classes. Copper’s modest 0.62% gain was also additive. The clean sweep of positive returns across all five metals is the best sectoral outcome in weeks.
Energy positioning reversed sharply from recent weeks’ drag. Long heating oil exposure was the standout, contributing an exceptional 8.29% gain. Crude oil longs in both Brent (+5.90%) and WTI (+5.83%) added substantially, and gasoline RBOB (+4.52%) further bolstered returns. Natural gas remained the detractor at -6.16%, but its impact was overwhelmed by the petroleum complex’s strength. The net energy contribution was strongly positive for the first time in three weeks, validating the patience of systems that maintained directional exposure through the correction.
Equity positioning benefited from the broad recovery. European exposure was the primary driver, with Euro Stoxx 50 (+2.28%) and DAX (+1.35%) contributing the most. US equity longs (Nasdaq +1.07%, S&P 500 +1.06%, Russell 2000 +0.59%, and DJIA +0.21%) all added modestly. The Nikkei’s -0.82% decline was the sole detractor. The VIX’s 4.56% drop would have benefited any short volatility exposure. Overall, equities shifted from a portfolio drag to a net contributor.
Grains positioning continued to generate positive returns for a third consecutive week. Long oats (+4.93%) and wheat (+4.83%) were the primary contributors, with soybean oil (+3.04%) and canola (+1.67%) adding further. Rough rice was a significant detractor at -7.40%, though most diversified grain allocations would have limited exposure to this thinner market. The consistent positive contribution from grains underscores the sector’s growing importance in the portfolio mix.
Bonds positioning was a modest detractor after four weeks of consistent gains. The 30-year bond’s -0.32% decline and the 10-year note’s -0.21% drop were the primary sources of drag, though the magnitude was minor relative to the cumulative gains of prior weeks. Most trend-following systems would maintain long duration positions given the recent uptrend, and the pullback was insufficient to trigger significant position adjustments.
Currency positioning faced headwinds from the dollar’s rebound. Long yen positions, which contributed strongly last week with a 2.79% gain, reversed sharply with a 1.60% decline. Long GBP (-1.15%), NZD (-1.12%), and CHF (-1.01%) positions also detracted. The currency sector was a net drag on portfolio performance, partially offsetting gains elsewhere.
Soft commodity positioning generated highly varied results. Short cocoa positions, where held, were extremely profitable as the contract crashed 13.48%. Short OJ exposure would have added 7.66%. However, long coffee positions detracted with a 4.22% decline, and lumber longs lost 3.43%. Sugar (+2.82%) and cotton (+2.34%) provided positive contributions. The sector continues to reward short positioning in the declining contracts while punishing any remaining longs in the collapsed names.
Bitcoin exposure was a minor detractor at -1.47%, continuing the pattern of diminishing negative impact as the cryptocurrency’s decline decelerates. Most trend-following systems would remain flat or short, with the position contributing minimally to overall portfolio performance.
Final Reflections: Energy Surges and Metals Extend as Bonds Reverse and the Barometer Stabilises
The third week of February delivered a powerful rotation back toward cyclical assets. Energy led. Metals extended. Equities recovered. And the trend barometer stopped falling.
Three observations define the week:
- The cyclical rotation is rebuilding trend breadth from the bottom up: Heating oil’s 8.29% surge, crude’s 5-6% gains, silver’s continued 5.62% advance, and broad metals strength are not isolated moves. They represent the re-establishment of trends that had broken down or paused in recent weeks. The energy sector’s recovery is particularly significant because energy trends were a primary driver of the barometer’s decline from 68% to 43%. Their return supports the case for trend environment stabilisation. Metals delivering a clean sweep of positive returns across all five components adds further evidence that trend opportunities are expanding, not contracting.
- The barometer's stabilisation is tentative, not decisive: The TTU Barometer's recovery from 43% to 45% provides only marginal reassurance. A 2-point improvement after a 25-point decline from 68% is not recovery. It is a pause. The barometer now sits at 45%, the same level it reached in mid-January before the surge that carried it to 68%. The rate of change remains negative. The environment remains neutral. For systematic trend followers, this means the headwinds have stopped intensifying but have not lifted. The path back above 55% requires sustained new trend formation in energy, metals, and other sectors. One strong week of petroleum and precious metals gains is encouraging but not sufficient. The next two to three weeks remain the critical window for determining whether this is the floor or merely a ledge.
- The performance-environment divergence is narrowing, not widening: The SG Trend Index’s advance to +1.76% MTD and +6.55% YTD, combined with the barometer’s improvement, represents a healthier dynamic than the prior two weeks when fund returns held up against a deteriorating backdrop. The divergence that was flagged as unsustainable is beginning to resolve in the constructive direction. The trend environment is catching up to fund performance rather than fund performance falling to match a weakening environment. This is the more favourable of the two possible outcomes.
The year-to-date return of +6.55% is building a meaningful cushion. The barometer at 45% remains neutral and only marginally improved. The energy and metals recoveries provide genuine trend opportunities. But the gap between fund performance and trend conditions has not yet closed. The risk remains: either new trends must continue forming, or portfolio returns will eventually reflect the neutral environment the barometer is measuring.
Rotation has returned. Stabilization has begun. The question is whether it holds.

List of Resources used in the Week in Review
Important Disclaimers
This document is directly solely to Accredited Investors, Qualified Eligible Participants, Qualified Clients and Qualified Purchasers. No investment decision should be made until prospective investors have read the detailed information in the fund offering documents of any manager mentioned in this document. This document is furnished on a confidential basis only for the use of the recipient and only for discussion purposes and is subject to amendment This document is neither advice nor a recommendation to enter into any transaction. This document is not an offer to buy or sell, nor a solicitation of an offer to buy or sell, any security or other financial instrument. This presentation is based on information obtained from sources that TopTradersUnplugged (“TTU”) (“considers to be reliable however, TTU makes no representation as to, and accepts no responsibility or liability for, the accuracy or completeness of the information. TTU has not independently verified third party manager or benchmark information, does not represent it as accurate, true or complete, makes no warranty, express or implied regarding it and shall not be liable for any losses, damages, costs or expenses relating to its adequacy, accuracy, truth, completeness or use.
All projections, valuations, and statistical analyses are provided to assist the recipient in the evaluation of the matters described herein. Such projections, valuations and analyses may be based on subjective assessments and assumptions and may use one among many alternative methodologies that produce different results accordingly, such projections, valuations and statistical analyses should not be viewed as facts and should not be relied upon as an accurate prediction of future events. There is no guarantee that any targeted performance will be achieved Commodity trading involves substantial risk of loss and may not be suitable for everyone
TTU is not and does not purport to be an advisor as to legal, taxation, accounting, financial or regulatory matters in any jurisdiction. The recipient should independently evaluate and judge the matters referred to herein. TTU does not provide advice or recommendations regarding an investor’s decision to allocate to funds or accounts managed by any manager (“or to maintain or sell investments in funds or accounts managed by any manager, and no fiduciary relationship under ERISA is created by the investor investing in funds or accounts managed by any manager, or through any communication between TTU and the investor
In reviewing this document, it should be understood that the past performance results of any asset class, or any investment or trading program set forth herein, are not necessarily indicative of any future results that may be achieved in connection with any transaction. Any persons subscribing for an investment must be able to bear the risks involved and must meet the suitability requirements relating to such investment. Some or all alternative investment programs discussed herein may not be suitable for certain investors This document is directed only to persons having professional experience in matters relating to investments. Any investment or investment activity to which this document relates is available only to such investment professionals. Persons who do not have professional experience in matters relating to investments should not rely upon this document.
This document and its contents are proprietary information of TTU and may not be reproduced or otherwise disseminated in whole or in part without TTU’s prior written consent.
This document contains simulated or hypothetical performance results that have certain inherent limitations AND SHOULD BE VIEWED FOR ILLUSTRATIVE PURPOSES. Unlike the results shown in an actual performance record, these results do not represent actual trading. HYPOTHETICAL PERFORMANCE RESULTS HAVE MANY INHERENT LIMITATIONS, SOME OF WHICH ARE DESCRIBED BELOW. NO REPRESENTATION IS BEING MADE THAT ANY ACCOUNT WILL OR IS LIKELY TO ACHIEVE PROFITS OR LOSSES SIMILAR TO THOSE SHOWN IN FACT, THERE ARE FREQUENTLY SHARP DIFFERENCES BETWEEN HYPOTHETICAL PERFORMANCE RESULTS AND THE ACTUAL RESULTS SUBSEQUENTLY ACHIEVED BY ANY PARTICULAR INVESTMENT ACCOUNT.
ONE OF THE LIMITATIONS OF HYPOTHETICAL PERFORMANCE RESULTS IS THAT THEY ARE GENERALLY PREPARED WITH THE BENEFIT OF HINDSIGHT IN ADDITION, HYPOTHETICAL TRADING DOES NOT INVOLVE FINANCIAL RISK, AND NO HYPOTHETICAL TRADING RECORD CAN COMPLETELY ACCOUNT FOR THE IMPACT OF FINANCIAL RISK IN ACTUAL TRADING FOR EXAMPLE, THE ABILITY TO WITHSTAND LOSSES OR TO ADHERE TO A PARTICULAR TRADING PROGRAM OR OTHER ASSET.
There are numerous other factors related to the markets in general or to the implementation of any specific trading program which cannot be fully accounted for in the preparation of hypothetical performance results and all of which can adversely affect actual trading results. No representation is being made that any investment will or is likely to achieve profits or losses similar to those being shown.
Most Comprehensive Guide to the Best Investment Books of All Time

Most Comprehensive Guide to the Best Investment Books of All Time
Get the most comprehensive guide to over 600 of the BEST investment books, with insights, and learn from some of the wisest and most accomplished investors in the world. A collection of MUST READ books carefully selected for you. Get it now absolutely FREE!
Get Your FREE Guide HERE!