


Trend Following - Week in Review—February 27, 2026
"Metals Explode and the Barometer Surges to Very Strong as Trend Conditions Accelerate"
This Week in Trend – 27 February 2026
Welcome to This Week in Trend, your weekly view into the evolving structure of global futures markets and the behaviour of systematic trend following. This edition covers conditions through the close of US markets on Friday, 27 February 2026.
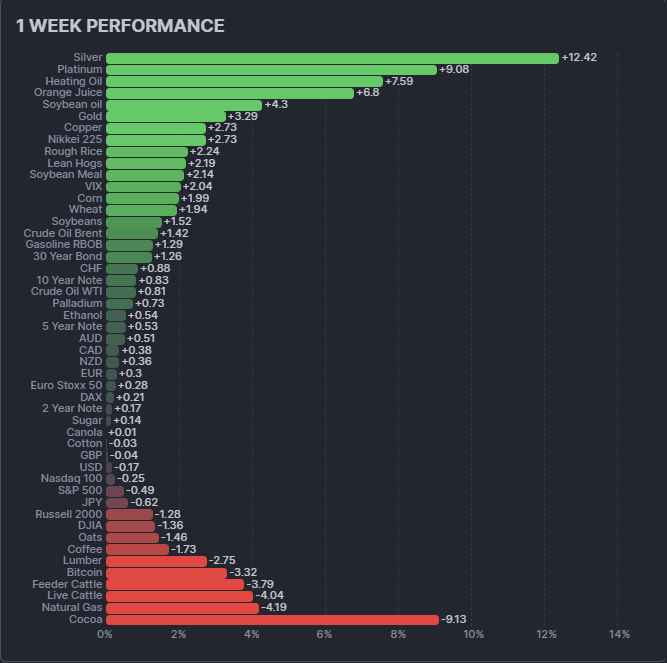
The story of the week was a dramatic metals breakout. Silver exploded 12.42% higher, the single best performer across all 49 assets. Platinum surged 9.08%. Heating oil continued its powerful rally with a 7.59% gain. Orange juice bounced 6.80% after weeks of relentless decline. Gold extended to fresh all-time highs with a 3.29% gain, pushing above $5,296. Copper added 2.73%. All five metals delivered positive returns for a second consecutive week, with the sector average surging to +5.65%, the highest of the year.
Grains posted a fourth consecutive positive week at +1.59%, led by soybean oil (+4.30%), rough rice (+2.24%), and soybean meal (+2.14%). Energy remained positive at +1.08%, though the performance was mixed: heating oil (+7.59%) and crude Brent (+1.42%) led, while natural gas declined 4.19%. Bonds resumed their rally after last week's pause, gaining +0.70% on average, with the 30-year bond adding 1.26%. Equities were mixed, with the Nikkei 225 surging 2.73% while US indices were narrowly negative. Soft commodities remained the weakest sector on aggregate, dragged down by cocoa's continued 9.13% collapse, though orange juice's 6.80% bounce provided some relief.
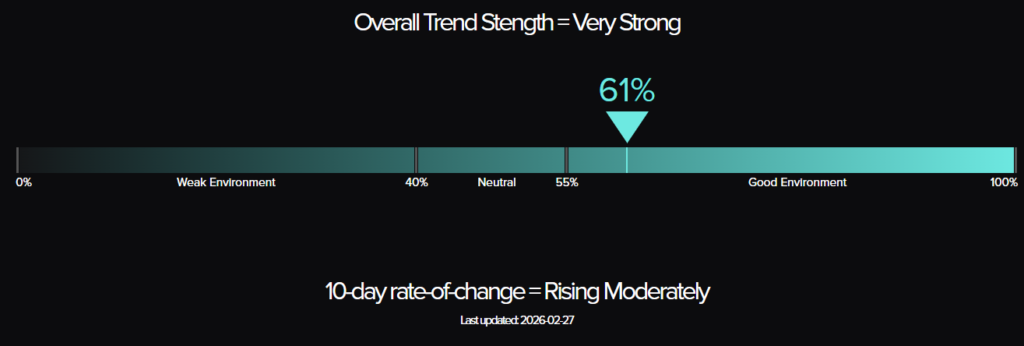
The trend environment strengthened materially. The TTU Barometer surged from 45% to 61%, crossing back above the critical 55% threshold into "Very Strong" territory. The 10-day rate of change shifted to "Rising Moderately," the most constructive momentum reading since late January. The SG Trend Index advanced to +3.46% month-to-date, with the year-to-date reading climbing to +8.33%, extending what is already an exceptional start to the year.
This was a week of trend confirmation and environmental recovery. Metals led. The barometer surged to very strong. Systematic fund performance accelerated. And the divergence between fund returns and trend conditions closed decisively from the right direction.
SG Trend Index Performance
Month to date: +3.46 percent
Year to date: +8.33 percent
Last week:
Month to date: +1.76 percent
Year to date: +6.55 percent
The SG Trend Index surged from +1.76% to +3.46% month-to-date, the largest weekly improvement in February. The year-to-date reading advanced to +8.33%, building an increasingly substantial cushion and confirming that 2026 is delivering exceptional returns for systematic trend-following strategies. February is now on track to be the second consecutive strong month, adding meaningfully to January's +4.76% foundation.
The improvement was broad-based and powerful. The metals complex's explosive gains, led by silver's 12.42% surge and platinum's 9.08% advance, drove the largest single-sector contribution to fund performance in weeks. Energy's continued recovery, with heating oil gaining 7.59% and crude oil rising across both benchmarks, rewarded repositioned long exposure. The resumption of the bond rally added further. Grains' fourth consecutive positive week provided steady supplementary returns. The currency sector's near-flat performance and equities' mixed results were insufficient to offset the strength elsewhere.
The SG Index's advance to +8.33% YTD alongside the barometer's recovery to 61% represents the healthiest alignment between fund performance and trend conditions since late January. The divergence that had been flagged as unsustainable over the past three weeks has now resolved decisively in the constructive direction. Fund performance and the underlying environment are converging. This is the best possible outcome for systematic strategies.
TTU Trend Barometer
Current reading: 61 percent
Previous reading: 45 percent
10-day rate of change: Rising Moderately
The TTU Trend Barometer surged 16 percentage points from 45% to 61%, the most significant weekly improvement since the barometer rose from 45% to 68% in late January. The reading has crossed back above the critical 55% threshold into "Very Strong" territory, ending three weeks in the neutral zone. The 10-day rate of change shifted from "Falling Weakly" to "Rising Moderately," confirming that trend conditions are improving with genuine momentum rather than merely stabilising.
The recovery is broad-based. Metals trends are strengthening rapidly, with silver, platinum, and gold all extending powerful moves that generate trend signals across multiple timeframes. Energy trends are re-establishing, with heating oil's breakout and crude oil's recovery providing new directional opportunities. The bond rally's resumption adds further trend breadth. Grains continue their multi-week constructive run. The net effect is a meaningful expansion in the number of markets exhibiting medium-to-strong trends, which is precisely what the barometer measures.
The path from 43% to 61% over the past two weeks contrasts sharply with the deterioration from 68% to 43% that preceded it. The barometer has now recovered more than two-thirds of the 25-point decline from the January peak of 68%. The question posed repeatedly in recent reports, whether the environment would deteriorate further or recover, has been answered emphatically. The recovery is not tentative. It is decisive. The 55% threshold has been reclaimed with room to spare. Momentum is firmly positive. The path from 61% toward the 68% January high is now within reach.
At 61% with moderately rising momentum, the barometer sends a strongly constructive message for the first time since late January. The environment has shifted from neutral to very strong, a zone where systematic trend-following strategies historically generate their best returns. The divergence between the advancing SG Trend Index (+3.46% MTD, +8.33% YTD) and the barometer has closed significantly. Fund performance is no longer running ahead of the environment. The two are moving together. This alignment is the strongest foundation for sustained returns.
The Top Traders Unplugged (TTU) Trend Barometer is a proprietary tool that measures the percentage of markets with medium to strong trends. Similar to a thermometer, where 0 degrees Celsius equates to freezing, a TTU Trend Barometer reading below 40% indicates a “cold” environment for trend-following, while readings above 55% signal a “hotter,” more favorable trend environment.
Weekly Asset Class Snapshot
| Asset Class | % Move | Prev |
|---|---|---|
| Metal | +5.65% | +3.24% |
| Grains | +1.59% | +0.89% |
| Volatility Index | +2.04% | −4.56% |
| Energy | +1.08% | +3.04% |
| Bonds | +0.70% | −0.22% |
| Currency | +0.20% | −0.65% |
| Equity Index | +0.12% | +0.82% |
| Soft Commodity | −1.12% | −3.94% |
| Meats | −1.88% | +1.21% |
| Crypto | −3.32% | −1.47% |
Source: Finviz.com
Metal (+5.65 percent | prev +3.24 percent)
Metals exploded higher to claim the top of the asset class rankings for a second consecutive week, and this time by a commanding margin. Silver was the standout at +12.42%, the best single-asset performance across all 49 markets. The weekly chart shows prices surging to $94.39, extending the parabolic rally that has defined early 2026. Platinum gained 9.08% to reach $2,376, a powerful acceleration that took the contract to levels not seen since early 2025. Gold posted a 3.29% gain to push above $5,296, extending to fresh all-time highs for the fourth consecutive week. Copper added 2.73% to $6.05, and palladium rose 0.73% to $1,828. All five metals were positive for a second consecutive week, a clean sweep that confirms the sector as the most coherent trending complex in global futures. The weekly charts across the metals complex show universal strength: gold's steady parabolic advance, silver's explosive breakout, platinum's powerful acceleration, and copper's quiet steady climb. The breadth and conviction of the metals rally is the strongest signal in the market.
Energy (+1.08 percent | prev +3.04 percent)
Energy posted a second consecutive positive week, though the gains narrowed from last week's 3.04% surge. Heating oil remained the star performer with a 7.59% gain, extending its breakout to $2.59 on the weekly chart and continuing the powerful advance that began last week. Crude oil Brent added 1.42% to reach $73.21, and WTI gained 0.81% to $67.30, both printing constructive candles that consolidate last week's strong gains. Gasoline RBOB rose 1.29%. Ethanol added a modest 0.54%. Natural gas remained the outlier, declining 4.19% to $2.86, continuing its extended correction from the January highs. The weekly chart shows natural gas settling into a lower range, though the rate of decline is moderating. The energy complex remains bifurcated: petroleum products are trending higher with conviction while natural gas remains in corrective mode. For trend followers, the petroleum trend is maturing and gaining credibility with each consecutive positive week.
Grains (+1.59 percent | prev +0.89 percent)
Grains posted a fourth consecutive positive week with broadening participation. Soybean oil led at +4.30%, extending its breakout on the weekly chart to $51.77. Rough rice bounced sharply at +2.24% after last week's devastating 7.40% collapse, recovering to $10.75 on the weekly chart. Soybean meal gained 2.14% to $320. Corn added 1.99% to $448.25, wheat rose 1.94% to $591.50, and soybeans climbed 1.52% to $1,170. Canola was essentially flat at +0.01%. Oats was the lone decliner at -1.46%, giving back some of last week's 4.93% surge. Seven of eight components posted positive returns, and the sector average improved from +0.89% to +1.59%. The weekly charts show an increasingly constructive picture across the complex. Wheat's continued advance to $591.50, corn's steady climb, and soybean oil's breakout all suggest genuine trend formation in the agricultural space. The grain rally is now four weeks old and broadening, making it one of the most reliable sectoral trends in the current environment.
Bonds (+0.70 percent | prev -0.22 percent)
Bonds resumed their rally after last week's pause, with all four instruments posting positive returns. The 30-year bond led at +1.26%, recovering decisively from last week's modest -0.32% decline. The weekly chart at $118.65 shows the contract maintaining its uptrend from the January lows. The 10-year note gained 0.83% to $113.91, the 5-year note added 0.53% to $110.17, and the 2-year note edged up 0.17% to $104.83. The weekly charts across the curve show constructive candles that confirm the broader uptrend remains intact. Last week's pause proved to be exactly what the prior report suggested: a consolidation breather rather than a trend reversal. The resumption of gains across all four maturities reinforces the bull case for duration. For systematic trend followers, the bond sector continues to offer clean directional signals with manageable volatility.
Equity Index (+0.12 percent | prev +0.82 percent)
Equities delivered a mixed week with a near-flat sector average. The Nikkei 225 was the standout, surging 2.73% to 38,640, reversing last week's -0.82% decline with a strong weekly candle. Euro Stoxx 50 added 0.28% and the DAX edged up 0.21%, consolidating after last week's strong European rally. On the negative side, US indices were narrowly lower: Nasdaq 100 fell 0.25%, S&P 500 declined 0.49%, Russell 2000 dropped 1.28%, and DJIA lost 1.36%. The weekly charts show the S&P 500 at 6,875 and Nasdaq at 24,957 consolidating near recent highs, while the Russell 2000 at 2,629 and DJIA at 48,909 showed more notable weakness. The DAX at 25,236 and Euro Stoxx 50 at 5,117 remain in their established uptrends. The VIX rose 2.04% to 20.55, a modest uptick that reflects the mild equity uncertainty. For trend followers, European and Japanese equity exposure continues to offer the most constructive signals, while US indices are in a period of consolidation and internal divergence.
Currency (+0.20 percent | prev -0.65 percent)
Currencies posted a modest positive week on average, reversing last week's dollar-strength-driven decline. The Swiss franc led at +0.88%, followed by the Australian dollar at +0.51%, Canadian dollar at +0.38%, New Zealand dollar at +0.36%, and euro at +0.30%. The Japanese yen declined 0.62%, extending its reversal from the prior weeks' strength. The British pound was marginally negative at -0.04%. The US dollar index weakened 0.17%, continuing its broader downtrend with the weekly chart showing the index at 97.62. The weekly charts show the euro at 1.1824 and Swiss franc at 1.3817 both consolidating within their recent ranges, while the yen at 0.6417 continues to oscillate without clear directional commitment. The currency sector lacks the strong trending characteristics of metals or energy, with week-to-week reversals reflecting rotational flows rather than sustained directional moves.
Soft Commodity (-1.12 percent | prev -3.94 percent)
Soft commodities remained negative on aggregate but improved significantly from last week's -3.94% average. Orange juice bounced 6.80% to $179.00, a partial recovery after weeks of decline, with the weekly chart showing prices attempting to stabilise from the extended downtrend. Sugar edged up 0.14%. Cotton was marginally negative at -0.03%. Coffee fell 1.73% to $280.05, continuing its pullback from recent highs. Lumber dropped 2.75%. Cocoa crashed another 9.13% to approximately $2,899, extending its brutal bear market with prices now below $3,000 for the first time since 2023. The weekly chart shows the collapse continuing with no signs of capitulation or stabilisation. The sector remains deeply bifurcated. Cocoa's accelerating decline continues to dominate and short positions have been enormously profitable. Orange juice's bounce provides tentative evidence of base-building. But the extreme volatility across the complex makes the soft commodity sector the most challenging environment for position sizing and risk management.
Meats (-1.88 percent | prev +1.21 percent)
Meats reversed last week's recovery, declining sharply with the sector average falling to -1.88%. Live cattle led the decline at -4.04% to $232.10, a significant break from the elevated range that had characterised recent trading. The weekly chart shows prices pulling back from the highs, potentially beginning a correction after the extended rally. Feeder cattle dropped 3.79% to $350.98, a notable decline that reinforces the bearish signal from the broader cattle complex. Lean hogs provided the only positive return at +2.19% to $95.83, continuing to recover from its recent sharp decline. The cattle complex's weakness is a notable development after months of sustained uptrend. Two weeks of divergence between cattle weakness and hog recovery suggest the sector may be entering a transitional phase for trend-following systems.
Volatility Index (+2.04 percent | prev -4.56 percent)
The VIX rose 2.04% to 20.55 on the weekly chart, a modest uptick after last week's 4.56% decline. The move reflects the mild equity weakness rather than a significant shift in volatility expectations. The VIX remains near the 20 level, oscillating within a narrow range that suggests neither complacency nor panic. For systematic strategies, the VIX continues to exhibit the mean-reverting behaviour that makes it challenging for trend-following approaches. The absence of a sustained directional move limits its contribution to portfolio returns.
Crypto (-3.32 percent | prev -1.47 percent)
Bitcoin declined 3.32% to approximately $65,765, accelerating its downside after two weeks of diminishing selling pressure. The weekly chart shows the cryptocurrency breaking lower from its recent consolidation range, with the bearish trend that has characterised 2026 reasserting itself. The three-week sequence of -2.03%, -1.47%, and now -3.32% suggests the consolidation has resolved to the downside rather than forming a base. For trend-following systems, Bitcoin remains firmly in bear territory. Short or flat positioning would be the appropriate systematic response to the continued weakness.
Performance Highlights – This Week’s Market Leaders & Laggards
Source: Finviz.com
Top Market Movers
Top Gainers
1. Silver: +12.42 percent
Silver delivered the week's best performance and the strongest single-asset move of 2026 to date. The 12.42% surge took prices to $94.39 on the weekly chart, a stunning continuation of the rally that has defined precious metals in 2026. The weekly candle is enormous in both range and conviction, with the move driven by a combination of safe-haven demand, industrial applications, and momentum. For systematic followers, silver's trend is now one of the most powerful across all asset classes, and the breakout to multi-year highs generates strong signals across multiple timeframes.
2. Platinum: +9.08 percent
Platinum surged 9.08% to $2,376, the second-best performer across all 49 markets and a powerful acceleration from last week's already-strong 4.76% gain. The weekly chart shows a dramatic breakout, with the precious-industrial metal reclaiming territory not seen since early 2025. The back-to-back weeks of 4.76% and 9.08% gains represent one of the most decisive trend accelerations in any market this year. Combined with silver's explosion and gold's steady advance, the precious metals complex is firing on all cylinders.
3. Heating Oil: +7.59 percent
Heating oil gained 7.59% to reach $2.59 on the weekly chart, extending last week's 8.29% breakout. Back-to-back weeks of 8.29% and 7.59% gains represent an extraordinary run that has taken the contract to its highest levels since October. The weekly chart shows a clear trend re-establishment with strong volume confirmation. For trend-following systems, heating oil has transitioned from a breakout signal to an established trend in just two weeks.
4. Orange Juice: +6.80 percent
Orange juice bounced 6.80% to $179.00, a notable recovery after last week's 7.66% decline and the relentless selling pressure that preceded it. The weekly chart shows prices attempting to form a base, though it is too early to determine whether this represents genuine stabilisation or another temporary bounce within the broader downtrend. The OJ market continues to exhibit extreme weekly volatility, making it a challenging environment for systematic approaches.
Top Losers
1. Cocoa: -9.13 percent
Cocoa's collapse continued with a further 9.13% decline, taking the contract to approximately $2,899, below $3,000 for the first time since 2023. This follows last week's 13.48% crash and the prior week's 14.30% collapse. The weekly chart shows no sign of capitulation or stabilisation, with the bear market now having erased roughly 76% of the contract's value from the 2024 highs. For trend followers, the short cocoa trade remains one of the year's most profitable positions, though the pace of decline continues to raise the question of how much further the move can extend.
2. Natural Gas: -4.19 percent
Natural gas fell 4.19% to $2.86, extending its correction from the historic January rally for a fourth consecutive week. The weekly chart shows prices settling into a lower range, with the contract now trading well below the $3.00 level. The cumulative decline from the January peak continues to grow, though the week-over-week rate of decline has moderated from the initial 21% plunge. The correction appears to be maturing, but the trend remains bearish.
3. Live Cattle: -4.04 percent
Live cattle declined 4.04% to $232.10, the sharpest weekly drop in the meats complex and a significant development for a contract that had been in an established uptrend for months. The weekly chart shows a clear break from recent highs, with the pullback potentially signalling the beginning of a more meaningful correction. Combined with feeder cattle's 3.79% decline, the cattle complex is sending bearish signals that trend-following systems will need to assess carefully.
4. Feeder Cattle: -3.79 percent
Feeder cattle dropped 3.79% to $350.98, reinforcing the bearish message from the broader cattle complex. The weekly chart shows prices pulling back from the highs in a move that, combined with live cattle's weakness, suggests the multi-month cattle uptrend may be transitioning. The simultaneous weakness across both cattle contracts adds conviction to the signal and may prompt systematic systems to reduce or reverse positioning.
Portfolio View - Positioning and Impact
Metals positioning delivered the week's strongest systematic returns by a wide margin. Long silver exposure was the standout contributor with a 12.42% gain, the single best position-level return across all markets. Platinum added an exceptional 9.08%, while gold's continued 3.29% advance extended the gains from what remains the single most consistent trend in global futures. Copper's 2.73% gain and palladium's 0.73% rise were also additive. The clean sweep of positive returns across all five metals for a second consecutive week makes the sector the dominant portfolio driver.
Energy positioning continued to contribute positively for a second week. Long heating oil exposure was again the standout, contributing a 7.59% gain. Crude oil longs in both Brent (+1.42%) and WTI (+0.81%) added modestly, and gasoline RBOB (+1.29%) was also positive. Natural gas remained the detractor at -4.19%, though its impact was once again overwhelmed by the petroleum complex's strength. The net energy contribution was positive for a second consecutive week, confirming the re-establishment of trend opportunities in the petroleum space.
Grains positioning generated positive returns for a fourth consecutive week. Long soybean oil (+4.30%) was the primary contributor, followed by rough rice's bounce (+2.24%), soybean meal (+2.14%), corn (+1.99%), wheat (+1.94%), and soybeans (+1.52%). Oats was the sole detractor at -1.46%. The consistent four-week positive contribution from grains underscores the sector's growing importance in the portfolio mix and the benefits of diversification across agricultural markets.
Bonds positioning returned to positive territory after last week's pause. The 30-year bond's 1.26% gain was the primary contributor, with the 10-year note's 0.83% advance adding further. Duration positioning was rewarded as the rally resumed after a single week of consolidation. Most trend-following systems would maintain long duration exposure, and the resumption of gains validates that positioning.
Equity positioning delivered mixed results. Long Nikkei 225 exposure contributed strongly at +2.73%, reversing last week's drag. European equity longs in Euro Stoxx 50 (+0.28%) and DAX (+0.21%) were marginally positive. US equity positioning was a modest drag, with Russell 2000 (-1.28%) and DJIA (-1.36%) leading the declines. The net equity contribution was approximately flat, with international gains offsetting domestic weakness.
Currency positioning was a marginal positive, reversing last week's drag. Long CHF (+0.88%) and AUD (+0.51%) positions contributed modestly. The yen's -0.62% decline trimmed gains from JPY-long positions for a second consecutive week, though the magnitude was smaller than last week's 1.60% reversal. The currency sector's contribution remains muted relative to metals and energy, reflecting the absence of strong trending conditions.
Soft commodity positioning generated mixed results. Short cocoa positions, where held, were highly profitable as the contract crashed 9.13%. Long orange juice positions, where held, benefited from the 6.80% bounce. Coffee longs detracted with a 1.73% decline, and lumber positions lost 2.75%. The sector continues to reward short positioning in the declining contracts while the extreme volatility demands careful risk management.
Bitcoin exposure was a more significant detractor this week at -3.32%, reversing the pattern of diminishing negative impact that had characterised recent weeks. Most trend-following systems would remain flat or short, with the renewed decline reinforcing the bearish positioning signal.
Final Reflections: Metals Explode and the Barometer Surges to Very Strong as Trend Conditions Accelerate
The final week of February delivered the most constructive combination of performance and environmental improvement since the start of 2026. Metals exploded higher. The barometer surged past the 55% threshold to 61%. Systematic fund performance accelerated. And the environment moved decisively to match the returns.
Three observations define the week:
- The metals complex has become the dominant driver of both performance and trend breadth: Silver's 12.42% surge, platinum's 9.08% advance, gold's steady 3.29% extension to all-time highs, and positive returns across all five components for a second consecutive week represent the most powerful sectoral performance of 2026. These are not isolated moves. They are broad-based, accelerating, and generating strong trend signals across multiple timeframes. The metals rally is now driving both portfolio returns and barometer improvement simultaneously, providing the dual benefit that defines the best trend-following environments.
- The barometer's surge from 45% to 61% is decisive, not tentative: The TTU Barometer's 16-point surge crosses the critical 55% threshold into "Very Strong" territory with "Rising Moderately" momentum. This is not the marginal 2-point improvement of two weeks ago. This is the kind of move that changes the narrative entirely. The barometer has now recovered more than two-thirds of the 25-point decline from the January peak of 68%, climbing from its 43% low to 61% in just two weeks. The environment has shifted from neutral to very strong. For systematic trend followers, this means conditions have moved from headwind to tailwind. The path from 61% toward the 68% January high is now within reach. New trends in metals, energy, bonds, and grains are forming and strengthening simultaneously. The critical question is no longer whether the environment will recover. It has recovered. The question is now whether the momentum can push the barometer back toward the January peak.
- The performance-environment divergence has resolved in the best possible way: The SG Trend Index's advance to +3.46% MTD and +8.33% YTD, combined with the barometer's recovery to 61%, represents the convergence that was needed. Three weeks ago, the divergence between strong fund performance and deteriorating trend conditions was flagged as unsustainable. That divergence has now resolved decisively in the constructive direction: the environment has risen to meet the performance, rather than performance falling to match a weakening environment. Fund returns and trend conditions are now aligned and moving together. This is the strongest foundation for sustained returns.
The year-to-date return of +8.33% is building a substantial cushion. The barometer at 61% has surged into very strong territory. The metals rally provides both momentum and breadth. Energy trends are maturing. Bonds have resumed their advance. Grains are on a four-week winning streak. The combination of accelerating returns and improving conditions creates the most favourable backdrop since the start of 2026.
Metals lead. The barometer surges. Conviction accelerates.

List of Resources used in the Week in Review
Important Disclaimers
This document is directly solely to Accredited Investors, Qualified Eligible Participants, Qualified Clients and Qualified Purchasers. No investment decision should be made until prospective investors have read the detailed information in the fund offering documents of any manager mentioned in this document. This document is furnished on a confidential basis only for the use of the recipient and only for discussion purposes and is subject to amendment This document is neither advice nor a recommendation to enter into any transaction. This document is not an offer to buy or sell, nor a solicitation of an offer to buy or sell, any security or other financial instrument. This presentation is based on information obtained from sources that TopTradersUnplugged (“TTU”) (“considers to be reliable however, TTU makes no representation as to, and accepts no responsibility or liability for, the accuracy or completeness of the information. TTU has not independently verified third party manager or benchmark information, does not represent it as accurate, true or complete, makes no warranty, express or implied regarding it and shall not be liable for any losses, damages, costs or expenses relating to its adequacy, accuracy, truth, completeness or use.
All projections, valuations, and statistical analyses are provided to assist the recipient in the evaluation of the matters described herein. Such projections, valuations and analyses may be based on subjective assessments and assumptions and may use one among many alternative methodologies that produce different results accordingly, such projections, valuations and statistical analyses should not be viewed as facts and should not be relied upon as an accurate prediction of future events. There is no guarantee that any targeted performance will be achieved Commodity trading involves substantial risk of loss and may not be suitable for everyone
TTU is not and does not purport to be an advisor as to legal, taxation, accounting, financial or regulatory matters in any jurisdiction. The recipient should independently evaluate and judge the matters referred to herein. TTU does not provide advice or recommendations regarding an investor’s decision to allocate to funds or accounts managed by any manager (“or to maintain or sell investments in funds or accounts managed by any manager, and no fiduciary relationship under ERISA is created by the investor investing in funds or accounts managed by any manager, or through any communication between TTU and the investor
In reviewing this document, it should be understood that the past performance results of any asset class, or any investment or trading program set forth herein, are not necessarily indicative of any future results that may be achieved in connection with any transaction. Any persons subscribing for an investment must be able to bear the risks involved and must meet the suitability requirements relating to such investment. Some or all alternative investment programs discussed herein may not be suitable for certain investors This document is directed only to persons having professional experience in matters relating to investments. Any investment or investment activity to which this document relates is available only to such investment professionals. Persons who do not have professional experience in matters relating to investments should not rely upon this document.
This document and its contents are proprietary information of TTU and may not be reproduced or otherwise disseminated in whole or in part without TTU’s prior written consent.
This document contains simulated or hypothetical performance results that have certain inherent limitations AND SHOULD BE VIEWED FOR ILLUSTRATIVE PURPOSES. Unlike the results shown in an actual performance record, these results do not represent actual trading. HYPOTHETICAL PERFORMANCE RESULTS HAVE MANY INHERENT LIMITATIONS, SOME OF WHICH ARE DESCRIBED BELOW. NO REPRESENTATION IS BEING MADE THAT ANY ACCOUNT WILL OR IS LIKELY TO ACHIEVE PROFITS OR LOSSES SIMILAR TO THOSE SHOWN IN FACT, THERE ARE FREQUENTLY SHARP DIFFERENCES BETWEEN HYPOTHETICAL PERFORMANCE RESULTS AND THE ACTUAL RESULTS SUBSEQUENTLY ACHIEVED BY ANY PARTICULAR INVESTMENT ACCOUNT.
ONE OF THE LIMITATIONS OF HYPOTHETICAL PERFORMANCE RESULTS IS THAT THEY ARE GENERALLY PREPARED WITH THE BENEFIT OF HINDSIGHT IN ADDITION, HYPOTHETICAL TRADING DOES NOT INVOLVE FINANCIAL RISK, AND NO HYPOTHETICAL TRADING RECORD CAN COMPLETELY ACCOUNT FOR THE IMPACT OF FINANCIAL RISK IN ACTUAL TRADING FOR EXAMPLE, THE ABILITY TO WITHSTAND LOSSES OR TO ADHERE TO A PARTICULAR TRADING PROGRAM OR OTHER ASSET.
There are numerous other factors related to the markets in general or to the implementation of any specific trading program which cannot be fully accounted for in the preparation of hypothetical performance results and all of which can adversely affect actual trading results. No representation is being made that any investment will or is likely to achieve profits or losses similar to those being shown.
Most Comprehensive Guide to the Best Investment Books of All Time

Most Comprehensive Guide to the Best Investment Books of All Time
Get the most comprehensive guide to over 600 of the BEST investment books, with insights, and learn from some of the wisest and most accomplished investors in the world. A collection of MUST READ books carefully selected for you. Get it now absolutely FREE!
Get Your FREE Guide HERE!