


Trend Following - Week in Review—February 6, 2026

"Metals Bounce and Grains Surge as Energy Gives Back Gains"
This Week in Trend – 6 February 2026
Welcome to This Week in Trend, your weekly view into the evolving structure of global futures markets and the behaviour of systematic trend following. This edition covers conditions through the close of US markets on Friday, 6 February 2026.
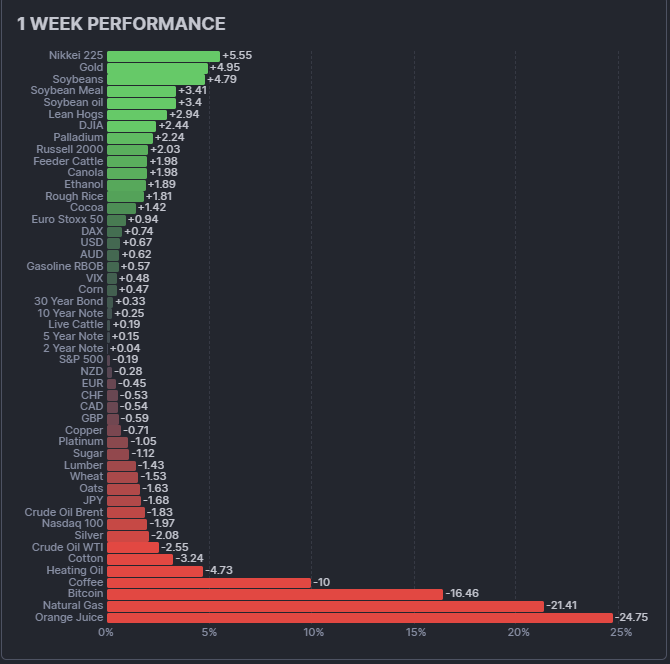
The story of the week was a sharp reversal of fortunes across several sectors. Last week’s dominant energy complex gave back significant ground, with natural gas plunging 21.41% and heating oil falling 4.73%, reversing much of the historic rally. Meanwhile, metals staged a notable recovery from last week’s collapse, led by gold (+4.95%) and palladium (+2.24%), while grains surged on soybean complex strength (+4.79% soybeans, +3.41% soybean meal).
Equities posted a mixed but broadly positive week. The Nikkei 225 led all assets with a 5.55% gain, while the DJIA rose 2.44% and the Russell 2000 added 2.03%. Soft commodities remained under severe pressure, with orange juice crashing 24.75% and coffee dropping 10%. Bitcoin extended its decline with a 16.46% weekly loss.
The trend environment moderated after last week’s surge. The TTU Barometer pulled back from 68% to 55%, remaining in "Strong" territory but with the 10-day rate of change shifting to "Falling Weakly.” The SG Trend Index reset for February at -0.43% month-to-date, with the year-to-date reading at +4.26%.
This was a week of mean reversion and sector rotation within a still-favourable but cooling trend environment.
SG Trend Index Performance
Month to date: -0.43 percent
Year to date: +4.26 percent
Last week:
Month to date: +7.04 percent (January final)
Year to date: +7.04 percent (January final)
The SG Trend Index opened February with a -0.43% month-to-date reading, a notable shift after January's strong +7.04% finish. The year-to-date figure of +4.26% reflects the erosion of some January gains as the energy reversal and continued soft commodity weakness weighed on systematic portfolios in the early days of the new month.
The reversal in energy, particularly natural gas giving back 21.41% after surging 20.64% last week, likely created significant turbulence for portfolios that had built long energy exposure. However, the partial recovery in metals (gold +4.95%) and broad gains across grains and equities provided some offset. The month is young and the trend environment remains constructive, but the early February drawdown underscores the whipsaw risk inherent in volatile markets.
TTU Trend Barometer
Current reading: 55 percent
Previous reading: 68 percent
10-day rate of change: Falling Weakly
The TTU Trend Barometer pulled back 13 percentage points from 68% to 55%, slipping from 'Very Strong' to the boundary of 'Strong' territory. This is a significant decline that places the barometer right at the 55% threshold that separates a favourable trend environment from neutral. The pullback was driven by the violent reversals in energy and the continued churn across commodity sectors, which overwhelmed the positive contributions from recovering metals and surging grains.
The 10-day rate of change flipped from 'Rising Rapidly' to 'Falling Weakly,' indicating that trend momentum has now turned negative. This is a notable shift. Last week the barometer was rising rapidly from 45% to 68%; this week it is falling, suggesting that trend breakdowns are now outpacing new trend formation. The energy reversal and soft commodity rout are the primary culprits, though the breadth of weakness appears broader than any single sector.
At 55% with weakly negative momentum, the barometer sits at a critical juncture. The reading is technically still in 'Strong' territory, but any further deterioration would push conditions into the neutral zone where trend-following historically faces headwinds. The opportunity set is rotating rather than expanding. Energy trends have cooled, but equity uptrends (particularly Japanese and European indices), grain trends, and precious metals recovery are providing alternative directional opportunities. Whether these emerging trends can stabilise the barometer will be the key question for the week ahead.
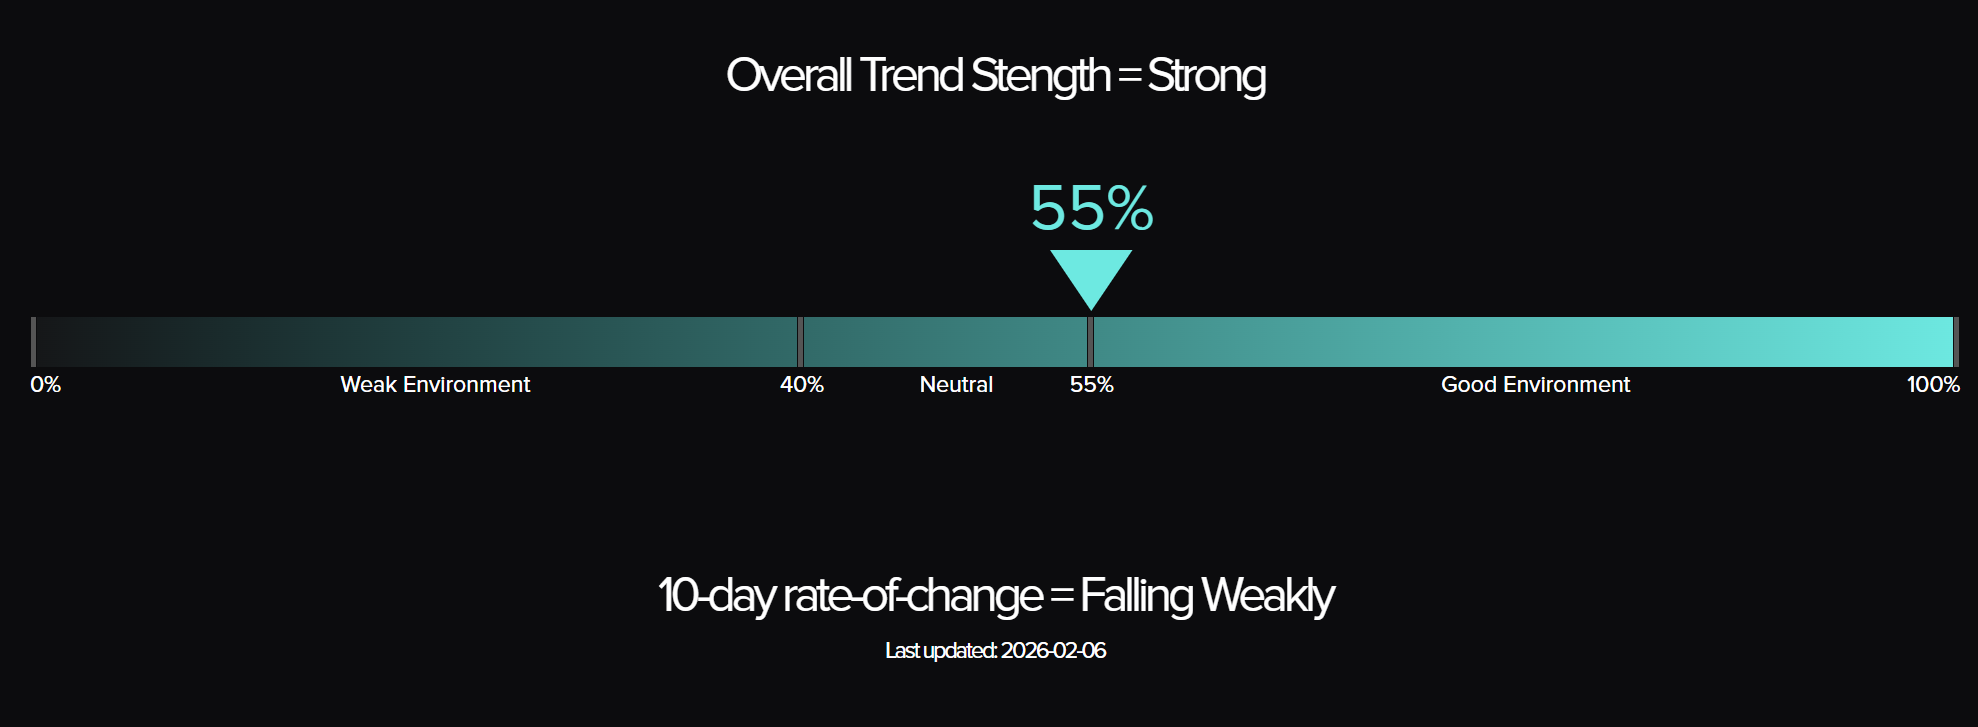
The Top Traders Unplugged (TTU) Trend Barometer is a proprietary tool that measures the percentage of markets with medium to strong trends. Similar to a thermometer, where 0 degrees Celsius equates to freezing, a TTU Trend Barometer reading below 40% indicates a “cold” environment for trend-following, while readings above 55% signal a “hotter,” more favorable trend environment.
Weekly Asset Class Snapshot
| Asset Class | % Move | Prev |
| Meats | +1.70% | −0.36% |
| Grains | +1.59% | +0.49% |
| Equity Index | +1.36% | −0.41% |
| Metal | +0.67% | −13.38% |
| Volatility Index | +0.48% | +3.81% |
| Bonds | +0.19% | +0.08% |
| Currency | −0.35% | +0.76% |
| Energy | −4.68% | +9.01% |
| Soft Commodity | −6.52% | −2.37% |
| Crypto | −16.46% | −6.39% |
Source: Finviz.com
Meats (+1.70 percent | prev −0.36 percent) - Meats bounced back into positive territory after last week's decline. Lean hogs led with a 2.94% gain, followed by feeder cattle (+1.98%) and live cattle (+0.19%). The sector's recovery was broad-based, with cattle markets showing continued strength in their longer-term uptrends. The weekly charts confirm constructive price action, with feeder cattle maintaining its position near all-time highs and live cattle holding support after recent consolidation.
Grains (+1.59 percent | prev +0.49 percent) - Grains surged this week with a complete reversal of last week's internal dynamics. The soybean complex dominated: soybeans led with a 4.79% gain, soybean meal added 3.41%, and soybean oil rose 3.4%. Canola gained 1.98% and rough rice added 1.81%. However, corn was only marginally positive at 0.47%, while wheat fell 1.53% and oats dropped 1.63%. The soybean complex's strength reversed last week's weakness, as South American weather concerns and export demand supported prices.
Equity Index (+1.36 percent | prev −0.41 percent) - Equities posted a strong week after last week's modest decline. The Nikkei 225 led all assets globally with a 5.55% surge, while the DJIA gained 2.44% and Russell 2000 rose 2.03%. Euro Stoxx 50 added 0.94% and DAX rose 0.74%. The S&P 500 was essentially flat at −0.19%, while Nasdaq 100 was the notable laggard at −1.97%. The week's strength was led by value and international indices, with tech underperforming. The Nikkei's weekly chart shows a powerful recovery from the January dip, pushing toward the 56,500 level.
Metal (+0.67 percent | prev −13.38 percent) - Metals staged a partial recovery after last week's devastating collapse. Gold led with a 4.95% gain, rebounding from last week's 5.41% decline and pushing to fresh highs near $4,989. Palladium gained 2.24%, recovering some of last week's 16% plunge. However, the recovery was uneven: copper fell 0.71%, platinum declined 1.05%, and silver dropped 2.08%. The precious metals' bounce suggests the longer-term uptrend remains intact, though the industrial metals continue to lag. Gold's weekly chart shows a strong recovery candle following last week's selloff, reinforcing the powerful long-term bull trend.
Volatility Index (+0.48 percent | prev +3.81 percent) - The VIX edged up 0.48%, a markedly slower pace than last week's 3.81% gain. Implied volatility remains modestly elevated but is stabilising, suggesting the equity market is finding a more comfortable equilibrium. The weekly chart shows the VIX settling near the 19 level, below recent highs but above the mid-2025 lows. The deceleration in VIX gains is consistent with the improving equity market picture this week.
Bonds (+0.19 percent | prev +0.08 percent) - Bonds posted a third consecutive week of marginal gains, maintaining their quiet stabilisation pattern. The 30-year bond led with a 0.33% gain, followed by the 10-year note (+0.25%), 5-year note (+0.15%), and 2-year note (+0.04%). The gentle positive bias across the curve suggests a gradual normalisation of rates expectations. The weekly charts show bonds consolidating after the mid-2025 selloff, with the longer end beginning to base.
Currency (−0.35 percent | prev +0.76 percent) - Currencies reversed last week's gains against the US dollar, with the dollar index edging higher (+0.67%). The USD's modest strengthening came at the expense of most major currencies: JPY fell 1.68%, GBP dropped 0.59%, CAD lost 0.54%, CHF declined 0.53%, and EUR slipped 0.45%. NZD fell 0.28%, while AUD was the lone gainer at +0.62%. The reversal in dollar direction after several weeks of weakness bears watching. The weekly charts show most currency pairs consolidating within recent ranges.
Energy (−4.68 percent | prev +9.01 percent) - Energy gave back significant ground after last week's extraordinary rally. Natural gas plunged 21.41%, reversing much of its recent historic surge, as warmer weather forecasts undercut the heating demand thesis. Heating oil fell 4.73%, crude oil WTI dropped 2.55%, and Brent declined 1.83%. Gasoline RBOB gained a modest 0.57% while ethanol rose 1.89%. The natural gas reversal was the week's most significant single-asset move, highlighting the volatility inherent in weather-driven markets. The weekly chart shows a sharp bearish candle that nonetheless leaves prices well above the 2025 lows.
Soft Commodity (−6.52 percent | prev −2.37 percent) - Softs declined sharply for the third consecutive week, with the rout in several contracts accelerating. Orange juice collapsed 24.75%, the week's worst individual performer, as supply conditions improved and demand waned. Coffee plunged 10% to extend its recent selloff. Cotton fell 3.24%, lumber dropped 1.43%, and sugar declined 1.12%. Cocoa was the lone bright spot, gaining 1.42% for a modest recovery after weeks of severe pressure. The sector remains in a deeply challenging trend environment with broad-based weakness.
Crypto (−16.46 percent | prev −6.39 percent) - Bitcoin's decline accelerated dramatically, falling 16.46% for its third consecutive weekly loss. Prices have now dropped well below the $75,000 level, giving back a substantial portion of the late-2025 rally. The weekly chart shows an accelerating downtrend with successive lower highs and lower lows since the December peak. The severity of the decline suggests systematic strategies would have reduced or eliminated long exposure, with potential short signals now emerging.
Performance Highlights – This Week’s Market Leaders & Laggards
Source: Finviz.com
Top Market Movers
Top Gainers
- Nikkei 225 (+5.55 percent): The Nikkei 225 led all global assets this week with an impressive surge. Japanese equities benefited from yen weakness and continued corporate earnings momentum. The weekly chart shows a powerful recovery from the January dip, with prices pushing back toward the 56,500 level. The index remains in a robust uptrend that has been one of the most consistent trend opportunities over the past two years.
- Gold (+4.95 percent): Gold bounced strongly after last week's 5.41% decline, pushing back toward record highs near $4,989. The recovery confirms the resilience of the long-term precious metals bull trend. The weekly chart shows a constructive recovery candle, with prices holding well above the 2025 breakout levels. Continued central bank buying and geopolitical uncertainty support the structural bid.
- Soybeans (+4.79 percent): Soybeans surged on South American weather concerns and strong export demand, reversing last week's modest decline. The weekly chart shows prices stabilizing above the $11.00 level, attempting to form a base after the prolonged 2024 downtrend. The soybean complex's broad strength (with meal and oil also gaining over 3%) suggests renewed interest in the agricultural space.
- Soybean Meal (+3.41 percent): Soybean meal posted strong gains alongside the broader soybean complex. The protein component benefited from robust global feed demand and tightening supply expectations. The weekly chart shows prices attempting to break higher from the consolidation range near the 303 level.
Top Losers
- Orange Juice (−24.75 percent): Orange juice suffered a devastating weekly collapse as improved supply forecasts and weakening demand hammered prices. The contract has now fallen approximately 75% from its 2024 highs, with the weekly chart showing an accelerating downtrend. The move represents one of the most significant commodity declines of the year, with no signs of a bottom forming.
- Natural Gas (−21.41 percent): Natural gas gave back much of last week's +20.64% surge in a dramatic reversal. Warmer weather forecasts undercut the heating demand narrative that had driven the recent historic rally. The weekly chart shows a sharp bearish candle, though prices remain elevated above the late-2025 lows. The two-week round trip highlights the extreme volatility in the natural gas market and the risks of weather-dependent positioning.
- Bitcoin (−16.46 percent): Bitcoin's decline accelerated sharply, extending losses for a third consecutive week. The digital asset has fallen well below the $75,000 level, erasing much of the late-2025 rally. The weekly chart shows a developing bearish trend with increasing downside momentum. The persistent selling suggests a regime change from the speculative frenzy of late 2025.
- Coffee (−10 percent): Coffee extended its recent sell-off with a sharp 10% decline. The contract has fallen significantly from the October 2025 highs as supply concerns eased and demand expectations moderated. The weekly chart shows a powerful downtrend with limited signs of stabilization. The move continues the broader weakness across the soft commodity complex.
Portfolio View - Positioning and Impact
Energy positioning faced a sharp reversal after last week's exceptional gains. Long natural gas exposure generated significant losses as the contract plunged 21.41%, potentially giving back much of the prior week's profits. Heating oil longs also detracted. Gasoline and ethanol positions provided modest offsets. The speed of the reversal underscores the risk of concentrated energy exposure, particularly in weather-sensitive contracts.
Metals positioning benefited from the partial sector recovery. Long gold exposure generated meaningful gains as the metal rebounded 4.95%. Palladium longs also contributed positively. However, silver and platinum positions continued to detract with further declines. The mixed performance within the sector suggests that gold's trend remains the most robust among the precious metals, while silver and platinum may need further consolidation before re-establishing clear direction.
Equity positioning generated broadly positive returns this week. Long Nikkei 225 exposure was the standout contributor with a 5.55% gain. DJIA and Russell 2000 longs also added positively, while Nasdaq 100 longs detracted modestly. European index exposure contributed via Euro Stoxx 50 and DAX gains. The sector's improved breadth, with six of seven indices posting gains, is an encouraging development for systematic equity strategies.
Grains positioning generated strong returns as the soybean complex surged. Long soybeans, soybean meal, and soybean oil exposure all contributed meaningfully, with canola and rough rice adding further. However, wheat and oats longs detracted. The reversal of last week's internal dynamics, with the soybean complex now leading, benefited portfolios that maintained broad grain exposure.
Soft commodity positioning continued to face severe headwinds for the third consecutive week. Orange juice and coffee longs, where still held, generated devastating losses. Cotton and sugar positions also detracted. The sector's accelerating decline has likely forced further systematic exposure reductions. Short positions in the weakest contracts would have generated significant returns, but the speed and magnitude of the declines make position management challenging.
Rates and FX exposure was modestly positive. Bonds contributed small gains across the curve, with the 30-year bond leading. Currency positions were mixed as the dollar reversed higher. Short USD positions (long foreign currencies) detracted modestly, with JPY weakness being the primary headwind. AUD was the lone currency gainer against the dollar. The reversal in dollar direction may prompt reassessment of recent currency positioning.
Bitcoin exposure was the single largest portfolio detractor this week. The 16.46% decline, the third consecutive weekly loss, likely triggered systematic stop-losses and position exits. The accelerating downtrend suggests most trend-following systems would now be flat or short bitcoin. The severity of the drawdown reinforces the importance of conservative position sizing in the digital asset space.
Final Reflections – Metals Bounce and Grains Surge as Energy Gives Back Gains
The first full week of February delivered a dramatic rotation as last week's winners became this week's losers, and vice versa.
Three observations define the week:
- Energy's reversal highlights the fragility of weather-driven trends. Natural gas's swing from +20.64% to -21.41% in consecutive weeks is a sobering illustration of how quickly commodity trends can reverse. The energy sector flipped from +9.01% to -4.68% in a single week. For trend followers, this whipsaw represents the most challenging market condition: a trend that reverses before positions can be adjusted.
- Mean reversion drove broad-based recovery in beaten-down sectors. Metals bounced (+0.67% vs -13.38%), equities recovered (+1.36% vs -0.41%), and meats turned positive (+1.70% vs -0.36%). Gold's 4.95% recovery and the Nikkei's 5.55% surge demonstrate that trend opportunities continue to emerge even as other trends break down. The rotation from energy into equities and grains broadens the opportunity set.
- The trend environment is cooling and approaching a critical threshold. The TTU Barometer's 13 percentage point pullback from 68% to 55% places it right at the boundary between 'Strong' and neutral territory, with momentum now falling weakly. This is a more cautious signal than last week's reading suggested. The key question is whether emerging trends in equities, grains, and gold can stabilise the barometer before it slips below 55%, which would mark a shift to a more challenging environment for systematic strategies.
The SG Trend Index's February reset to -0.43% MTD, with a year-to-date reading of +4.26%, reflects the early-month turbulence. January's strong +7.04% finish provides a cushion, but the energy whipsaw and bitcoin's continued decline are testing portfolio resilience. The diversity of trend opportunities across equities, grains, and gold offers paths to recovery, but the narrowing barometer leaves less margin for error.
Energy reverses. Sectors rotate. The trend environment holds -- barely.

List of Resources used in the Week in Review
Important Disclaimers
This document is directly solely to Accredited Investors, Qualified Eligible Participants, Qualified Clients and Qualified Purchasers. No investment decision should be made until prospective investors have read the detailed information in the fund offering documents of any manager mentioned in this document. This document is furnished on a confidential basis only for the use of the recipient and only for discussion purposes and is subject to amendment This document is neither advice nor a recommendation to enter into any transaction. This document is not an offer to buy or sell, nor a solicitation of an offer to buy or sell, any security or other financial instrument. This presentation is based on information obtained from sources that TopTradersUnplugged (“TTU”) (“considers to be reliable however, TTU makes no representation as to, and accepts no responsibility or liability for, the accuracy or completeness of the information. TTU has not independently verified third party manager or benchmark information, does not represent it as accurate, true or complete, makes no warranty, express or implied regarding it and shall not be liable for any losses, damages, costs or expenses relating to its adequacy, accuracy, truth, completeness or use.
All projections, valuations, and statistical analyses are provided to assist the recipient in the evaluation of the matters described herein. Such projections, valuations and analyses may be based on subjective assessments and assumptions and may use one among many alternative methodologies that produce different results accordingly, such projections, valuations and statistical analyses should not be viewed as facts and should not be relied upon as an accurate prediction of future events. There is no guarantee that any targeted performance will be achieved Commodity trading involves substantial risk of loss and may not be suitable for everyone
TTU is not and does not purport to be an advisor as to legal, taxation, accounting, financial or regulatory matters in any jurisdiction. The recipient should independently evaluate and judge the matters referred to herein. TTU does not provide advice or recommendations regarding an investor’s decision to allocate to funds or accounts managed by any manager (“or to maintain or sell investments in funds or accounts managed by any manager, and no fiduciary relationship under ERISA is created by the investor investing in funds or accounts managed by any manager, or through any communication between TTU and the investor
In reviewing this document, it should be understood that the past performance results of any asset class, or any investment or trading program set forth herein, are not necessarily indicative of any future results that may be achieved in connection with any transaction. Any persons subscribing for an investment must be able to bear the risks involved and must meet the suitability requirements relating to such investment. Some or all alternative investment programs discussed herein may not be suitable for certain investors This document is directed only to persons having professional experience in matters relating to investments. Any investment or investment activity to which this document relates is available only to such investment professionals. Persons who do not have professional experience in matters relating to investments should not rely upon this document.
This document and its contents are proprietary information of TTU and may not be reproduced or otherwise disseminated in whole or in part without TTU’s prior written consent.
This document contains simulated or hypothetical performance results that have certain inherent limitations AND SHOULD BE VIEWED FOR ILLUSTRATIVE PURPOSES. Unlike the results shown in an actual performance record, these results do not represent actual trading. HYPOTHETICAL PERFORMANCE RESULTS HAVE MANY INHERENT LIMITATIONS, SOME OF WHICH ARE DESCRIBED BELOW. NO REPRESENTATION IS BEING MADE THAT ANY ACCOUNT WILL OR IS LIKELY TO ACHIEVE PROFITS OR LOSSES SIMILAR TO THOSE SHOWN IN FACT, THERE ARE FREQUENTLY SHARP DIFFERENCES BETWEEN HYPOTHETICAL PERFORMANCE RESULTS AND THE ACTUAL RESULTS SUBSEQUENTLY ACHIEVED BY ANY PARTICULAR INVESTMENT ACCOUNT.
ONE OF THE LIMITATIONS OF HYPOTHETICAL PERFORMANCE RESULTS IS THAT THEY ARE GENERALLY PREPARED WITH THE BENEFIT OF HINDSIGHT IN ADDITION, HYPOTHETICAL TRADING DOES NOT INVOLVE FINANCIAL RISK, AND NO HYPOTHETICAL TRADING RECORD CAN COMPLETELY ACCOUNT FOR THE IMPACT OF FINANCIAL RISK IN ACTUAL TRADING FOR EXAMPLE, THE ABILITY TO WITHSTAND LOSSES OR TO ADHERE TO A PARTICULAR TRADING PROGRAM OR OTHER ASSET.
There are numerous other factors related to the markets in general or to the implementation of any specific trading program which cannot be fully accounted for in the preparation of hypothetical performance results and all of which can adversely affect actual trading results. No representation is being made that any investment will or is likely to achieve profits or losses similar to those being shown.
Most Comprehensive Guide to the Best Investment Books of All Time

Most Comprehensive Guide to the Best Investment Books of All Time
Get the most comprehensive guide to over 600 of the BEST investment books, with insights, and learn from some of the wisest and most accomplished investors in the world. A collection of MUST READ books carefully selected for you. Get it now absolutely FREE!
Get Your FREE Guide HERE!