


Trend Following - Week in Review - January 2, 2026

“New Year, Old Rules”
This Week in Trend – 2 January 2026
Welcome to This Week in Trend, your weekly view into the evolving structure of global futures markets and the behaviour of systematic trend following. This edition covers conditions through the close of US markets on Friday, 2 January 2026.
The first trading days of the new year delivered an immediate change in tone. The narrow leadership that defined late December fractured sharply, volatility reasserted itself selectively, and several of the strongest trends of the prior month experienced abrupt reversals.
Markets did not ease into January. They rotated.
What emerged was not disorder, but transition. Leadership shifted, prior winners gave ground, and capital rotated toward defensive and idiosyncratic pockets rather than broad directional alignment. The opening week served as a reminder that calendar turns do not soften exits, and persistence is always conditional.
SG Trend Index Performance
Month to date: 0.00 percent
Year to date: 0.00 percent
Last week:
- Month to date: +2.01 percent
- Year to date: +2.49 percent
As expected, the SG Trend Index reset to zero with the start of the new month and year. While this week’s price action was far from quiet, the index remains flat due to the early-month reset and the absence of sustained follow-through across the broader universe.
The contrast with last week is notable. December ended with performance driven by a highly concentrated metals complex under conditions of extreme volatility compression. January began with that same concentration unwinding sharply.
This was not a week of index-level trend expression. It was a week of recalibration.
TTU Trend Barometer
Current reading: 50 percent
Previous reading: 36 percent
10-day rate of change: Rising moderately
The TTU Trend Barometer rose decisively to 50 percent this week, pushing firmly into the neutral zone and approaching the threshold of a stronger trend environment. Unlike last week’s tentative improvement, this advance is now accompanied by a rising rate of change, signalling that trend participation is not only broader, but improving at the margin.
This shift suggests that recent rotation is beginning to resolve rather than persist. While leadership remains selective, more markets are transitioning from stabilisation into sustained trend conditions. The improvement reflects renewed alignment rather than simple redistribution.
At 50 percent, the barometer no longer describes a fragile environment. Instead, it points to early-stage trend rebuilding, where participation is expanding but conviction is still forming. This remains a regime that rewards discipline and patience, but it is no longer one defined by contraction.

The Top Traders Unplugged (TTU) Trend Barometer is a proprietary tool that measures the percentage of markets with medium to strong trends. Similar to a thermometer, where 0 degrees Celsius equates to freezing, a TTU Trend Barometer reading below 40% indicates a “cold” environment for trend-following, while readings above 55% signal a “hotter,” more favourable trend environment.
Weekly Asset Class Snapshot

Source: Finwiz.com
- Volatility Index (−4.27 percent | prev −3.41 percent)
Volatility compressed further, even as leadership rotated aggressively. This combination reflects controlled liquidation rather than stress-driven disorder. - Crypto (+2.92 percent | prev −0.84 percent)
Crypto rebounded modestly, led by Bitcoin. The move appears corrective rather than trend-forming, but it marks a pause in recent deterioration. - Grains (−2.50 percent | prev +1.43 percent)
Grains rolled over sharply. Weakness across corn, wheat, soybeans and oats reflects failed stabilisation attempts rather than fresh downside acceleration. - Meats (+2.00 percent | prev −0.01 percent)
Meats strengthened, led by feeder and live cattle. This remains a structurally resilient cluster, offering steady trend behaviour with low volatility. - Bonds (−0.26 percent | prev +0.10 percent)
Rates drifted lower across the curve. Trends remain shallow and range bound, offering persistence but little directional conviction. - Energy (−0.75 percent | prev +1.89 percent)
Energy softened. Natural gas reversed sharply after last week’s surge, while crude and refined products continued to lack cohesion. - Metals (−8.62 percent | prev +13.62 percent)
Metals experienced a violent reversal. Palladium, platinum, silver and gold all sold off heavily, marking a decisive break in December’s dominant leadership cluster. - Soft Commodities (−0.44 percent | prev +1.94 percent)
Soft commodities weakened modestly. Sugar, cocoa and cotton extended recent declines, while coffee’s stabilisation failed to develop further. - Equity Index (−0.17 percent | prev +0.85 percent)
Equities slipped slightly. Major indices remain structurally intact, but upside momentum has stalled. - Currency (−0.36 percent | prev +0.63 percent)
FX drifted lower, continuing to express balance rather than sustained directional bias.
Performance Highlights – This Week’s Market Leaders & Laggards
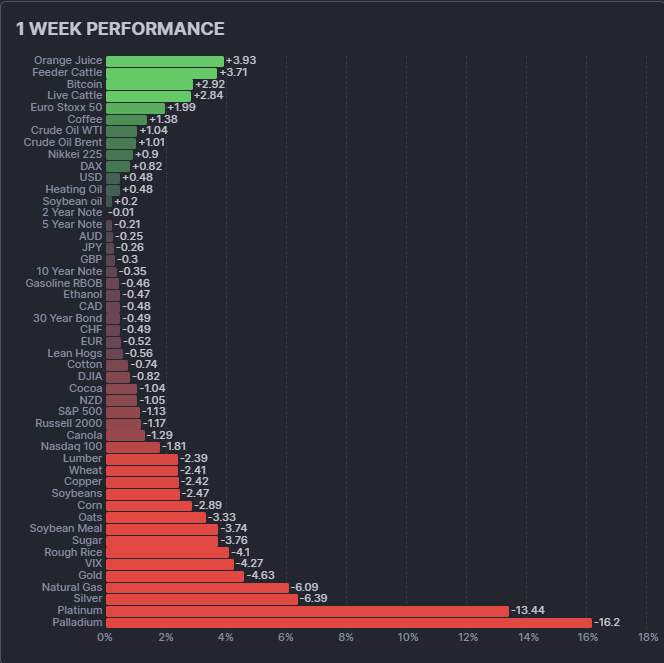
Top Market Movers
Top Gainers
- Orange Juice +3.93 percent
Orange juice extended its advance, continuing to express idiosyncratic strength within soft commodities. - Feeder Cattle +3.71 percent
Feeder cattle strengthened further, reinforcing the meats complex as a stable trend sleeve. - Bitcoin +2.92 percent
Bitcoin rebounded after recent weakness. Structure remains corrective rather than trend-aligned. - Live Cattle +2.84 percent
Live cattle followed feeder cattle higher, maintaining a persistent, low-volatility uptrend.
Top Losers
- Palladium −16.20 percent
Palladium collapsed, decisively ending its December breakout and leading the metals reversal. - Platinum −13.44 percent
Platinum reversed sharply, confirming the loss of metals leadership. - Silver −6.39 percent
Silver broke down from its recent extension, erasing a large portion of last week’s gains. - Gold −4.63 percent
Gold rolled over, completing a coordinated metals unwind rather than an isolated correction.
Portfolio View - Positioning and Impact
Equities
Equity positioning remained largely unchanged. Trends held structurally, but the absence of acceleration favoured patience over rotation.
Metals
Metals shifted from dominant contributor to primary drag. Long exposure faced sharp adverse movement, reinforcing the importance of disciplined exits and fixed risk sizing.
Energy
Energy exposure remained selective. The reversal in natural gas reduced recent gains, while crude and products continued to lack trend quality.
Soft Commodities and Meats
Meats provided positive contribution and structural stability. Soft commodities remained rotational, with selective opportunities but low cluster cohesion.
Rates and FX
Rates and currencies continued to offer limited opportunity. Positioning remained light due to shallow trends and weak persistence.
Crypto
Crypto exposure remained small. The rebound improved near-term structure but did not justify increased allocation.
Final Reflections – New Year, Old Rules
The opening week of January delivered a clean lesson in regime humility.
Three observations define the week:
- Leadership can disappear faster than it forms.
The metals unwind was swift and decisive, reminding us that even the strongest trends remain conditional. - Breadth is improving, but conviction is still forming.
The rise in the TTU Trend Barometer reflects expanding participation, though leadership remains selective. - Volatility compression does not guarantee persistence.
Even in calm conditions, exits matter. Stability does not prevent rotation.
This was not a breakdown week, nor a renewal week. It was a reset. For systematic trend followers, the message is unchanged as the calendar turns. Risk must remain small, patience must remain intact, and exits must be respected without interpretation.
The year may be new, but the rules are not.

List of Resources used in the Week in Review
Important Disclaimers
This document is directly solely to Accredited Investors, Qualified Eligible Participants, Qualified Clients and Qualified Purchasers. No investment decision should be made until prospective investors have read the detailed information in the fund offering documents of any manager mentioned in this document. This document is furnished on a confidential basis only for the use of the recipient and only for discussion purposes and is subject to amendment This document is neither advice nor a recommendation to enter into any transaction. This document is not an offer to buy or sell, nor a solicitation of an offer to buy or sell, any security or other financial instrument. This presentation is based on information obtained from sources that TopTradersUnplugged (“TTU”) (“considers to be reliable however, TTU makes no representation as to, and accepts no responsibility or liability for, the accuracy or completeness of the information. TTU has not independently verified third party manager or benchmark information, does not represent it as accurate, true or complete, makes no warranty, express or implied regarding it and shall not be liable for any losses, damages, costs or expenses relating to its adequacy, accuracy, truth, completeness or use.
All projections, valuations, and statistical analyses are provided to assist the recipient in the evaluation of the matters described herein. Such projections, valuations and analyses may be based on subjective assessments and assumptions and may use one among many alternative methodologies that produce different results accordingly, such projections, valuations and statistical analyses should not be viewed as facts and should not be relied upon as an accurate prediction of future events. There is no guarantee that any targeted performance will be achieved Commodity trading involves substantial risk of loss and may not be suitable for everyone
TTU is not and does not purport to be an advisor as to legal, taxation, accounting, financial or regulatory matters in any jurisdiction. The recipient should independently evaluate and judge the matters referred to herein. TTU does not provide advice or recommendations regarding an investor’s decision to allocate to funds or accounts managed by any manager (“or to maintain or sell investments in funds or accounts managed by any manager, and no fiduciary relationship under ERISA is created by the investor investing in funds or accounts managed by any manager, or through any communication between TTU and the investor
In reviewing this document, it should be understood that the past performance results of any asset class, or any investment or trading program set forth herein, are not necessarily indicative of any future results that may be achieved in connection with any transaction. Any persons subscribing for an investment must be able to bear the risks involved and must meet the suitability requirements relating to such investment. Some or all alternative investment programs discussed herein may not be suitable for certain investors This document is directed only to persons having professional experience in matters relating to investments. Any investment or investment activity to which this document relates is available only to such investment professionals. Persons who do not have professional experience in matters relating to investments should not rely upon this document.
This document and its contents are proprietary information of TTU and may not be reproduced or otherwise disseminated in whole or in part without TTU’s prior written consent.
This document contains simulated or hypothetical performance results that have certain inherent limitations AND SHOULD BE VIEWED FOR ILLUSTRATIVE PURPOSES. Unlike the results shown in an actual performance record, these results do not represent actual trading. HYPOTHETICAL PERFORMANCE RESULTS HAVE MANY INHERENT LIMITATIONS, SOME OF WHICH ARE DESCRIBED BELOW. NO REPRESENTATION IS BEING MADE THAT ANY ACCOUNT WILL OR IS LIKELY TO ACHIEVE PROFITS OR LOSSES SIMILAR TO THOSE SHOWN IN FACT, THERE ARE FREQUENTLY SHARP DIFFERENCES BETWEEN HYPOTHETICAL PERFORMANCE RESULTS AND THE ACTUAL RESULTS SUBSEQUENTLY ACHIEVED BY ANY PARTICULAR INVESTMENT ACCOUNT.
ONE OF THE LIMITATIONS OF HYPOTHETICAL PERFORMANCE RESULTS IS THAT THEY ARE GENERALLY PREPARED WITH THE BENEFIT OF HINDSIGHT IN ADDITION, HYPOTHETICAL TRADING DOES NOT INVOLVE FINANCIAL RISK, AND NO HYPOTHETICAL TRADING RECORD CAN COMPLETELY ACCOUNT FOR THE IMPACT OF FINANCIAL RISK IN ACTUAL TRADING FOR EXAMPLE, THE ABILITY TO WITHSTAND LOSSES OR TO ADHERE TO A PARTICULAR TRADING PROGRAM OR OTHER ASSET.
There are numerous other factors related to the markets in general or to the implementation of any specific trading program which cannot be fully accounted for in the preparation of hypothetical performance results and all of which can adversely affect actual trading results. No representation is being made that any investment will or is likely to achieve profits or losses similar to those being shown.
Most Comprehensive Guide to the Best Investment Books of All Time

Most Comprehensive Guide to the Best Investment Books of All Time
Get the most comprehensive guide to over 600 of the BEST investment books, with insights, and learn from some of the wisest and most accomplished investors in the world. A collection of MUST READ books carefully selected for you. Get it now absolutely FREE!
Get Your FREE Guide HERE!