


Trend Following - Week in Review - January 23, 2026

"Natural Gas Posts Historic Surge as Metals Extend Rally"
This Week in Trend – 23 January 2026
Welcome to This Week in Trend, your weekly view into the evolving structure of global futures markets and the behaviour of systematic trend following. This edition covers conditions through the close of US markets on Friday, 23 January 2026.
The story of the week was natural gas's historic surge. The commodity rallied approximately +70% as an extreme Arctic outbreak drove heating demand expectations sharply higher—the largest weekly gain in records dating back to 1990. This extraordinary move propelled the energy complex to sector leadership despite modest gains elsewhere in the group.
Meanwhile, the metals complex continued its powerful rally for the third consecutive week. Silver surged another 16.63%, platinum exploded 19.4%, palladium leapt 12.39%, and gold added a substantial 8.44%. The breadth of strength across precious and industrial metals remains remarkable.
Equities reversed course decisively, with all seven tracked indices posting losses. The VIX surged 9.47%, reflecting rising uncertainty. Bitcoin declined 6.61%, retreating from its recent breakout. Trend conditions remained neutral but showed early signs of momentum improvement, with the TTU Barometer's rate of change turning positive.
This was a week of historic energy moves and continued precious metals strength.
SG Trend Index Performance
Month to date: +4.76 percent
Year to date: +4.76 percent
Last week:
Month to date: +4.97 percent
Year to date: +4.97 percent
The SG Trend Index pulled back slightly from last week's +4.97% to +4.76%, a modest 21 basis point decline. Despite this small retracement, the index remains comfortably positive for January, reflecting the continued contribution from metals and energy trends. The pullback likely reflects the mixed equity performance and some profit-taking in positions that had run hard in recent weeks. Importantly, the index remains well above the flat line, indicating that systematic trend-following strategies continue to capture opportunities in the current environment.
TTU Trend Barometer
Current reading: 45 percent
Previous reading: 45 percent
10-day rate of change: Rising Weakly
The TTU Trend Barometer held steady at 45%, remaining in the middle of neutral territory. The "Overall Trend Strength" indicator remains at "Neutral," but the reading maintains comfortable distance from the 40% threshold that would indicate a weak environment.
The silver lining is the rate of change. After weeks of decline and stabilisation, the 10-day rate of change has turned to "Rising Weakly." This is an important inflection—while the absolute level remains in the lower half of neutral, the direction of travel has shifted positive. This suggests that trend breadth may be beginning to expand rather than contract.
At 45% with a rising rate of change, the barometer describes an environment that is improving from the margin. The extreme moves in natural gas and metals are contributing to trend formation, but broader participation remains elusive. A sustained push above 50% would confirm genuine trend environment improvement.
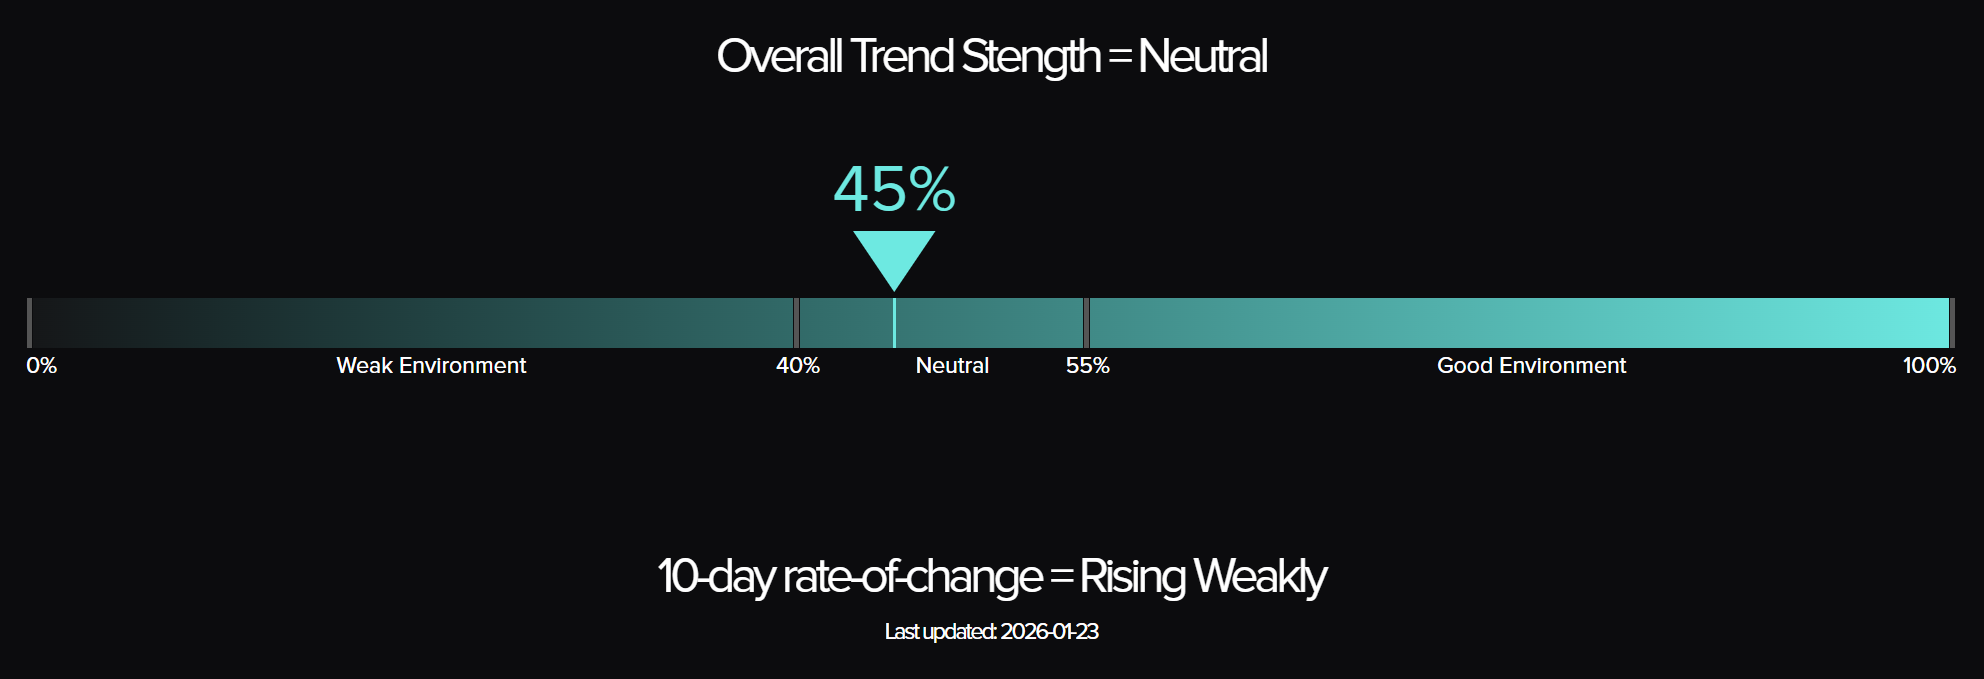
The Top Traders Unplugged (TTU) Trend Barometer is a proprietary tool that measures the percentage of markets with medium to strong trends. Similar to a thermometer, where 0 degrees Celsius equates to freezing, a TTU Trend Barometer reading below 40% indicates a “cold” environment for trend-following, while readings above 55% signal a “hotter,” more favourable trend environment.
Weekly Asset Class Snapshot
| Asset Class | % Move | Prev |
| Energy | +15.42%* | +0.29% |
| Metal | +11.74% | +3.09% |
| Volatility Index | +9.47% | +3.06% |
| Currency | +1.83% | −0.05% |
| Grains | +1.52% | +0.08% |
| Meats | +0.79% | +1.02% |
| Bonds | +0.01% | −0.23% |
| Equity Index | −0.96% | +0.21% |
| Soft Commodity | −3.22% | +0.94% |
| Crypto | −6.61% | +5.81% |
| *Energy average uses corrected Natural Gas figure (~+70%) rather than erroneous Finviz data (+272%) | ||
Source: Finviz.com
- Energy (+15.42 percent | prev +0.29 percent): Energy surged this week, driven by natural gas's historic ~70% rally—the largest weekly gain since 1990. An extreme Arctic outbreak sent temperatures plunging across most of the US, sharply lifting heating demand expectations and triggering massive short-covering. Freeze-off risks in southern producing regions added supply concerns. Elsewhere, heating oil gained 9.82%, crude oil Brent rose 3.37%, WTI added 3.27%, and gasoline RBOB climbed 3.76%. The sector transformed from a modest contributor to sector leadership.
- Metal (+11.74 percent | prev +3.09 percent): Metals extended their dominance for the third consecutive week. Silver surged another 16.63%, continuing its blistering rally. Platinum exploded 19.4%, palladium leapt 12.39%, and gold added a substantial 8.44%. Even copper, the laggard, gained 1.82%. The entire complex is in powerful uptrends with broad participation.
- Volatility Index (+9.47 percent | prev +3.06 percent): The VIX surged nearly 10%, its largest weekly gain in months. This spike reflects the broad equity selloff and increasing uncertainty in risk markets. Elevated implied volatility signals defensive positioning and hedging demand.
- Currency (+1.83 percent | prev −0.05 percent): Currencies strengthened broadly against the US dollar, which fell 1.96%. The NZD led with a 3.43% gain, followed by the AUD (+3.17%), CHF (+2.94%), and EUR (+2.01%). Dollar weakness was the dominant theme as risk sentiment shifted.
- Grains (+1.52 percent | prev +0.08 percent): Grains posted solid gains with broad participation. Soybean meal rebounded sharply with a 3.48% gain after last week's collapse. Wheat added 2.36%, soybean oil rose 2.51%, and corn gained 1.41%. The sector reversed last week's divergence with more unified performance.
- Meats (+0.79 percent | prev +1.02 percent): Meats continued their modest positive streak. Live cattle led with a 1.29% gain, feeder cattle added 1.0%, while lean hogs were essentially flat at 0.08%. The sector remains range-bound with limited trending behaviour.
- Bonds (+0.01 percent | prev −0.23 percent): Bonds stabilised near unchanged after last week's decline. The 30-year bond gained 0.05%, the 5-year note rose 0.01%, the 10-year was flat, and the 2-year note slipped 0.03%. Yields have paused their recent rise, offering a respite for duration exposure.
- Equity Index (−0.96 percent | prev +0.21 percent): Equities reversed last week's mixed gains with uniform losses. The Russell 2000 fell 0.73%, S&P 500 dropped 0.62%, DJIA declined 0.74%, and Nasdaq 100 edged down 0.03%. European indices underperformed: Euro Stoxx 50 fell 1.23%, DAX dropped 1.65%, and Nikkei 225 lost 1.71%. The risk-off tone was global.
- Soft Commodity (−3.22 percent | prev +0.94 percent): Softs reversed sharply lower, led by cocoa's devastating 17.04% collapse—the week's worst performer. Lumber continued its decline with a 2.71% loss, sugar fell 1.54%, and cotton dropped 1.27%. Orange juice (+4.34%) was the sole bright spot, while coffee declined 1.08%.
- Crypto (−6.61 percent | prev +5.81 percent): Bitcoin gave back all of last week's gains and then some, falling 6.61%. The decline erased the breakout move and suggests the consolidation pattern may not yet be complete. The digital asset space faced headwinds alongside the broader risk-off environment.
Performance Highlights – This Week’s Market Leaders & Laggards
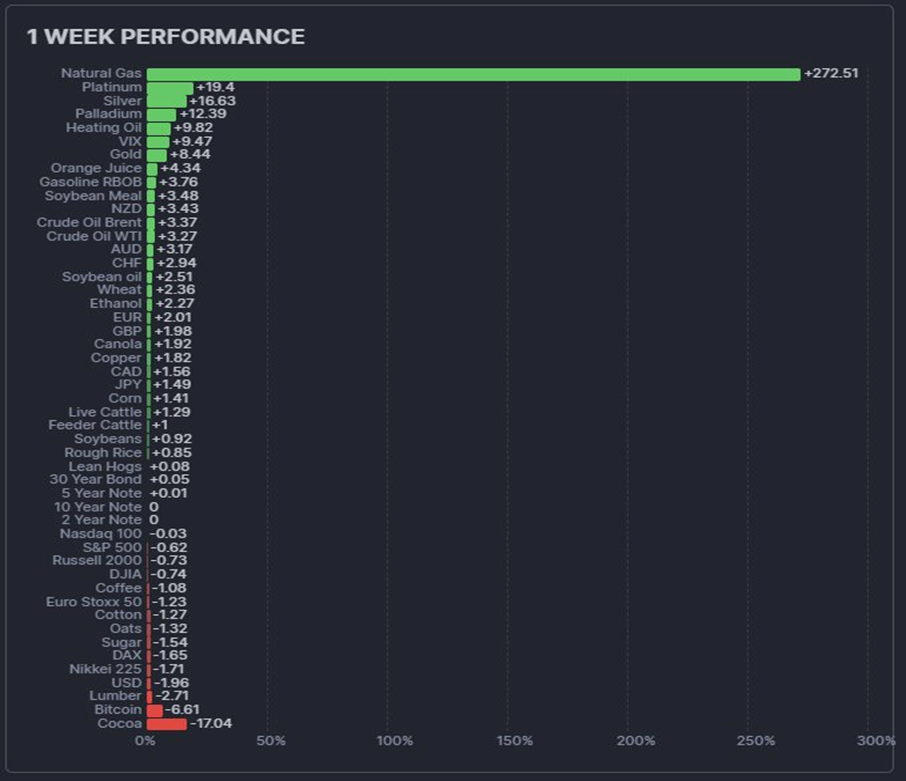
Note: The Finviz chart displays an erroneous +272% for Natural Gas. The actual weekly gain was approximately +70%, which remains the largest weekly increase since 1990. The analysis below uses the corrected figure.
Source: Finviz.com
Top Market Movers
Top Gainers
1. Natural Gas ~+70 percent
Natural gas posted its largest weekly gain since 1990, surging approximately 70% as an extreme Arctic outbreak drove heating demand expectations sharply higher. Forecasts for sustained below-normal temperatures through early February, combined with freeze-off risks in southern producing regions, triggered massive short-covering. Prices approached $5.50/MMBtu, levels not seen since December 2022.
2. Platinum +19.4 percent
Platinum exploded higher, joining the precious metals rally with conviction. The industrial metal's surge reflects both safe-haven flows and improving demand expectations. The move establishes platinum as a key participant in the 2026 metals theme.
3. Silver +16.63 percent
Silver extended its remarkable run for a third consecutive week, posting another double-digit gain. The metal has now gained approximately 50% in the first three weeks of January, validating the powerful uptrend. Chart structure remains impeccable with higher highs and higher lows.
4. Palladium +12.39 percent
Palladium reversed last week's decline with authority, surging over 12%. The move suggests the recent pullback was a buying opportunity within an emerging uptrend. All five tracked metals posted gains this week, a rare show of unanimous strength.
Top Losers
1. Cocoa −17.04 percent
Cocoa's collapse accelerated dramatically, plunging over 17% in a single week. The contract continues its brutal descent from the 2024 highs, now trading near $4,200 after peaking above $12,000. The downtrend shows no signs of exhaustion.
2. Bitcoin −6.61 percent
Bitcoin retreated sharply, erasing last week's breakout gains. The decline returns prices to the lower end of the recent range near $89,000. The failed breakout suggests more consolidation may be needed before the next leg higher.
3. Lumber −2.71 percent
Lumber continued its decline after last week's sharp reversal, giving back more of its recent gains. The sector remains in a challenging bottoming process with unclear trend direction.
4. USD −1.96 percent
The US dollar was the weakest currency, falling nearly 2% against the basket. Dollar weakness supported gains across most other currencies and commodities priced in dollars. The move reflects shifting rate expectations and risk sentiment.
Portfolio View - Positioning and Impact
Energy
Energy positioning delivered exceptional returns this week, driven primarily by natural gas. The historic ~70% move rewarded long exposure handsomely, though position sizing typically limits the absolute contribution of any single commodity. Heating oil and crude oil longs added further contribution. The sector transformed from a modest contributor to the week's dominant driver alongside metals.
Metals
Metals remained the consistent performer for the third consecutive week. Long exposure across gold, silver, platinum, and palladium all contributed positively. The unanimous strength across the complex—with even copper posting gains—rewarded broad sector allocation. Silver's continued surge validated maintaining full trend-following exposure despite extended price levels.
Equities
Equity positioning faced headwinds as all tracked indices declined. Long exposure to Russell 2000 and S&P 500 generated modest losses, while European indices underperformed further. The rise in VIX suggests volatility strategies may have offered some offset. The broad-based weakness underscores the importance of diversification beyond equity beta.
Grains
Grains positioning contributed positively this week, reversing last week's challenges. Soybean meal's sharp rebound rewarded holders who maintained positions through the prior week's weakness. Wheat, corn, and soybean oil all added to gains. The sector's more unified behaviour simplified position management.
Soft Commodities
Soft commodity positioning faced significant challenges, with cocoa's collapse the primary detractor for long positions. Short exposure to cocoa, where held, delivered exceptional returns. Orange juice longs provided partial offset. The extreme divergence within the sector continues to demand careful position-level management.
Rates and FX
Rates exposure was essentially flat, with bonds stabilising near unchanged. Currency positions benefited from dollar weakness, with long exposure to NZD, AUD, and EUR all contributing. The clearer directional move in FX offered better opportunities than recent weeks' rangebound trading.
Crypto
Bitcoin's decline detracted from portfolio performance, giving back last week's gains. The failed breakout suggests the position may require patience as the consolidation pattern extends. Allocation to the digital asset space remains warranted given the broader trend structure, but short-term volatility persists.
Final Reflections – Natural Gas Posts Historic Surge as Metals Extend Rally
The fourth week of January delivered a historic energy move and continued validation of the precious metals theme.
Three observations define the week:
- Natural gas posted its largest weekly gain since 1990. A ~70% weekly move driven by Arctic weather and supply concerns is extraordinary by any measure. Forecasts for sustained below-normal temperatures through early February, combined with freeze-off risks in southern producing regions, triggered massive short-covering. This demonstrates that trend-following continues to capture extreme outliers when they occur.
- Metals remain the story of 2026. Silver's third consecutive week of double-digit gains (+16.63%) extends an already remarkable run. Platinum and palladium joined the party with massive moves. Gold added 8.44%. The entire complex is trending powerfully, rewarding systematic exposure.
- Equities reversed as defensive signals emerge. All seven equity indices posted losses, with the VIX surging 9.47%. This broad-based weakness, combined with rising volatility, suggests risk-off sentiment is building. The strength in gold and silver alongside equity weakness is a classic defensive rotation.
The TTU Barometer held steady at 45%, with the rate of change turning positive for the first time in weeks. This suggests that while trend breadth remains moderate, conditions may be improving at the margin.
Natural gas surges. Metals extend. The trend environment stabilises with improving momentum.

List of Resources used in the Week in Review
Important Disclaimers
This document is directly solely to Accredited Investors, Qualified Eligible Participants, Qualified Clients and Qualified Purchasers. No investment decision should be made until prospective investors have read the detailed information in the fund offering documents of any manager mentioned in this document. This document is furnished on a confidential basis only for the use of the recipient and only for discussion purposes and is subject to amendment This document is neither advice nor a recommendation to enter into any transaction. This document is not an offer to buy or sell, nor a solicitation of an offer to buy or sell, any security or other financial instrument. This presentation is based on information obtained from sources that TopTradersUnplugged (“TTU”) (“considers to be reliable however, TTU makes no representation as to, and accepts no responsibility or liability for, the accuracy or completeness of the information. TTU has not independently verified third party manager or benchmark information, does not represent it as accurate, true or complete, makes no warranty, express or implied regarding it and shall not be liable for any losses, damages, costs or expenses relating to its adequacy, accuracy, truth, completeness or use.
All projections, valuations, and statistical analyses are provided to assist the recipient in the evaluation of the matters described herein. Such projections, valuations and analyses may be based on subjective assessments and assumptions and may use one among many alternative methodologies that produce different results accordingly, such projections, valuations and statistical analyses should not be viewed as facts and should not be relied upon as an accurate prediction of future events. There is no guarantee that any targeted performance will be achieved Commodity trading involves substantial risk of loss and may not be suitable for everyone
TTU is not and does not purport to be an advisor as to legal, taxation, accounting, financial or regulatory matters in any jurisdiction. The recipient should independently evaluate and judge the matters referred to herein. TTU does not provide advice or recommendations regarding an investor’s decision to allocate to funds or accounts managed by any manager (“or to maintain or sell investments in funds or accounts managed by any manager, and no fiduciary relationship under ERISA is created by the investor investing in funds or accounts managed by any manager, or through any communication between TTU and the investor
In reviewing this document, it should be understood that the past performance results of any asset class, or any investment or trading program set forth herein, are not necessarily indicative of any future results that may be achieved in connection with any transaction. Any persons subscribing for an investment must be able to bear the risks involved and must meet the suitability requirements relating to such investment. Some or all alternative investment programs discussed herein may not be suitable for certain investors This document is directed only to persons having professional experience in matters relating to investments. Any investment or investment activity to which this document relates is available only to such investment professionals. Persons who do not have professional experience in matters relating to investments should not rely upon this document.
This document and its contents are proprietary information of TTU and may not be reproduced or otherwise disseminated in whole or in part without TTU’s prior written consent.
This document contains simulated or hypothetical performance results that have certain inherent limitations AND SHOULD BE VIEWED FOR ILLUSTRATIVE PURPOSES. Unlike the results shown in an actual performance record, these results do not represent actual trading. HYPOTHETICAL PERFORMANCE RESULTS HAVE MANY INHERENT LIMITATIONS, SOME OF WHICH ARE DESCRIBED BELOW. NO REPRESENTATION IS BEING MADE THAT ANY ACCOUNT WILL OR IS LIKELY TO ACHIEVE PROFITS OR LOSSES SIMILAR TO THOSE SHOWN IN FACT, THERE ARE FREQUENTLY SHARP DIFFERENCES BETWEEN HYPOTHETICAL PERFORMANCE RESULTS AND THE ACTUAL RESULTS SUBSEQUENTLY ACHIEVED BY ANY PARTICULAR INVESTMENT ACCOUNT.
ONE OF THE LIMITATIONS OF HYPOTHETICAL PERFORMANCE RESULTS IS THAT THEY ARE GENERALLY PREPARED WITH THE BENEFIT OF HINDSIGHT IN ADDITION, HYPOTHETICAL TRADING DOES NOT INVOLVE FINANCIAL RISK, AND NO HYPOTHETICAL TRADING RECORD CAN COMPLETELY ACCOUNT FOR THE IMPACT OF FINANCIAL RISK IN ACTUAL TRADING FOR EXAMPLE, THE ABILITY TO WITHSTAND LOSSES OR TO ADHERE TO A PARTICULAR TRADING PROGRAM OR OTHER ASSET.
There are numerous other factors related to the markets in general or to the implementation of any specific trading program which cannot be fully accounted for in the preparation of hypothetical performance results and all of which can adversely affect actual trading results. No representation is being made that any investment will or is likely to achieve profits or losses similar to those being shown.
Most Comprehensive Guide to the Best Investment Books of All Time

Most Comprehensive Guide to the Best Investment Books of All Time
Get the most comprehensive guide to over 600 of the BEST investment books, with insights, and learn from some of the wisest and most accomplished investors in the world. A collection of MUST READ books carefully selected for you. Get it now absolutely FREE!
Get Your FREE Guide HERE!