


Trend Following - Week in Review - January 30, 2026

"Precious Metals Collapse as Energy Extends Historic Rally"
This Week in Trend – 30 January 2026
Welcome to This Week in Trend, your weekly view into the evolving structure of global futures markets and the behaviour of systematic trend following. This edition covers conditions through the close of US markets on Friday, 30 January 2026.
The story of the week was a dramatic reversal in precious metals at month-end. After three consecutive weeks of powerful gains, the complex collapsed with platinum plunging 22.61%, silver crashing 22.5%, and palladium tumbling 16%. Gold fell 5.41%. The sector swung from the best performer last week (+11.74%) to the worst this week (−13.38%); a stunning 25 percentage point reversal.
Meanwhile, energy maintained its momentum from last week's historic natural gas surge. Natural gas added another 20.64%, heating oil jumped 15.51%, and the crude complex posted solid gains. The sector remains the dominant trend theme of 2026.
The trend environment improved markedly. The TTU Barometer surged from 45% to 68%, crossing into "Very Strong" territory with the 10-day rate of change "Rising Rapidly.” The SG Trend Index extended gains to +7.04% month-to-date, up 228 basis points from last week's +4.76%.
This was a week of violent sector rotation and strengthening trend conditions.
SG Trend Index Performance
Month to date: +7.04 percent
Year to date: +7.04 percent
Last week:
Month to date: +4.76 percent
Year to date: +4.76 percent
The SG Trend Index jumped 228 basis points from last week's +4.76% to +7.04%, marking the strongest month-to-date reading of 2026 thus far. This substantial improvement reflects the continued contribution from energy trends, particularly natural gas's extended rally and the broader petroleum complex strength.
The metals collapse may have created some turbulence for portfolios with heavy precious metals exposure, but the diversity of trend opportunities across energy, currencies, and select grains appears to have more than offset these reversals. The index's resilience through this violent sector rotation demonstrates the value of systematic diversification.
TTU Trend Barometer
Current reading: 68 percent
Previous reading: 45 percent
10-day rate of change: Rising Rapidly
The TTU Trend Barometer surged 23 percentage points from 45% to 68%, catapulting into 'Very Strong' territory. This is a significant development. The barometer has moved from the middle of neutral to a genuinely favourable trend environment in a single week.
The 10-day rate of change improved from 'Rising Weakly' to 'Rising Rapidly,' confirming that trend breadth is expanding rather than concentrated in a few outliers. This is particularly notable given the metals collapse. The improvement suggests new trends are forming faster than old ones are breaking down.
At 68% with rapid positive momentum, the barometer now describes an environment where systematic trend-following has room to operate. The energy complex's extended rally, combined with emerging currency trends and stabilising bond markets, has broadened the opportunity set meaningfully.
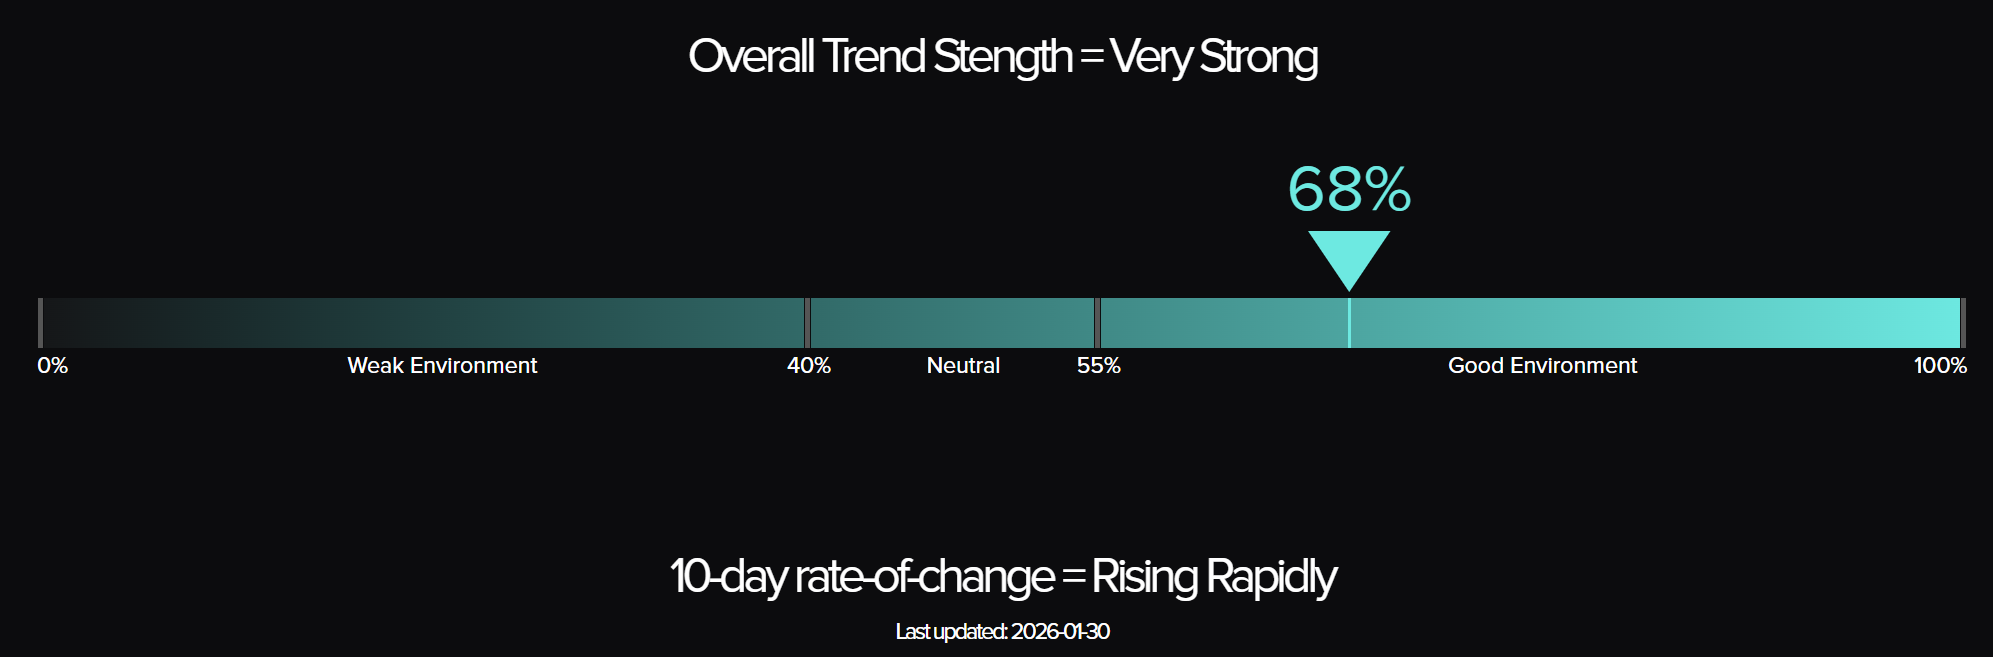
The Top Traders Unplugged (TTU) Trend Barometer is a proprietary tool that measures the percentage of markets with medium to strong trends. Similar to a thermometer, where 0 degrees Celsius equates to freezing, a TTU Trend Barometer reading below 40% indicates a “cold” environment for trend-following, while readings above 55% signal a “hotter,” more favourable trend environment.
Weekly Asset Class Snapshot
| Asset Class | % Move | Prev |
| Energy | +9.01% | +15.42% |
| Volatility Index | +3.81% | +9.47% |
| Currency | +0.76% | +1.83% |
| Grains | +0.49% | +1.52% |
| Bonds | +0.08% | +0.01% |
| Meats | −0.36% | +0.79% |
| Equity Index | −0.41% | −0.96% |
| Soft Commodity | −2.37% | −3.22% |
| Crypto | −6.39% | −6.61% |
| Metal | −13.38% | +11.74% |
Source: Finviz.com
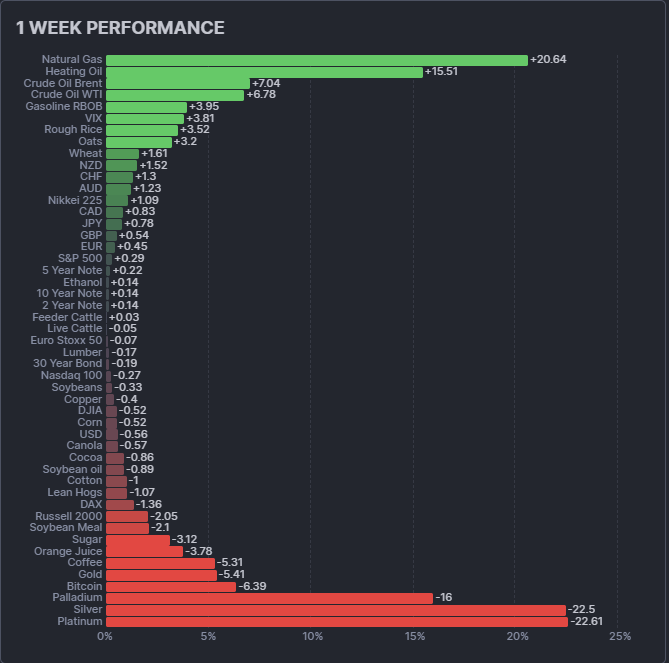
Energy (+9.01 percent | prev +15.42 percent) Energy maintained leadership for the second consecutive week as the winter demand story continued. Natural gas extended last week's historic surge with another 20.64% gain, pushing prices further into multi-year highs as forecasts for sustained cold weather supported demand expectations. Heating oil jumped 15.51%, crude oil Brent added 7.04%, and WTI rose 6.78%. Gasoline RBOB gained 3.95% while ethanol added a modest 0.14%. The sector remains in powerful uptrends with the natural gas move now among the most significant multi-week rallies in the contract's history.
Volatility Index (+3.81 percent | prev +9.47 percent) The VIX rose for the second straight week, though at a more moderate pace than last week's 9.47% surge. Implied volatility remains elevated, reflecting ongoing uncertainty in equity markets. The persistent bid for volatility suggests hedging demand remains robust amid the mixed equity performance and violent commodity rotations.
Currency (+0.76 percent | prev +1.83 percent) Currencies posted modest gains against the US dollar for the second consecutive week. The NZD led with a 1.52% gain, followed by CHF (+1.3%), AUD (+1.23%), and CAD (+0.83%). The JPY added 0.78% while GBP and EUR posted smaller gains. The USD fell 0.56%, extending its recent weakness. The trend toward dollar weakness continues, though at a slower pace than last week.
Grains (+0.49 percent | prev +1.52 percent) Grains posted a modest positive week with bifurcated performance. Rough rice led with a 3.52% gain, followed by oats (+3.2%) and wheat (+1.61%). However, the soybean complex struggled: soybeans fell 0.33%, soybean oil dropped 0.89%, soybean meal collapsed 2.1%, and canola declined 0.57%. Corn edged down 0.52%. The sector's performance was driven by the small grains while row crops faced pressure.
Bonds (+0.08 percent | prev +0.01 percent) Bonds were essentially unchanged for the second consecutive week, with the short end marginally positive. The 5-year note led with a 0.22% gain, while the 10-year and 2-year notes each added 0.14%. The 30-year bond was the lone decliner, falling 0.19%. The yield curve continues to stabilise after recent volatility, offering a neutral backdrop for duration exposure.
Meats (−0.36 percent | prev +0.79 percent) Meats slipped into negative territory after two positive weeks. Lean hogs fell 1.07%, feeder cattle were essentially flat at +0.03%, and live cattle edged down 0.05%. The sector remains range-bound with limited directional conviction. Charts show continued consolidation patterns across all three contracts.
Equity Index (−0.41 percent | prev −0.96 percent) Equities were mixed with modest losses overall, improving from last week's broader decline. The Nikkei 225 was the lone gainer, rising 1.09%. The S&P 500 edged up 0.29% while Euro Stoxx 50 was essentially flat at −0.07%. However, the Russell 2000 fell 2.05%, DAX dropped 1.36%, Nasdaq 100 declined 0.27%, and DJIA lost 0.52%. The divergence between large-cap (relatively stable) and small-cap (weak) remains notable.
Soft Commodity (−2.37 percent | prev −3.22 percent) Softs declined for the second straight week, though at a slower pace. Coffee led the decline with a 5.31% drop, followed by orange juice (−3.78%), sugar (−3.12%), and cotton (−1.0%). Cocoa fell 0.86%, a relief after last week's 17% collapse. Lumber edged down 0.17%. The sector remains in a challenging environment with few discernible uptrends.
Crypto (−6.39 percent | prev −6.61 percent) Bitcoin declined for the second consecutive week, falling 6.39% to extend its pullback from the December highs. The weekly chart shows prices consolidating below the $100,000 level after failing to hold the breakout. The digital asset continues to face headwinds alongside broader risk-off sentiment in equities.
Metal (−13.38 percent | prev +11.74 percent) Metals collapsed in a dramatic reversal, swinging from the best-performing sector last week to the worst this week, a 25 percentage point swing. Platinum plunged 22.61%, silver crashed 22.5%, and palladium tumbled 16%. Gold fell 5.41% while copper edged down 0.4%. The violent reversal suggests the extended rally may have exhausted near-term buying interest. After three weeks of extraordinary gains, profit-taking and position liquidation dominated.
Performance Highlights – This Week’s Market Leaders & Laggards
Source: Finviz.com
Top Market Movers
Top Gainers
- Natural Gas (+20.64 percent): Natural gas extended its historic rally with another massive weekly gain. The commodity continues to benefit from sustained cold weather forecasts and elevated heating demand. Prices have now surged approximately 100% over two weeks, one of the most significant moves in the contract's history. The weekly chart shows a powerful breakout from the base that had formed through late 2024 and early 2025.
- Heating Oil (+15.51 percent): Heating oil surged as the winter weather theme spread across the petroleum complex. The contract's close correlation with natural gas during heating season drove outsized gains. The weekly chart shows prices breaking to new highs, confirming the uptrend's strength.
- Crude Oil Brent (+7.04 percent): Brent crude posted solid gains as the energy complex rallied broadly. Supply concerns related to winter demand and geopolitical factors supported prices. The weekly chart shows a constructive pattern with prices holding above key support levels.
- Crude Oil WTI (+6.78 percent): WTI followed Brent higher, benefiting from the same seasonal and supply dynamics. The spread between WTI and Brent remains tight, reflecting integrated global oil markets. Both contracts are establishing new uptrends after the 2024 consolidation.
Top Losers
- Platinum (−22.61 percent): Platinum led the metals collapse with a devastating weekly decline. After surging 19.4% last week, the contract gave back all those gains and more. The violence of the reversal suggests exhaustion of the recent rally rather than a fundamental shift. The weekly chart shows a sharp bearish engulfing pattern following the recent vertical ascent.
- Silver (−22.5 percent): Silver's remarkable run came to an abrupt halt with a crash nearly matching platinum's decline. After three weeks of extraordinary gains totalling approximately 70%, the metal experienced violent profit-taking. The weekly chart shows a sharp reversal from overbought conditions, though the longer-term uptrend structure remains intact.
- Palladium (−16 percent): Palladium tumbled alongside the broader precious metals complex. The industrial metal's decline reflects both the general metals liquidation and specific concerns about automotive demand. The weekly chart shows a sharp reversal after the recent rally attempt.
- Bitcoin (−6.39 percent): Bitcoin extended its decline for the second straight week, falling further below the $100,000 level. The digital asset's weakness amid the broader risk-off environment suggests continued correlation with speculative assets. The weekly chart shows a developing correction from the December highs.
Portfolio View - Positioning and Impact
Energy positioning delivered exceptional returns for the second consecutive week. Natural gas long exposure generated outsized gains as the rally extended. Heating oil longs added meaningful contribution, while crude oil positions benefited from the broader complex strength. The sector has transformed into the dominant portfolio driver, potentially offsetting losses elsewhere.
Metals positioning faced severe challenges this week. Long exposure across gold, silver, platinum, and palladium all generated significant losses. The speed of the reversal likely triggered stop-losses and position reductions across systematic strategies. The violent nature of the move, from three weeks of gains to sudden collapse, illustrates the importance of position sizing and risk management even in trending markets.
Equity positioning was mixed with modest overall impact. Long exposure to Nikkei 225 and S&P 500 generated small gains, while Russell 2000 and DAX longs detracted. The VIX's continued rise suggests volatility strategies may have provided some offset. The divergent performance across indices complicated sector-level positioning.
Grains positioning produced modest positive contribution. Long exposure to wheat, oats, and rough rice generated gains, while soybean complex positions faced headwinds. The bifurcated performance within the sector created challenges for broad allocation strategies.
Soft commodity positioning continued to face headwinds, with coffee longs the primary detractor. The sector's persistent weakness has reduced systematic exposure over recent weeks. Short positioning in cocoa, where held, would have benefited as the decline continued, though at a slower pace than last week.
Rates and FX exposure was essentially flat with bonds unchanged. Currency positions benefited from continued dollar weakness, with long exposure to NZD, AUD, and CHF all contributing modestly. The emerging trends in foreign exchange offered diversification benefit during the volatile commodity week.
Bitcoin exposure continued to detract from portfolio performance. The second consecutive week of losses extended the correction from December highs. Position sizing in the digital asset space likely remains conservative given the elevated volatility regime.
Final Reflections – Precious Metals Collapse as Energy Extends Historic Rally
The fifth week of January delivered violent sector rotation and, paradoxically, improved trend conditions.
Three observations define the week:
- Precious metals experienced their worst week in years. The 25 percentage point swing from +11.74% to −13.38% illustrates how quickly momentum can reverse. Platinum (−22.61%), silver (−22.5%), and palladium (−16%) all suffered devastating losses. After three weeks of extraordinary gains, profit-taking overwhelmed the rally. This serves as a reminder that even powerful trends experience violent corrections.
- Energy remains the dominant theme. Natural gas's +20.64% gain extends last week's historic surge, with heating oil (+15.51%) and crude following. The two-week natural gas rally of approximately 100% is among the most significant moves in the contract's history. Energy has emerged as the clear trend opportunity of early 2026.
- The trend environment improved despite the metals collapse. The TTU Barometer's surge from 45% to 68% is remarkable given the sector rotation. This suggests that new trends are forming faster than old ones are breaking down. The breadth of trending markets is expanding, not contracting, a genuinely favourable development for systematic strategies.
The SG Trend Index's jump to +7.04% MTD demonstrates that diversified trend-following portfolios navigated this volatile week successfully. While metals positions faced significant drawdowns, the energy rally and emerging currency trends provided an offset.
Metals collapse. Energy extends. The trend environment strengthens.

List of Resources used in the Week in Review
Important Disclaimers
This document is directly solely to Accredited Investors, Qualified Eligible Participants, Qualified Clients and Qualified Purchasers. No investment decision should be made until prospective investors have read the detailed information in the fund offering documents of any manager mentioned in this document. This document is furnished on a confidential basis only for the use of the recipient and only for discussion purposes and is subject to amendment This document is neither advice nor a recommendation to enter into any transaction. This document is not an offer to buy or sell, nor a solicitation of an offer to buy or sell, any security or other financial instrument. This presentation is based on information obtained from sources that TopTradersUnplugged (“TTU”) (“considers to be reliable however, TTU makes no representation as to, and accepts no responsibility or liability for, the accuracy or completeness of the information. TTU has not independently verified third party manager or benchmark information, does not represent it as accurate, true or complete, makes no warranty, express or implied regarding it and shall not be liable for any losses, damages, costs or expenses relating to its adequacy, accuracy, truth, completeness or use.
All projections, valuations, and statistical analyses are provided to assist the recipient in the evaluation of the matters described herein. Such projections, valuations and analyses may be based on subjective assessments and assumptions and may use one among many alternative methodologies that produce different results accordingly, such projections, valuations and statistical analyses should not be viewed as facts and should not be relied upon as an accurate prediction of future events. There is no guarantee that any targeted performance will be achieved Commodity trading involves substantial risk of loss and may not be suitable for everyone
TTU is not and does not purport to be an advisor as to legal, taxation, accounting, financial or regulatory matters in any jurisdiction. The recipient should independently evaluate and judge the matters referred to herein. TTU does not provide advice or recommendations regarding an investor’s decision to allocate to funds or accounts managed by any manager (“or to maintain or sell investments in funds or accounts managed by any manager, and no fiduciary relationship under ERISA is created by the investor investing in funds or accounts managed by any manager, or through any communication between TTU and the investor
In reviewing this document, it should be understood that the past performance results of any asset class, or any investment or trading program set forth herein, are not necessarily indicative of any future results that may be achieved in connection with any transaction. Any persons subscribing for an investment must be able to bear the risks involved and must meet the suitability requirements relating to such investment. Some or all alternative investment programs discussed herein may not be suitable for certain investors This document is directed only to persons having professional experience in matters relating to investments. Any investment or investment activity to which this document relates is available only to such investment professionals. Persons who do not have professional experience in matters relating to investments should not rely upon this document.
This document and its contents are proprietary information of TTU and may not be reproduced or otherwise disseminated in whole or in part without TTU’s prior written consent.
This document contains simulated or hypothetical performance results that have certain inherent limitations AND SHOULD BE VIEWED FOR ILLUSTRATIVE PURPOSES. Unlike the results shown in an actual performance record, these results do not represent actual trading. HYPOTHETICAL PERFORMANCE RESULTS HAVE MANY INHERENT LIMITATIONS, SOME OF WHICH ARE DESCRIBED BELOW. NO REPRESENTATION IS BEING MADE THAT ANY ACCOUNT WILL OR IS LIKELY TO ACHIEVE PROFITS OR LOSSES SIMILAR TO THOSE SHOWN IN FACT, THERE ARE FREQUENTLY SHARP DIFFERENCES BETWEEN HYPOTHETICAL PERFORMANCE RESULTS AND THE ACTUAL RESULTS SUBSEQUENTLY ACHIEVED BY ANY PARTICULAR INVESTMENT ACCOUNT.
ONE OF THE LIMITATIONS OF HYPOTHETICAL PERFORMANCE RESULTS IS THAT THEY ARE GENERALLY PREPARED WITH THE BENEFIT OF HINDSIGHT IN ADDITION, HYPOTHETICAL TRADING DOES NOT INVOLVE FINANCIAL RISK, AND NO HYPOTHETICAL TRADING RECORD CAN COMPLETELY ACCOUNT FOR THE IMPACT OF FINANCIAL RISK IN ACTUAL TRADING FOR EXAMPLE, THE ABILITY TO WITHSTAND LOSSES OR TO ADHERE TO A PARTICULAR TRADING PROGRAM OR OTHER ASSET.
There are numerous other factors related to the markets in general or to the implementation of any specific trading program which cannot be fully accounted for in the preparation of hypothetical performance results and all of which can adversely affect actual trading results. No representation is being made that any investment will or is likely to achieve profits or losses similar to those being shown.
Most Comprehensive Guide to the Best Investment Books of All Time

Most Comprehensive Guide to the Best Investment Books of All Time
Get the most comprehensive guide to over 600 of the BEST investment books, with insights, and learn from some of the wisest and most accomplished investors in the world. A collection of MUST READ books carefully selected for you. Get it now absolutely FREE!
Get Your FREE Guide HERE!