





Trend Following: Week in Review - July 17, 2026

"Energy Takes the Lead as the Petroleum Complex Surges, Cocoa and Coffee Reverse While Equity Indices and Metals Fall, the Barometer Rises to 50% and Strong, and the SG Trend Index Eases"
This Week in Trend – 17 July 2026
Welcome to This Week in Trend, your weekly view into the evolving structure of global futures markets and the behaviour of systematic trend following. This edition covers conditions through the close of US markets on Friday, 17 July 2026.
Leadership rotated sharply again this week. Energy seized control of the board while many of the previous week’s strongest commodity trends reversed, and the result was an unusual pairing: trend strength improved even as many trend followers gave back ground. Energy topped the board at +9.55%, the petroleum complex advancing almost as one, all four contracts between 13.67% and 15.91%, while Natural Gas eased 0.99% and Ethanol 1.30%. The VIX jumped 10.91%, turning up after two weeks of decline. Against that surge the prior week’s leaders rolled over: Soft Commodities fell to the bottom at -3.39% as Cocoa dropped 8.77% and Coffee 4.17%, both reversing large gains, and Grains cooled to +1.92% as the broad advance narrowed. The Equity Indices eased to -2.16% with all seven contracts lower, the Nikkei 225 off 5.94% and the Nasdaq 100 4.19%, and Metals fell 2.36% as the precious side surrendered more ground, Silver down 6.38%. The Meats eased 1.45% as the cattle contracts fell again, while the financial sectors that had lagged turned up: Bonds rose 0.16% across the curve, Currencies gained 0.33% as the commodity dollars tracked the energy move, and Bitcoin added 2.77%. Contract-level breadth turned negative at 23 of 49 contracts higher, with 26 lower and none unchanged, against 31 higher, 18 lower and none unchanged the week before.
Inside the complex the leadership changed hands again, the energy sector carrying the board while the commodity leaders of the prior week reversed. Energy strengthened across the petroleum complex as crude and the refined products ran together, Crude Oil Brent, Crude Oil WTI, Heating Oil and Gasoline RBOB all between 13.67% and 15.91%, while Natural Gas and Ethanol eased as the two decliners. Soft Commodities fell from the top to the bottom of the board, Cocoa reversing its 20.43% surge to an 8.77% drop and Coffee its 10.97% gain to a 4.17% decline, while Orange Juice continued lower at a shallower 3.02%. Grains held a narrower advance, Wheat up 6.64% and Soybean Oil 6.17% while Oats reversed to a 3.93% fall and Soybean Meal eased. The Equity Indices dropped across all seven contracts, the Nikkei 225 and the Nasdaq 100 the heaviest, an exact reversal of the US strength of a week earlier, and Metals fell as Silver led the precious give-back lower. The dollar eased modestly, the USD index off 0.17% as the commodity dollars rose with the energy move, NZD and CAD leading, Bonds steadied across the curve with the long end strongest, and the Meats fell as both cattle contracts dropped again while Lean Hogs rose.
Trend Indicators: Barometer Rises to 50% and Strong, SG Trend Index Eases

TTU Trend Barometer: 50%, up from 39% last week, with the overall trend strength classification moving from Moderately Weak to Strong as the reading recovered above the 40% floor and climbed back up into the upper part of the Neutral band, stopping just short of the 55% boundary into a favourable environment. The 10-day rate of change reads Neutral, up from last week’s Falling Rapidly, the near-term pace no longer falling. The five-week sequence now reads 45, 55, 64, 39, 50: the reading rose 11 points this week, recovering close to half of the prior week’s 25-point fall and lifting from below the Neutral floor back toward the favourable threshold.
The 11-point rise came as a cluster of large, coherent moves lifted the count of markets trending decisively, even as this week’s breadth turned negative. The energy complex ran as a block, the four petroleum contracts finishing between 13.67% and 15.91%, while the declines elsewhere sharpened rather than scattered: the Equity Indices fell across all seven contracts, Silver and the precious metals extended lower together, and Cocoa and Coffee reversed hard. Strength counts in either direction, so a board where 26 of 49 contracts finished lower can still show rising trend strength when the moves that dominate are large and one-way within their sectors.
The barometer measures the share of markets generating medium-to-strong trends, not the direction those trends take, so its rise this week sits alongside a breadth reading that turned down. The weekly level recovered 11 points to 50% and back up into the upper Neutral band, while the 10-day rate of change turned to Neutral from last week’s Falling Rapidly: the near-term pace has stopped falling as the weekly snapshot climbed, the two measures now pointing the same way rather than pulling apart.
The count of markets trending decisively rose as the energy complex mounted a strong, uniform run and the declines in the Equity Indices, Metals and Soft Commodities firmed into one-way moves, while the prior week’s leaders in the grains and the softs gave back part of their advances. At 50% the level has climbed from below the 40% floor back up into the upper part of the Neutral band, close to the 55% favourable threshold, and the Neutral rate of change shows the near-term pace has steadied to match rather than lagging behind.

SG Trend Index: -0.95% month to date for July and +8.09% year to date as of 17 July. That compares with -0.46% MTD and +8.62% YTD at the prior week’s close: the year-to-date figure gave back roughly 0.53 of a percentage point over the week, and July deepened its loss from -0.46% to -0.95% inside the month. The give-back sat with the trends that reversed rather than the ones that held. Cocoa swung from a 20.43% surge to an 8.77% fall, Coffee from a 10.97% gain to a 4.17% decline, the grains handed back part of last week’s broad advance and Silver extended its slide to 6.38%, a set of turns that cost books positioned along the prior week’s commodity leadership. The energy complex ran the other way and paid where it was held, Heating Oil extending from 11.66% to 14.39% and crude accelerating up off the turn it had made, though the sharpest gains in Brent, WTI and Gasoline RBOB built only as this week opened and had to be caught rather than carried. This week the index eased while the barometer rose to 50% and Strong, the two pulling apart again with the signs flipped from a week earlier: previously falling trend strength sat alongside a firmer index; this week rising trend strength sits alongside a softer one. The divergence to note is that the reversals which cost fell on the trends that had paid the week before, while the rise in the barometer reflects how large and coherent the new moves were, the energy surge above all.
Weekly Asset Class Snapshot

Sector averages are simple equal-weighted means of the constituent contracts in each sector.
Equity Indices (-2.16% | prev -0.32%)
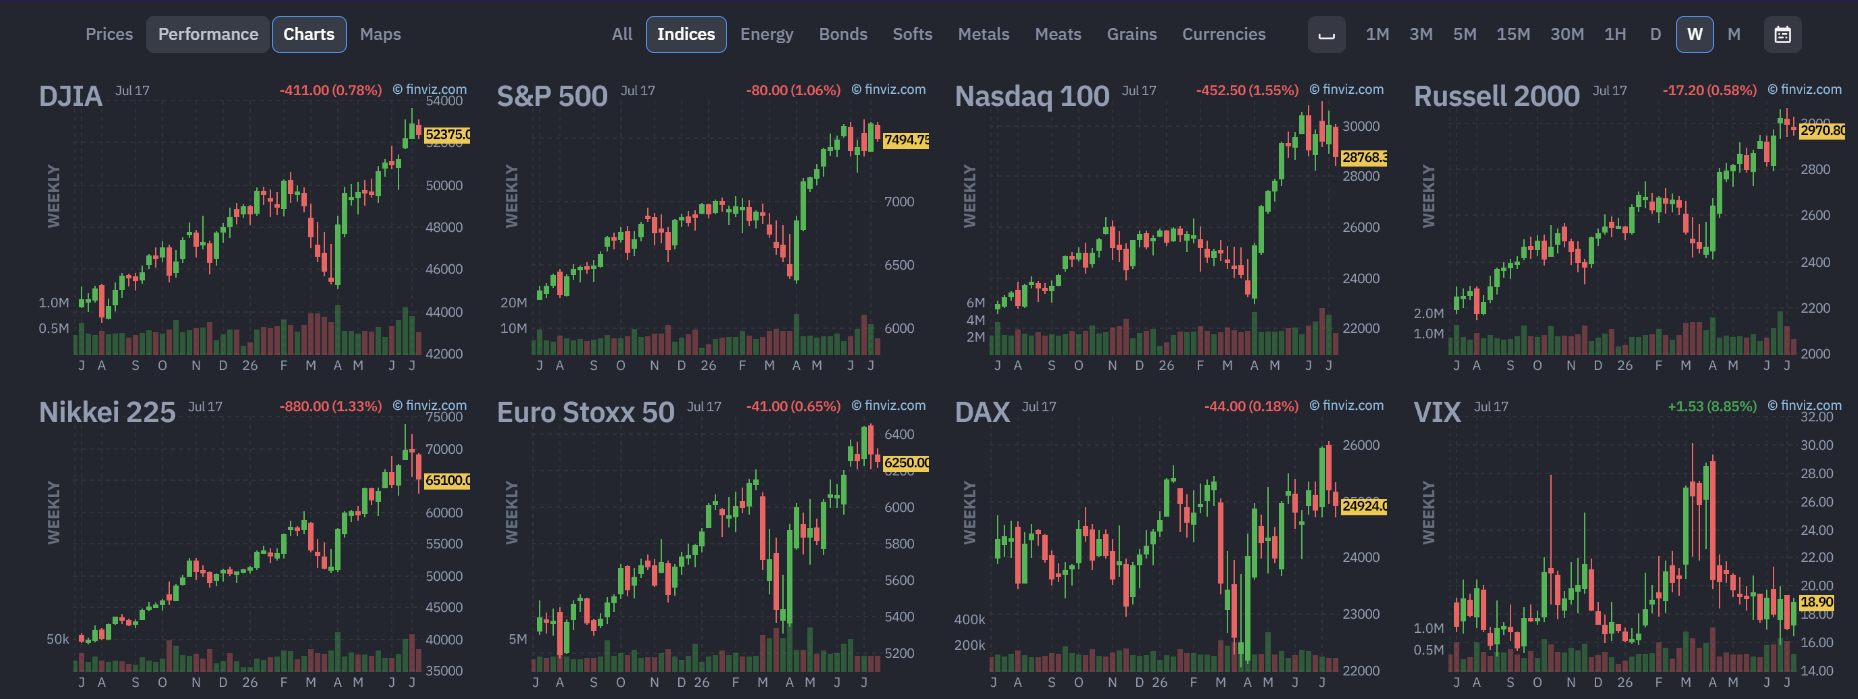
Across the Equity Indices, all seven contracts fell, the sector easing to -2.16% with the reversal centred on the names that had led. The Nikkei 225 dropped 5.94% and the Nasdaq 100 4.19%, the two heaviest, with the S&P 500 off 1.61%, the DAX 1.06%, the DJIA 1.00%, the Russell 2000 0.68% and the Euro Stoxx 50 0.67%. The US large caps that had strengthened back toward record territory a week earlier turned lower, the Nasdaq 100 and the S&P 500 surrendering the ground they had pressed, while the European indices that had fallen hardest the prior week eased far less this time. On the weekly charts the US megacaps rolled off the highs they had been testing, so the week reads as the first broad pullback across the sector in some time rather than the rotation within it seen recently, the leadership that had passed between the US and Europe now giving way to a decline shared by both.
Energy (+9.55% | prev +2.93%)

Energy led the board by a wide margin, surging to +9.55% as the petroleum complex moved almost as one in the largest sector move on the board. Crude Oil Brent rose 15.91%, Crude Oil WTI 15.61%, Heating Oil 14.39% and Gasoline RBOB 13.67%, a tight cluster of gains across crude and the refined products, while Natural Gas eased 0.99% and Ethanol 1.30% as the two decliners. The move extended and accelerated the turn crude had made a week earlier: where Brent and WTI had risen only modestly and Heating Oil had already begun to run, all four petroleum contracts now pushed higher together in a coherent, one-way advance. On the weekly charts crude broke up out of the lower part of the range it had pressed for weeks, the refined products running alongside it, so the sector moved in unison rather than on the split of recent weeks. Whether the breakout holds or fades back into the longer range is the open question the weekly chart leaves, the advance broad and one-way where the recent weeks had split.
Metals (-2.36% | prev +0.09%)

Across the metals complex, every contract declined, the sector dropping to -2.36% as the precious side surrendered ground and Copper eased with it. Silver fell 6.38%, the heaviest decline in the sector, with Gold off 2.31%, Palladium 1.84%, Platinum 1.01% and Copper 0.27%. The pause of a week earlier turned into a broad decline: Silver extended the slide it had begun, handing back far more than the 1.47% it had eased the prior week, and Gold slipped further from its recovery. On the weekly charts the precious metals dropped deeper into the pullback from their highs, the two-week loss of momentum now a clear move lower rather than a stall, while Copper eased off the top of its range after weeks of strength, though its longer uptrend held. The sector average of -2.36% sits on a broad decline led by Silver rather than the narrow, mixed prints of recent weeks.
Soft Commodities (-3.39% | prev +3.73%)
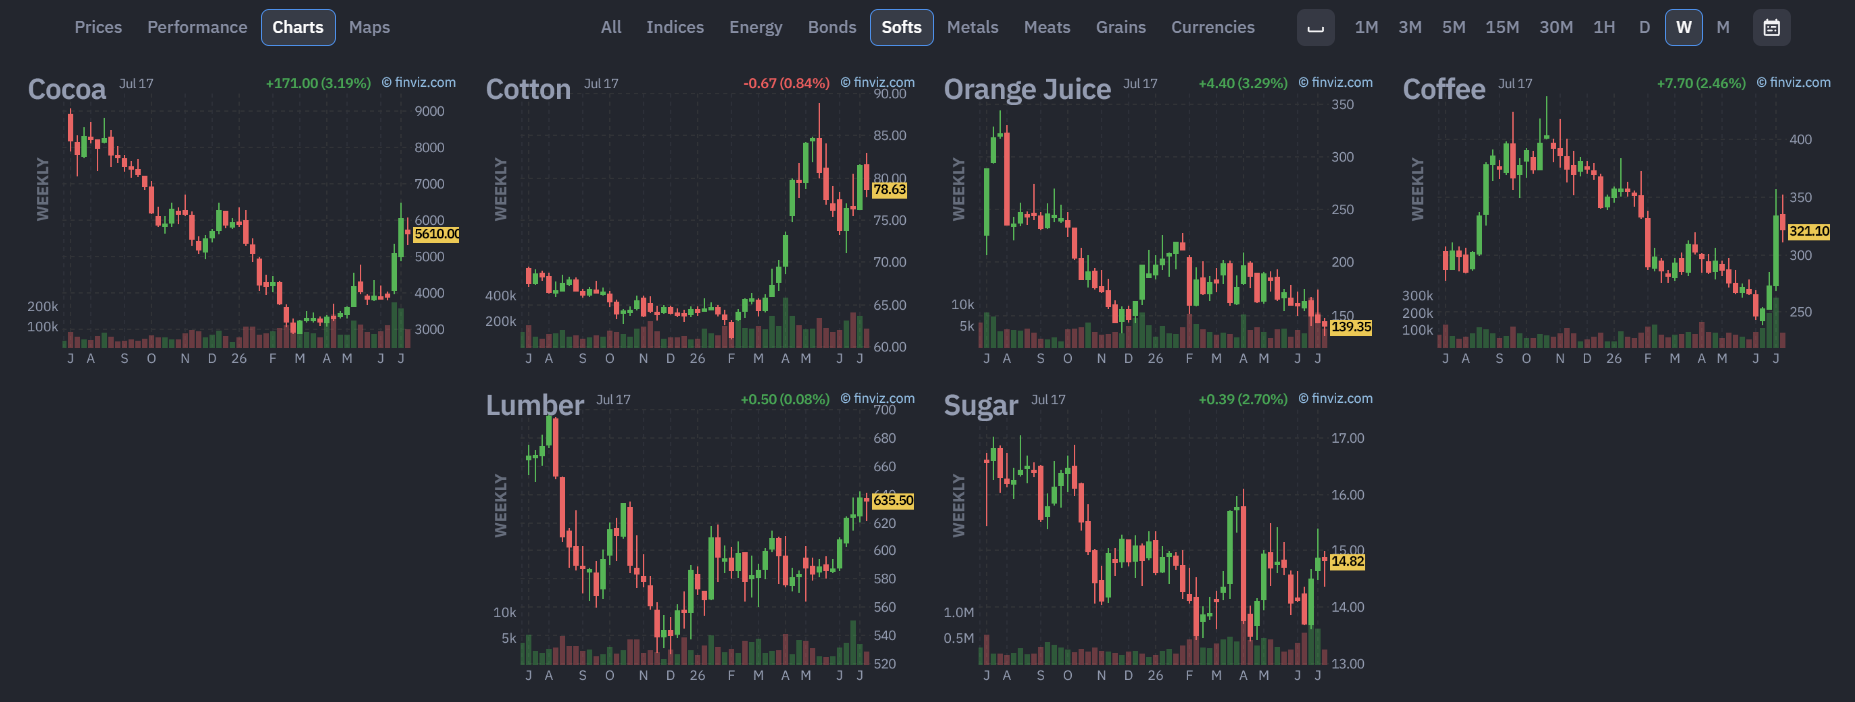
From the top of the board to the bottom, Soft Commodities dropped to -3.39% as every contract that had carried the sector a week earlier reversed. Cocoa fell 8.77%, the heaviest decline in the sector, reversing its 20.43% surge, with Coffee off 4.17% after a 10.97% gain, Cotton 3.57% after 5.73%, Lumber 0.47% and Sugar 0.34%, while Orange Juice continued lower at a shallower 3.02% after its 16.72% drop. All six contracts finished lower, an exact inversion of the week before when five of six had risen. The weekly charts show Cocoa swinging back down from the spike it had made and Coffee rolling over from the climb it had extended for weeks, while Orange Juice pressed further toward the lows it had spiked from, its decline now shallower as the earlier collapse ran its course. The split that had run through the sector closed into a single direction, every contract turning lower together where the leadership had passed back and forth in the weeks before.
Grains (+1.92% | prev +5.25%)
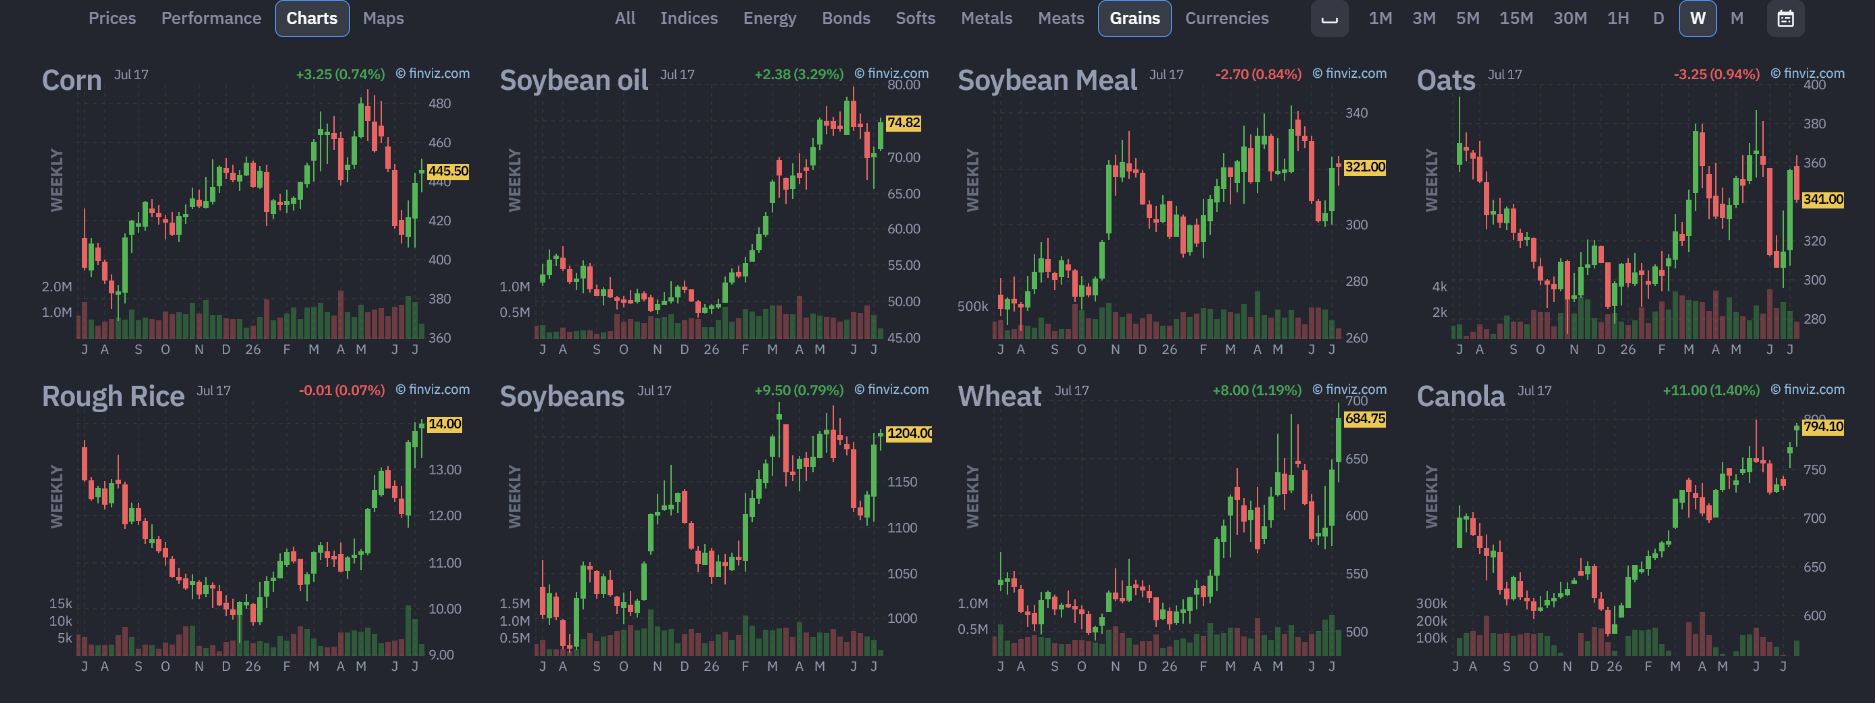
Grains held a narrower advance, the sector easing to +1.92% as the broad move of a week earlier thinned to the top of the complex. Wheat rose 6.64% and Soybean Oil 6.17%, the two leaders, with Canola up 2.98%, Rough Rice 1.26%, Corn 1.19% and Soybeans 1.07%, while Soybean Meal eased 0.06% and Oats reversed to a 3.93% fall. Six of eight contracts finished higher, but the tight, one-way cluster of the prior week gave way to a split, Wheat and Soybean Oil holding their climbs while Oats surrendered the 6.42% it had gained. On the weekly charts Wheat and Soybean Oil extended the lift they had begun, pressing up off the lower part of their ranges, while Oats reversed the bounce it had made and Soybean Meal stalled. The sector average of +1.92% sits on a thinner, top-heavy advance rather than the broad, all-eight move of the week before, the first crack in the complex since it turned up together.
Meats (-1.45% | prev -1.03%)

The Meats fell again and by more than a week earlier, easing to -1.45% as both cattle contracts dropped harder while Lean Hogs pushed higher. Live Cattle fell 4.58% and Feeder Cattle 2.44%, both deeper declines than the prior week, while Lean Hogs rose 2.68%, extending its stronger tone. The same split as recent weeks held, the cattle side lower and the hogs higher, but the cattle moves widened where they had shallowed the week before. On the weekly charts the cattle contracts dropped further from the top of the ranges they had held for months, a third leg of pullback that has now steepened rather than eased, while Lean Hogs pushed up off the ground it had recovered. The sector average of -1.45% reflects the two cattle declines outweighing the larger hog gain, a deeper fall than previously as the cattle moves regained force.
Bonds (+0.16% | prev -0.53%)

Bonds strengthened across the curve, reversing the easing of a week earlier with the long end strongest. The 30 Year Bond rose 0.22%, the 10 Year Note 0.21%, the 5 Year Note 0.15% and the 2 Year Note 0.07%, a clean gradient with the long end stronger than the front and the sector average at +0.16%. That turns back up after the give-back across the curve the prior week, the same shape reversed, the long end that had led the decline now leading the recovery. The weekly charts show prices steadying off the lower part of the range the contracts have traced through the spring, the long end recovering first and the move running alongside the pullback in the Equity Indices rather than against it, while the front end stayed anchored. The move was small in size but clean in shape, the mirror of the easing it followed.
Currencies (+0.33% | prev +0.12%)

The basket strengthened modestly as the commodity-linked dollars led and the US dollar eased. The USD index fell 0.17%, giving back the small uptick of a week earlier, with NZD leading the gainers at +1.33%, CAD up 0.97% as it tracked the energy surge, AUD 0.45%, GBP 0.41%, EUR 0.14% and CHF 0.05%, while JPY eased 0.53%, leaving the sector average at +0.33%. The commodity dollars that had held their ground the prior week pushed higher, NZD and CAD the clear leaders as crude and the wider commodity complex rose, while the yen unwound part of its recent move and the European crosses steadied. The weekly charts show the USD index easing back from the upper part of its recent range, the move reading as a soft turn lower in the basket led by the commodity currencies rather than a broad dollar trend, CAD in particular strengthening in step with the energy move.
Volatility, Crypto: The VIX jumped 10.91% as implied volatility turned up sharply, reversing the two weeks of decline that had carried it toward its lows and rising in step with the pullback across the Equity Indices. Bitcoin rose 2.77%, extending the small gain it had made a week earlier and building on the ground it had recovered. The weekly chart keeps Bitcoin inside the broader range it has held for months, the latest gain reading as a continuation of the recovery rather than a break higher, though it held firm while the Equity Indices fell, standing apart from the risk-off tone that lifted the VIX. Where volatility rose with the equity decline, Bitcoin traded on its own footing, strengthening as the broad risk assets softened rather than tracking them lower.
Top Movers

Top five up and top five down by single-week percentage move.
The two lists run in opposite directions by sector, and the shape has changed again from a week earlier. The upside is unusually concentrated, the four petroleum contracts taking the top four places and the VIX the fifth, an energy-and-volatility block with nothing else near it. The downside is scattered by contrast: Cocoa reversing its 20.43% surge, Silver extending its slide, the Nikkei 225 and the Nasdaq 100 leading the equity pullback, and Live Cattle dropping again. Crude Oil Brent’s 15.91% gain was the largest single move on the board this week, the petroleum complex clustered just behind it, while Cocoa’s 8.77% drop led the downside, the mirror of the surge it had made the week before. The contrast is the week in miniature: a narrow, powerful set of energy gains against a broad, scattered set of declines drawn from the sectors that had led the board the prior week.
Portfolio View
The week rotated again, and the rotation cut against the books still carrying the prior week’s leaders. The reminder in it was the same one that recurs: portfolio returns depend less on how many markets trend than on whether the trends already held survive. This week many did not. Cocoa swung from a 20.43% surge to an 8.77% fall, Coffee from a 10.97% gain to a 4.17% decline, the grains handed back part of their broad advance and Silver extended its slide, reversals that whipsawed positions built on the commodity leadership of a week earlier. The trend that paid was the energy complex, and it paid most where books had already held Heating Oil and caught crude’s turn rather than chased the sharpest gains as they built this week. The clearest directional contributor was the split between the trends that survived and those that broke: the reversals in the softs and the grains outweighed the energy continuation carried into the week, pulling the year’s figure back by roughly 0.53 of a point to +8.09% even as overall trend strength rose. The week favoured books that had rotated early into the energy trend over those still positioned along the commodity leadership now turning over.
Final Reflections
The defining feature of the week was a rotation that lifted trend strength even as it cost trend followers a little. The TTU Barometer rose to 50%, moving from Moderately Weak to Strong as the reading recovered above the 40% floor and back up toward the 55% favourable threshold, yet the SG Trend Index gave back roughly 0.53 of a point to +8.09% year to date and deepened within the month to -0.95%, even as contract-level breadth turned negative at 23 of 49 contracts higher against 26 lower, none unchanged. The market offered a little more trend strength but a little less trend-follower reward this week, the inverse of the week before and a return to the configuration of the weeks before that.
Last week falling trend strength sat alongside the commodity trends that held and paid; this week rising trend strength sat alongside the reversals of those same trends, and the books still carrying them gave back part of the year’s gain.
1. The barometer rose as the moves turned large and coherent, the same reading driven higher by the opposite pattern from the week before.
The five-week sequence (45, 55, 64, 39, 50) rose to 50% this week, up 11 points and recovering close to half of the prior week’s 25-point fall, lifting from below the Neutral floor back up toward the favourable threshold. It rose even as breadth turned negative, 23 of 49 contracts higher against 26 lower, where a week earlier it had fallen while breadth stayed positive. The point holds either way: the barometer counts how strongly and persistently markets are trending, in either direction, not which way they point, so it can rise on a week of large, one-way sector moves just as it fell on a week of broad reversals before. The energy complex running as a block, the Equity Indices falling together and Silver and the precious metals extending lower all added to the count of markets trending decisively, a set of coherent moves that firmed the reading the barometer measures. The 10-day rate of change reads Neutral, up from last week’s Falling Rapidly, so the near-term pace has stopped falling as the weekly level climbed, the two measures now pointing the same way. Rising trend strength says more markets are moving decisively; portfolio returns still depend on whether those moves are the ones a book already holds.
2. The reversals that cost fell on the trends that had paid the week before, while the energy continuation paid but could not outweigh them, the pattern that pulled the index down even as it lifted the barometer.
The softs, the grains and Silver produced the reversals that cost this week, while the energy complex produced the continuation that paid, and the balance between them is the whole of the story. Cocoa swung from a 20.43% surge to an 8.77% fall, Coffee from a 10.97% gain to a 4.17% decline, the grains handed back part of their broad advance and Silver extended its slide to 6.38%, reversals that whipsawed positions built on the prior week’s leadership. Against them Heating Oil extended from 11.66% to 14.39% and crude ran higher off the turn it had made, a continuation that paid the books already holding it, though the sharpest gains in Brent, WTI and Gasoline RBOB built only as this week opened. The barometer reads the persistence and strength of trends in either direction, so it rose as the energy block and the decisive declines firmed the count; the index reads the profit and loss of positions carried through the week, so it eased as the reversals in the sectors that had led outweighed the energy gains that books were still building into. The largest, most coherent trend this week sat with the energy complex, and the books that had rotated toward it early were the ones it paid.
For trend followers, the week was not defined by whether markets rose or fell. It was defined by whether the moves were persistent enough to be captured. The opportunity was directional, but not directionally biased.
One question frames the week ahead: Can the energy breakout harden into a trend that holds, as crude keeps its footing and the refined products run with it, or does it prove another one-week spike in leadership, the way Cocoa and the softs surged and reversed before it? The answer will say less about where prices travel than about whether leadership can finally persist long enough for trend followers to harvest it.

List of Resources used in the Week in Review
Important Disclaimers
This document is directly solely to Accredited Investors, Qualified Eligible Participants, Qualified Clients and Qualified Purchasers. No investment decision should be made until prospective investors have read the detailed information in the fund offering documents of any manager mentioned in this document. This document is furnished on a confidential basis only for the use of the recipient and only for discussion purposes and is subject to amendment This document is neither advice nor a recommendation to enter into any transaction. This document is not an offer to buy or sell, nor a solicitation of an offer to buy or sell, any security or other financial instrument. This presentation is based on information obtained from sources that TopTradersUnplugged (“TTU”) (“considers to be reliable however, TTU makes no representation as to, and accepts no responsibility or liability for, the accuracy or completeness of the information. TTU has not independently verified third party manager or benchmark information, does not represent it as accurate, true or complete, makes no warranty, express or implied regarding it and shall not be liable for any losses, damages, costs or expenses relating to its adequacy, accuracy, truth, completeness or use.
All projections, valuations, and statistical analyses are provided to assist the recipient in the evaluation of the matters described herein. Such projections, valuations and analyses may be based on subjective assessments and assumptions and may use one among many alternative methodologies that produce different results accordingly, such projections, valuations and statistical analyses should not be viewed as facts and should not be relied upon as an accurate prediction of future events. There is no guarantee that any targeted performance will be achieved Commodity trading involves substantial risk of loss and may not be suitable for everyone
TTU is not and does not purport to be an advisor as to legal, taxation, accounting, financial or regulatory matters in any jurisdiction. The recipient should independently evaluate and judge the matters referred to herein. TTU does not provide advice or recommendations regarding an investor’s decision to allocate to funds or accounts managed by any manager (“or to maintain or sell investments in funds or accounts managed by any manager, and no fiduciary relationship under ERISA is created by the investor investing in funds or accounts managed by any manager, or through any communication between TTU and the investor
In reviewing this document, it should be understood that the past performance results of any asset class, or any investment or trading program set forth herein, are not necessarily indicative of any future results that may be achieved in connection with any transaction. Any persons subscribing for an investment must be able to bear the risks involved and must meet the suitability requirements relating to such investment. Some or all alternative investment programs discussed herein may not be suitable for certain investors This document is directed only to persons having professional experience in matters relating to investments. Any investment or investment activity to which this document relates is available only to such investment professionals. Persons who do not have professional experience in matters relating to investments should not rely upon this document.
This document and its contents are proprietary information of TTU and may not be reproduced or otherwise disseminated in whole or in part without TTU’s prior written consent.
This document contains simulated or hypothetical performance results that have certain inherent limitations AND SHOULD BE VIEWED FOR ILLUSTRATIVE PURPOSES. Unlike the results shown in an actual performance record, these results do not represent actual trading. HYPOTHETICAL PERFORMANCE RESULTS HAVE MANY INHERENT LIMITATIONS, SOME OF WHICH ARE DESCRIBED BELOW. NO REPRESENTATION IS BEING MADE THAT ANY ACCOUNT WILL OR IS LIKELY TO ACHIEVE PROFITS OR LOSSES SIMILAR TO THOSE SHOWN IN FACT, THERE ARE FREQUENTLY SHARP DIFFERENCES BETWEEN HYPOTHETICAL PERFORMANCE RESULTS AND THE ACTUAL RESULTS SUBSEQUENTLY ACHIEVED BY ANY PARTICULAR INVESTMENT ACCOUNT.
ONE OF THE LIMITATIONS OF HYPOTHETICAL PERFORMANCE RESULTS IS THAT THEY ARE GENERALLY PREPARED WITH THE BENEFIT OF HINDSIGHT IN ADDITION, HYPOTHETICAL TRADING DOES NOT INVOLVE FINANCIAL RISK, AND NO HYPOTHETICAL TRADING RECORD CAN COMPLETELY ACCOUNT FOR THE IMPACT OF FINANCIAL RISK IN ACTUAL TRADING FOR EXAMPLE, THE ABILITY TO WITHSTAND LOSSES OR TO ADHERE TO A PARTICULAR TRADING PROGRAM OR OTHER ASSET.
There are numerous other factors related to the markets in general or to the implementation of any specific trading program which cannot be fully accounted for in the preparation of hypothetical performance results and all of which can adversely affect actual trading results. No representation is being made that any investment will or is likely to achieve profits or losses similar to those being shown.
Most Comprehensive Guide to the Best Investment Books of All Time

Most Comprehensive Guide to the Best Investment Books of All Time
Get the most comprehensive guide to over 600 of the BEST investment books, with insights, and learn from some of the wisest and most accomplished investors in the world. A collection of MUST READ books carefully selected for you. Get it now absolutely FREE!
Get Your FREE Guide HERE!