


Trend Following - Week in Review— May 1, 2026

“Energy Extends, Softs Snap Back, and the Barometer Reclaims 55%”
This Week in Trend – 1 May 2026
Welcome to This Week in Trend, your weekly view into the evolving structure of global futures markets and the behaviour of systematic trend following. This edition covers conditions through the close of US markets on Friday, 1 May 2026.
Energy extended for a second week, but this time the move was cleaner. Brent advanced 10.67%, WTI gained 7.99%, Gasoline RBOB rose 7.75%, and Heating Oil added 4.03%. The Energy sector averaged +6.02%, with all six Energy contracts moving higher in unison for the first time in the current cycle, ending the two-week whipsaw. Soft commodities reversed sharply higher to +4.93% after three consecutive negative sector readings, with Orange Juice +16.85%, the largest single-asset move of the week and a near-complete reversal of the prior week’s -15.16% print. Cotton, Sugar, and Cocoa all advanced more than 4.5%.
Metals printed a second consecutive negative sector reading at -0.57%, but the magnitude shrank dramatically from the prior week’s -4.36%, and the breadth fractured: Palladium turned positive at +2.40%, while Gold, Copper, and Platinum extended losses. Bonds moved lower across the curve at -0.48%, the second consecutive negative week. The U.S. dollar reversed direction, the USD falling 0.36% as commodity-linked currencies and JPY firmed. Equity indices held narrowly positive at +0.39% on continued U.S. tech leadership, with the Nikkei 225 the lone material laggard at -1.03%. The VIX gave back 5.58%, the largest single-asset decline of the week.
The TTU Trend Barometer recovered from 50% to 55%, with the overall trend strength reading classified as Strong. The reading sits exactly on the Neutral/Strong threshold line, the same level it touched two weeks ago before the disruptive whipsaw week. The 10-day rate of change reads “Falling Weakly”, unchanged from the prior two weeks. The SG Trend Index closed April at +2.98% for the month and +10.27% year to date, both fresh 2026 highs and the first double-digit YTD reading of the year. April closed as the strongest single trend-following month of 2026 to date.
For trend followers, the week resolved the question that the prior fortnight had left open. Energy went uniform-direction up rather than continuing to whipsaw, removing one of the two large sources of cross-sector disruption. Soft commodities turned cleanly higher, opening fresh directional opportunities in tropicals and Cotton. Metals consolidated rather than extended their decline, leaving the multi-month upward structure intact. Equity indices and currencies remained the quieter complexes. The barometer’s recovery to the threshold and the SG Index advance into double-digit YTD territory together describe a cycle that has reasserted itself.
SG Trend Index Performance
April month-end: +2.98 percent
Year to date: +10.27 percent
Prior week reading (as of 24 April 2026):
Month to date (through 24 April): +1.54 percent
Year to date: +8.73 percent
The SG Trend Index closed April at +2.98% for the month and +10.27% year to date, up from +1.54% MTD and +8.73% YTD a week ago. Both readings set fresh 2026 highs, and the YTD figure crossed into double digits for the first time this year. April closed as the strongest single trend-following month of 2026 to date. The April gain nearly doubled inside the final week of the month, indicating that the closing week captured the cleanest directional moves of the period.
The directional contributions consolidated rather than rotated this week. Long Energy exposure, which had whipsawed across the prior fortnight, contributed strongly on a uniform-direction up week with all six Energy contracts moving higher together. Long Soft commodity exposure turned constructive after three weeks of detraction, with Orange Juice reversing sharply, Cotton extending its weather-driven story, and Sugar and Cocoa following through on the prior week’s tropical reversal. Long Metals exposure held flat to slightly negative as the corrective phase moderated rather than extended. Short USD positioning recovered as the dollar gave back the prior week’s safe-haven bid, with JPY, AUD, CAD, and the Sterling complex all firmer. Long Equity exposure held a modest positive contribution, and Long Bond exposure detracted for a second consecutive week.
The barometer has recovered to 55% from 50%, with the classification remaining Strong. The cycle has now traced the sequence 48, 52, 55, 50, 55: a five-week round trip back to the threshold, with the disruption of the Hormuz whipsaw fully absorbed. The +10.27% YTD figure crystallises April’s contribution into the year’s headline number. The composition this week is broader than last: Energy, Softs, Grains, Meats, and Crypto all positive, against Bonds, Metals, and Volatility on the soft side. Breadth has improved alongside the headline number.
TTU Trend Barometer
Current reading: 55 percent
Previous reading: 50 percent
10-day rate of change: Falling Weakly
The barometer recovered from 50% to 55%, reclaiming the level it printed two weeks ago. The full sequence reads 48, 52, 55, 50, 55: a five-week round trip back to the Neutral/Strong threshold. The recovery sits exactly on the boundary line, with the classification remaining Strong but at the lowest level inside that band. The 10-day rate of change reads “Falling Weakly” for the third consecutive week, suggesting the deceleration has stabilised rather than resolved. The classification has held; the headline level has recovered; the rate-of-change tilt remains soft.
The mechanism is broader directional alignment than the prior week offered. Energy went uniform-direction up rather than continuing to whipsaw, with all six contracts moving higher in unison and the sector at +6.02%. Softs reversed cleanly upward to +4.93%, breaking three consecutive negative weeks. Grains held a positive sector reading at +2.70% with Soybean Oil, Oats, and Corn each above 3.5%. Meats turned positive at +1.81% with Live Cattle and Feeder Cattle both up. The breadth of clean directional signals improved across five sectors at once, which is what the barometer is calibrated to detect. The five-point recovery in a single week reflects that breadth shift.
A 55% Strong-classified reading sitting on the threshold argues for engagement, with the awareness that any further softening would slip the cycle back into Neutral. Energy is now on the long side after a uniform-direction week, and that read carries more conviction than last week’s spike-and-reverse pattern, but the petroleum complex has travelled a long distance in three weeks and the absolute level of crude prices has begun to attract physical demand-destruction commentary. Softs have turned upward across a broad base, but several of the contracts in question have well-documented liquidity profiles that amplify both directions. Metals have moderated rather than extended their correction, and the structural read on the multi-month upward complex remains intact. The classification favours continued engagement; the level itself argues against aggressive scaling into reads that have only just reasserted themselves.
The 55% reading sits on the Neutral/Strong boundary. Whether the cycle holds the threshold, recovers further into stronger territory, or slips back through 55% turns on three things: whether the Energy uptrend extends or fades into consolidation, whether Soft commodities follow through on the upward turn or whipsaw again, and whether the Metals correction stays moderated or restarts. The “Falling Weakly” tilt argues that the path of least resistance over the immediate term is sideways at the threshold rather than a sharp directional move in either direction.
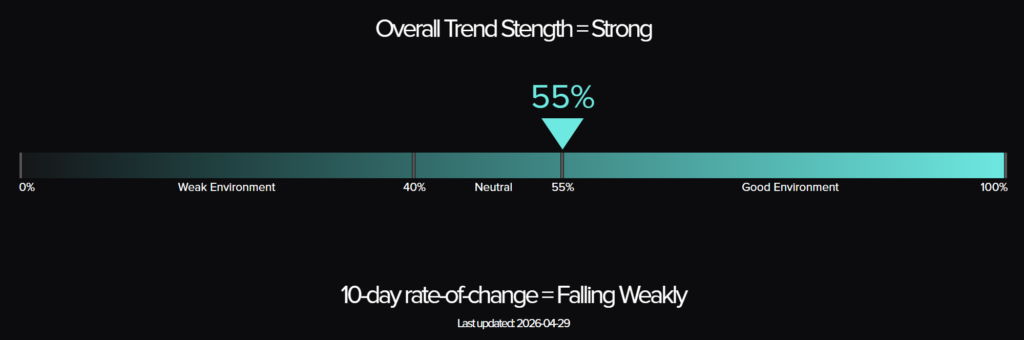
The Top Traders Unplugged (TTU) Trend Barometer is a proprietary tool that measures the percentage of markets with medium to strong trends. Similar to a thermometer, where 0 degrees Celsius equates to freezing, a TTU Trend Barometer reading below 40% indicates a “cold” environment for trend-following, while readings above 55% signal a “hotter,” more favorable trend environment.
Weekly Asset Class Snapshot
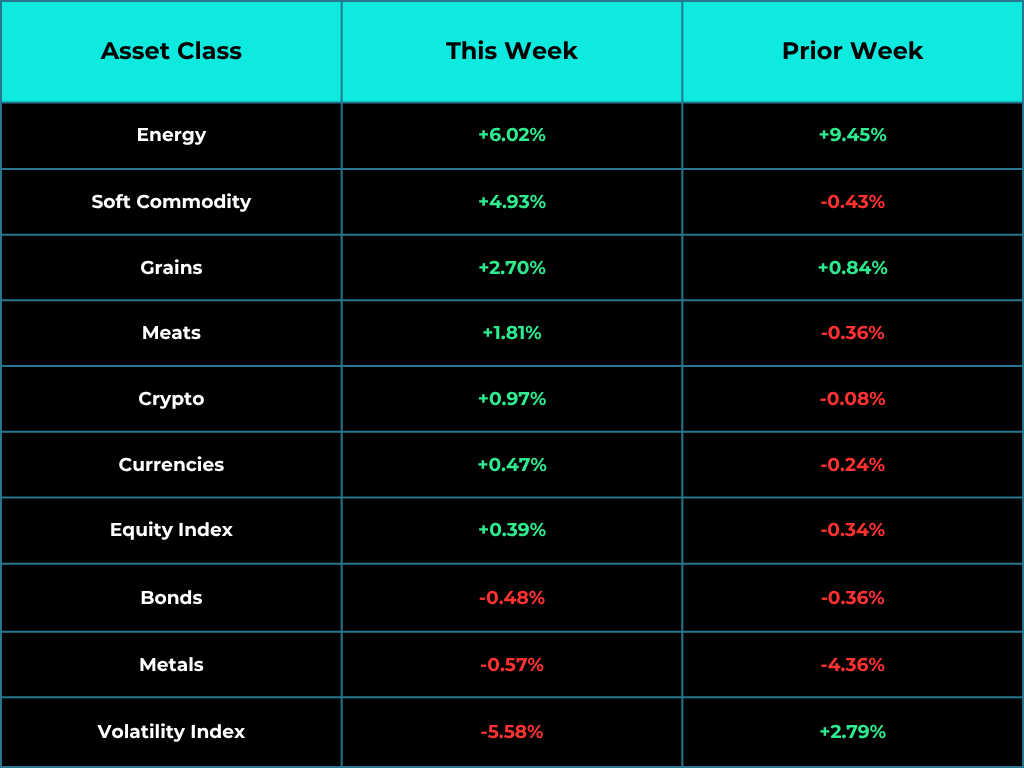
Source: Finviz.com
Energy (+6.02 percent | prev +9.45 percent)
Energy held its upward bias for a second consecutive week, the sector averaging +6.02% after last week’s +9.45%, but the internal character of the move shifted decisively. For the first time in the current cycle, all six contracts moved higher in the same direction. Brent advanced 10.67%, WTI 7.99%, Gasoline RBOB 7.75%, Heating Oil 4.03%, Natural Gas 3.62%, and Ethanol 2.07%. The Hormuz risk premium that drove last week’s spike was joined this week by additional bullish drivers. EIA reported a 6.2 million barrel draw in U.S. commercial crude inventories for the week ending 24 April, with gasoline stocks down a further 6.1 million barrels and distillate stocks down 4.5 million barrels, all materially above forecast. The U.S. continued SPR releases under the IEA-aligned response to the Middle East supply shock. The UAE announced its withdrawal from OPEC and OPEC+ effective 1 May, which removed a member with roughly 4.8 million barrels per day of capacity from the producer group during an active energy crisis and added structural uncertainty to the supply outlook. Natural Gas joined the upward move on a +79 Bcf storage build that came in smaller than the prior week’s +103 Bcf, against a backdrop of falling production to a 12-week low near 107.6 bcfd as major producers curtailed output, and near-record LNG export feedgas above 18.8 bcfd. The two-week pattern has converted from spike-and-reverse to spike-and-extend, which is materially more constructive for medium-term directional signals than last week’s read suggested.
Brent prints near 109.20 and WTI near 102.50, both at fresh multi-month highs and well above the prior month’s range. Gasoline RBOB near 3.61 and Heating Oil near 3.98 have both pushed through their April peaks. Natural Gas near 2.79 has snapped a five-week downtrend, the first directional break in the contract since early March. The weekly chart structure across the petroleum complex has shifted from wide-range two-way trade to a clean upward channel for the first time in the current cycle. The directional opportunity is now on the long side with material conviction, with the caveat that the two-week cumulative magnitude has been substantial and short-cycle profit-taking remains a near-term risk.
Bonds (-0.48 percent | prev -0.36 percent)
Bonds extended the prior week’s softness at -0.48% after last week’s -0.36%, with all four contracts moving lower in unison for a second consecutive week. The 30-year Bond fell 0.79%, the 10-year Note 0.52%, the 5-year Note 0.40%, and the 2-year Note 0.20%. The long end again led the move on the way down, the same pattern as last week. The mechanics are unchanged: Brent above 109 and WTI above 102 keep the energy-driven inflation impulse firmly priced in, the 10-year Treasury yield ticked up another few basis points to around 4.35%, and the second consecutive directional week has begun to convert what was a single-week interruption last week into a clearer downward signal.
The 30-year sits near 113.19 and the 10-year near 110.67, both extending the prior week’s break of the cautiously upward-sloping structures that had been building. Two consecutive directional weeks lower with energy still elevated calls the duration story into question. A third week in the same direction would convert the corrective read into a clearer trend-reversal signal for systems on the short side of the curve. The 2-year and 5-year prints near 103.57 and 107.86 have moved less, leaving a flattening dynamic underneath the headline weakness.
Soft Commodity (+4.93 percent | prev -0.43 percent)
Soft commodities reversed sharply higher, the sector averaging +4.93% after three consecutive negative weekly prints, the cleanest single-week reversal across all ten sectors in this comparison. Orange Juice advanced 16.85%, the largest single-asset move of the week and a near-complete reversal of the prior week’s 15.16% decline. Cotton rose 6.09%, extending the weather-driven story that had paused last week. Sugar advanced 5.95%, Cocoa 4.81%, and Lumber moved 1.26% lower. Coffee was the lone material counter-direction print at -2.88%. Five of the six contracts moved higher, the breadth fully inverted from the prior week. The drivers were primarily contract-specific rather than thematic: thin liquidity in OJ amplified a short-covering reversal off multi-month lows, U.S. cotton acreage came in lower than expected in the planting intentions report, Brazilian centre-south sugar mills reported slower crush rates, and West African cocoa origin reports showed continued shortfall in mid-crop arrivals.
The bifurcated complex of recent weeks has converted into a more uniform upward read, with one significant exception. Orange Juice trades near 188.95, well above the prior week’s lows but still inside a long-running downward structure on a multi-month view; the question now is whether this is a corrective rally inside the broader downtrend or a structural turn. Cotton near 84.24 has resumed the upward break that had been building. Sugar near 14.97 and Cocoa near 3598 have both turned upward off recent base levels, with the chart structures now showing the early stages of potential directional reversals. Coffee near 289.95 is the lone hold-out, the contract still trapped in its multi-month downward structure. Lumber near 588.50 sits inside its established range. The sector now offers four contracts on the long side, Coffee on the short side, and Lumber still trapped inside its established range, the cleanest sector-internal alignment in some weeks.
Metals (-0.57 percent | prev -4.36 percent)
Metals printed a second consecutive negative sector reading at -0.57% after last week’s -4.36%, but the magnitude moderated sharply and the breadth fractured. Palladium turned positive at +2.40%, the only contract in the complex on the upward side. Silver moved 0.66% lower, Platinum 0.91% lower, Copper 1.63% lower, and Gold 2.03% lower. The sequence reads as consolidation after the prior week’s uniform-direction correction rather than an extension of it. The macro backdrop softened modestly: the dollar gave back some of its prior-week firmness, the 10-year yield rose only marginally, and Fed rate-cut expectations stabilised after the prior week’s hawkish commentary digest. The structural backdrop, including supply tightness in South African and Russian mines and the ongoing reserve-diversification trade, remains the operating thesis.
Silver trades near 75.84, broadly unchanged from last week. Gold sits near 4625.66, having extended the prior week’s giveback by another 2%. Platinum near 2000.79 is now back below the 2000 threshold for the first time in several weeks. Palladium near 1538.50 has stabilised and ticked back up. Copper near 5.96 remains inside its established range with a small downward bias. The corrective phase has moderated rather than extended, which is the read the longer-term structural thesis required. A third consecutive negative week with renewed magnitude would shift the read; a moderating second week leaves the multi-month upward structure intact. The directional opportunity inside the complex is now contract-specific rather than thematic, with Palladium showing the cleanest upward turn and Gold the cleanest continuation lower.
Meats (+1.81 percent | prev -0.36 percent)
Meats turned positive at +1.81% after two consecutive negative sector reads, with the cattle complex doing the heavy lifting. Live Cattle advanced 3.17%, reversing the prior two weeks of pressure, and Feeder Cattle gained 2.87% on similar mechanics. Lean Hogs gave back 0.61% after last week’s modest 0.84% gain. The cattle story is the live read: two consecutive directional weeks lower had begun to threaten the multi-month upward structure that had built through 2026, and the question for the week ahead was whether a third directional week would compromise that structure. The answer this week is no: both Live Cattle and Feeder Cattle reversed cleanly, with the upward break reasserting the longer-term directional read.
Live Cattle near 253.00 has reclaimed the level it traded at three weeks ago, with the weekly chart printing a near-complete recovery candle. Feeder Cattle near 372.03 has done the same. The two-week corrective pattern that had begun to qualify as a structural threat has been resolved on the upside in a single week. Lean Hogs near 101.33 continues its volatile chop pattern; the contract has now alternated direction every week for the past month, which remains hostile to medium-term trend signals in either direction. The cattle complex offers the cleanest read in the sector: directional, persistent, and now structurally intact.
Grains (+2.70 percent | prev +0.84 percent)
Grains held a third consecutive positive sector reading at +2.70%, with the breadth widening notably. Soybean Oil advanced 5.37% for a second consecutive week of strong gains, Oats added 4.14%, Corn 3.61%, Wheat 3.40%, Canola 2.32%, Soybeans 2.10%, and Rough Rice 0.58%. Soybean Meal was the lone non-participant at +0.06%, essentially flat. All eight contracts ended higher, but seven did so meaningfully, the broadest grain-complex breadth in several weeks. The drivers were a combination of weather, biofuel demand pull-through from the Energy strength, and supportive USDA acreage prints. Persistent dryness across the U.S. plains lifted Wheat and Corn, vegetable oil demand extended Soybean Oil and Canola, and Oats picked up on a tighter supply read.
The vegetable oil pocket continues to read as the cleanest directional pattern in the complex, with Soybean Oil and Canola both now in their second consecutive strong upward week and the charts confirming directional persistence. Wheat near 636.50 has now logged three consecutive upward weeks, reversing the prior multi-month lower-low pattern and converting the read from corrective to directional. Corn near 479.50 has pushed through resistance at the prior month’s highs. Oats near 352.50 reversed the prior two weeks of weakness in a single sharp upward print. The sector now offers a thematic upward read across most contracts rather than the contract-specific stories of recent weeks.
Equity Index (+0.39 percent | prev -0.34 percent)
Equity indices ended the week modestly positive on average at +0.39% after last week’s -0.34%, with the geographic split narrowing materially. The Nasdaq 100 advanced 1.46%, posting another fresh record high on continued earnings strength from large-cap technology. The S&P 500 added 0.88%, the Russell 2000 rose 0.83%, the DJIA gained 0.51%, and the DAX edged up 0.27%. The Euro Stoxx 50 was modestly negative at -0.22%, much improved from the prior week’s -2.80% print, and the Nikkei 225 was the lone material laggard at -1.03%, weighed by yen strength. The U.S.-led leadership pattern of the prior week extended, with Europe stabilising rather than continuing to deteriorate. The corporate earnings picture was the dominant driver: a strong end-of-month tape from technology earnings supported the U.S. complex, while European indices found support as energy prices, although still elevated, stopped accelerating.
The U.S. complex continues to lead, with the Nasdaq 100 near 27783, the S&P 500 near 7247, and the Russell 2000 near 2814 all printing fresh highs. The DJIA near 49595 lagged but remained positive. The European complex stabilised: the DAX near 24434 ticked up modestly and the Euro Stoxx 50 near 5848 held the prior week’s break. The Nikkei 225 near 59310 was the structural laggard, with yen strength weighing on exporter earnings expectations. The directional read across the complex has stabilised: U.S. indices on the long side with a clean structure, European indices in a stabilisation phase, the Nikkei the lone underperformer. The sector reads as broadly constructive rather than offering sharp directional opportunities in either direction.
Currencies (+0.47 percent | prev -0.24 percent)
The dollar reversed direction, the sector averaging +0.47% across the seven non-USD currencies as the USD itself fell 0.36%, retracing part of its prior-week firmness. JPY led the firmer side at +1.44%, AUD added 0.82%, CAD 0.57%, CHF 0.46%, GBP 0.41%, NZD 0.39%, and EUR was essentially flat at +0.06%. The mechanism is the inverse of last week. Where the prior period featured oil-up, dollar-up, risk-mixed, and majors-softer, this week features oil-up, dollar-down, risk-on, and majors-firmer. Treasury yields rose only marginally, removing the rate-differential support for the dollar that had operated last week, and the JPY in particular caught a renewed safe-haven bid as risk-on tape elsewhere did not extend to Asian equities.
The USD near 98.07 has given back roughly half of its prior-week recovery and now sits near the lows of the past two weeks. The two-week pattern of dollar weakness through early April has reasserted itself after a one-week interruption. JPY near 0.6387 has firmed materially. CAD near 0.7373 caught a commodity-linked bid, AUD near 0.7196 recovered, and EUR near 1.1744 held its level. The cleanest directional moves sit in JPY on the firmer side and the commodity-linked currencies on the recovery side. The currency complex now reads as a renewed weak-dollar regime rather than a continuation of last week’s bid.
Volatility Index (-5.58 percent | prev +2.79 percent)
The VIX fell 5.58%, the largest single-asset decline of the week and a sharp reversal of the prior week’s first uptick in four weeks. The contract trades near 19.80 after closing the prior week near 20.80. The decline is consistent with the U.S. equity strength, the stabilisation in European indices, and the broader risk-on tape. Hedges that had been re-added during the prior week’s geopolitical disruption were unwound as the Hormuz situation moved from acute crisis to ongoing stress without further escalation. The contract is now back below 20 for the first time in three weeks.
The single positive week last week did not establish a regime change, and this week’s sharp giveback confirms the read. The level near 19.80 is consistent with a normal equity volatility regime rather than an elevated-stress one. The short-volatility signal that had operated through three weeks of declines and then briefly interrupted has now resumed. A second consecutive declining week with similar magnitude would shift the read further in the same direction.
Crypto (+0.97 percent | prev -0.08 percent)
Bitcoin advanced 0.97% after the prior week’s flat -0.08% print, ending two consecutive weeks of consolidation. The contract trades near 78220, broadly unchanged on a three-week view but now with a modest upward bias. There was no specific crypto-side catalyst this week. Bitcoin participated narrowly in the broader risk-on tape: equity indices firmer, dollar softer, volatility lower. The two-week consolidation following the prior 15% advance has held, and the contract has begun to drift higher again.
The chart structure remains intact. The two-week pause did not break the prior advance, and the modest upward print this week resets the short-term bias to constructive. The longer-term uptrend remains the operating read, with the next directional question being whether the contract can push back toward its January highs near 95000 or whether it remains range-bound near current levels through the early summer.
Performance Highlights – This Week’s Market Leaders & Laggards
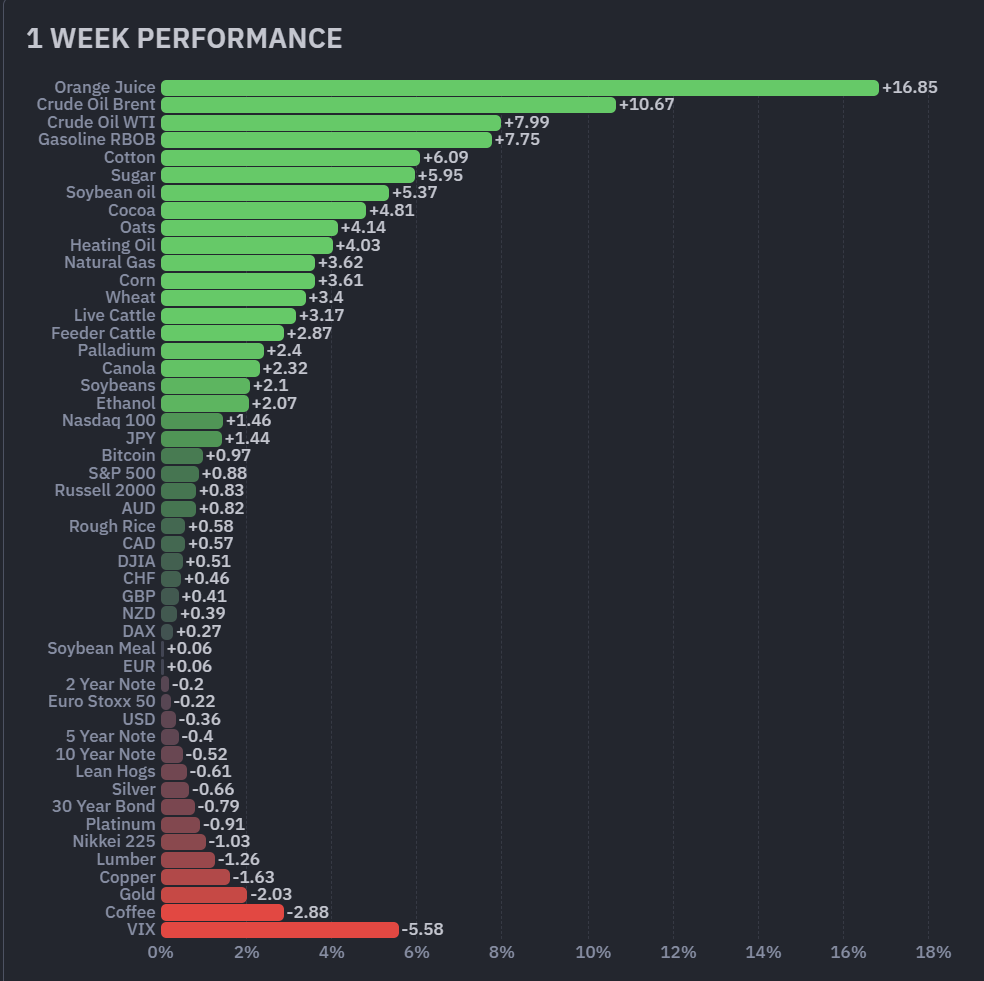
Source: Finviz.com
Top Market Movers
Top Gainers
1. Orange Juice +16.85 percent
Orange Juice advanced 16.85%, the largest single-asset move of the week in either direction and a near-complete reversal of the prior week’s 15.16% decline. The contract trades near 188.95. The move was primarily mechanical: thin liquidity, which had amplified the prior week’s downside, amplified the upside this week as short-covering met a small surge of demand-side speculation. The fundamental backdrop has not materially changed, with Brazilian crop conditions still supportive and demand for orange juice concentrate still soft on a multi-month view. The longer-term chart shows a contract that has now logged a 32-percentage-point round trip in two weeks, which describes a structurally unstable price discovery rather than a directional advance. Systems holding short exposure into the prior week captured that move; systems aligned long this week captured this one. Both directions inside two weeks are consistent with the contract’s well-documented liquidity profile.
2. Crude Oil Brent +10.67 percent
Crude Oil Brent advanced 10.67%, the second-largest single-asset move of the week and the largest of the petroleum complex. Brent trades near 109.20, having now logged two consecutive weekly gains and pushed through to fresh multi-month highs. The drivers were the 6.2 million barrel U.S. crude inventory draw, continued SPR releases under the IEA-aligned response, the UAE’s announced withdrawal from OPEC and OPEC+ effective 1 May, and the continued effective closure of the Strait of Hormuz to commercial flows. The two-week cumulative move is now substantial: from below 90 two weeks ago to above 109 today. The chart structure has shifted from wide-range two-way trade to a clean upward channel, the cleanest directional structural change inside the petroleum complex this cycle.
3. Crude Oil WTI +7.99 percent
Crude Oil WTI advanced 7.99%, the third-largest single-asset move of the week and a continuation of last week’s reversal. The contract trades near 102.50, also at fresh multi-month highs. The drivers mirror Brent: the large U.S. inventory draw, the SPR release, the UAE’s departure from OPEC, and continued Hormuz tightness. WTI now trades above the 100 level for the first time in several months, a level that historically attracts physical demand-destruction commentary and short-cycle profit-taking. The cumulative two-week pattern is now a clean upward break rather than a round trip, which is the cleaner read for medium-term trend strategies on the long side.
4. Gasoline RBOB +7.75 percent
Gasoline RBOB advanced 7.75%, the fourth-largest single-asset move of the week. The contract trades near 3.61, having extended the prior week’s reversal. The driver is the same Hormuz channel that has lifted crude, expressed through the refined product crack, with the additional support of the start of the U.S. summer driving season. The cumulative two-week move is now constructive on a directional basis rather than the round-trip pattern that had characterised the petroleum complex through April. The chart structure now favours systems aligned long; the absolute level near multi-year highs warrants attention to short-cycle reversal risk.
Top Losers
1. VIX -5.58 percent
The VIX fell 5.58%, the largest single-asset decline of the week and a sharp reversal of the prior week’s first uptick in four weeks. The contract trades near 19.80. The decline is consistent with U.S. equity strength, European stabilisation, and the broader risk-on tape. Hedges that had been re-added during the prior week’s Hormuz disruption have been unwound as the geopolitical situation moved from acute crisis to ongoing stress without further escalation. The level back below 20 for the first time in three weeks is consistent with a normal equity-volatility regime, and the directional move resumes the short-volatility signal that had been interrupted last week.
2. Coffee -2.88 percent
Coffee moved 2.88% lower, the second-largest single-asset decline of the week and the lone material counter-direction print inside the otherwise broadly upward soft-commodity complex. The contract trades near 289.95, extending its multi-month downward structure. While Sugar, Cocoa, Cotton, and Orange Juice all turned cleanly upward this week, Coffee has held its directional read on the short side. Brazilian and Vietnamese crop conditions remain supportive of supply, and global demand has softened on cost-of-living pressures in major importing economies. The longer-term chart shows a contract still inside a clean downward structure, which makes Coffee the directional standout inside an otherwise reversed sector.
3. Gold -2.03 percent
Gold moved 2.03% lower, the third-largest single-asset decline of the week and the only metal still printing material weakness as the broader complex moderated. The contract trades near 4625.66, well below its December 2025 record but still inside a long-running upward structure on a multi-month view. The mechanism is unchanged from last week: rising Treasury yields and a more cautious read on near-term rate cuts continue to weigh on the precious complex, with Gold the most sensitive to those macro inputs. The corrective phase that began two weeks ago has not yet completed, and Gold’s relative weakness against Palladium and Silver this week suggests the rotation inside the complex is still in motion.
4. Copper -1.63 percent
Copper moved 1.63% lower, the fourth-largest single-asset decline of the week. The contract trades near 5.96 and remains inside its established multi-month range. The move sits inside the broader Metals consolidation, with Copper specifically exposed to global growth concerns as European industrial production data softened and Chinese reopening momentum showed signs of plateauing through the spring. The longer-term chart still favours the upward structure that has built through 2025 and into 2026, but the past two weeks have eaten into the prior gains. A third directional week in the same direction would shift the read; a single moderate week sits inside the broader consolidation pattern.
Portfolio View - Positioning and Impact
Long Energy exposure was the largest contributor for a second consecutive week, but with a significantly cleaner read on the underlying directional move. Brent +10.67%, WTI +7.99%, Gasoline RBOB +7.75%, Heating Oil +4.03%, Natural Gas +3.62%, Ethanol +2.07%. All six contracts moved upward in unison, the sector +6.02%. This is the first uniform-direction Energy week of the current cycle and converts the prior week’s spike-and-reverse pattern into a spike-and-extend pattern. Portfolios that maintained or rebuilt long Energy exposure through the whipsaw captured the move; portfolios that had trimmed or flipped to short on last week’s spike sit on the wrong side of an extending directional move.
Long Soft commodity exposure turned constructive after three weeks of detraction. Orange Juice +16.85%, Cotton +6.09%, Sugar +5.95%, Cocoa +4.81%, Lumber -1.26%, Coffee -2.88%. Four of six contracts moved meaningfully higher, with Orange Juice the standout reversal. Systems that had built short exposure across the complex through the prior weeks of weakness sat on the wrong side of the move; systems with thematic long exposure or quick to flip captured it. Coffee remains the structural short, with the contract still printing inside its multi-month downward structure.
Long Metals exposure detracted modestly at -0.57%, a much shallower second-week reading than the prior week’s -4.36%. Palladium +2.40%, Silver -0.66%, Platinum -0.91%, Copper -1.63%, Gold -2.03%. The breadth fractured rather than extending uniformly lower, with Palladium turning positive and the magnitudes moderating across the rest of the complex. Systems carrying full long exposure detracted modestly; the multi-month upward structure remains intact and the corrective phase has moderated.
Long majors against short USD reversed back to constructive. USD -0.36%, JPY +1.44%, AUD +0.82%, CAD +0.57%, CHF +0.46%, GBP +0.41%, NZD +0.39%, EUR +0.06%. Seven of eight currency contracts firmer against the USD, the inverse of last week’s breadth. Long Equity index exposure held a positive contribution at +0.39% with continued U.S. tech leadership and European stabilisation; the Nikkei 225 at -1.03% was the lone material laggard, with yen strength the proximate driver. Long Bonds detracted for a second consecutive week at -0.48% with all four contracts lower in unison. Long VIX gave back 5.58% on the renewed short-volatility signal.
Long Grains held a third consecutive positive contribution at +2.70%: Soybean Oil +5.37%, Oats +4.14%, Corn +3.61%, Wheat +3.40%, Canola +2.32%, Soybeans +2.10%, Rough Rice +0.58%, Soybean Meal +0.06%. All eight contracts ended higher, with seven up meaningfully, the broadest grain breadth in several weeks. Long Meats turned positive at +1.81%, with Live Cattle +3.17% and Feeder Cattle +2.87% reversing the prior two weeks of pressure and reasserting the multi-month upward structure. Lean Hogs at -0.61% continued the alternating-week pattern that has dominated that contract for the past month. Long Bitcoin added a quiet +0.97%, the contract drifting higher after two weeks of pause.
Final Reflections: The Cycle Reasserts Itself
The week ending 1 May 2026 resolved the question that the prior fortnight had left open. Energy went uniform-direction up rather than continuing to whipsaw, with all six contracts moving higher together for the first time in the current cycle. Soft commodities reversed sharply higher after three negative weeks, with Orange Juice the standout reversal. Metals consolidated rather than extended their decline, leaving the multi-month upward structure intact. The TTU Barometer recovered from 50% to 55%, reclaiming the Neutral/Strong threshold. The SG Trend Index closed April at +2.98% for the month and +10.27% year to date, both fresh 2026 highs and the first double-digit YTD reading of the year. April closed as the strongest single trend-following month of 2026 to date.
Three observations define the week:
1. The barometer has recovered to 55% and now sits exactly on the Neutral/Strong threshold.
The full sequence reads 48, 52, 55, 50, 55: a five-week round trip back to the boundary. The recovery from 50% to 55% in a single week is the largest upward print of the cycle and reflects the broader directional alignment across Energy, Softs, Grains, Meats, and Crypto, all of which moved in the same direction (up) for the first time in several weeks. The classification remains Strong but at the lowest level inside the band, with the headline number sitting on the threshold itself. The 10-day rate of change reads “Falling Weakly” for the third consecutive week, suggesting the deceleration that prompted caution two weeks ago has stabilised rather than fully resolved. The classification favours engagement; the level itself argues against aggressive scaling, since any further softening would slip the cycle back into Neutral territory.
2. Energy has converted from spike-and-reverse to spike-and-extend, a structurally meaningful change.
The petroleum complex has now logged two consecutive weekly gains, with all six contracts moving higher in the same direction this week for the first time in the current cycle. WTI has gone from below 90 two weeks ago to above 102 today, Brent from below 99 to above 109. The cumulative two-week move is substantial, and the chart structure has shifted from wide-range two-way trade to a clean upward channel. This is the cleanest directional structural change inside any commodity sector this cycle. Whether the move extends further from current levels or consolidates is the next question; the directional read is now firmly on the long side rather than the unstable two-way pattern of recent weeks. The supply-side backdrop combined a 6.2 million barrel U.S. crude inventory draw, continued SPR releases under the IEA-aligned response, the UAE’s announced departure from OPEC, and continued Hormuz tightness, with U.S. inventory draws confirming demand is supportive at current price levels.
3. Soft commodities reversed cleanly higher, opening fresh directional opportunities across most of the complex.
Orange Juice +16.85%, Cotton +6.09%, Sugar +5.95%, and Cocoa +4.81%. Four contracts moving more than 4.5% higher, Lumber edging modestly lower, and Coffee the lone material short-side print. The breadth has inverted from three weeks of negative readings to a single-week reversal across most of the sector. The drivers are contract-specific rather than thematic, but the directional alignment across most of the complex is the cleanest in some weeks. The Orange Juice move is the most arresting: a 32-percentage-point round trip in two weeks, primarily driven by the contract’s well-documented liquidity profile. The structural short-side read on Coffee remains intact; the longer-term downward structure has not been challenged. The other four contracts have all turned upward off recent base levels, with chart structures now showing the early stages of potential directional reversals.
This was the week the cycle reasserted itself. Energy converted from whipsaw to extend. Soft commodities reversed sharply higher across the broader sector. Metals consolidated rather than extended their correction. Bonds extended a second week of softness. The U.S. dollar gave back the prior week’s safe-haven bid. Equity indices held narrowly positive on continued U.S. leadership. The VIX gave back the prior week’s uptick. The barometer recovered to 55%, sitting exactly on the Neutral/Strong threshold. The SG Trend Index closed April at +2.98% for the month and +10.27% year to date, both fresh 2026 highs and the first double-digit YTD reading of the year. April closed as the strongest single trend-following month of 2026 to date. The cleaner directional patterns now sit in places that were unstable a week ago: long Brent, long WTI, long Gasoline, long Soybean Oil, long Wheat, long Live Cattle, long Cotton, short Coffee, and the renewed short-volatility signal.
One question defines the week ahead: does the Energy advance extend further from these levels, or does the petroleum complex consolidate as physical demand-destruction commentary builds at WTI above 100 and Brent above 109.

List of Resources used in the Week in Review
Important Disclaimers
This document is directly solely to Accredited Investors, Qualified Eligible Participants, Qualified Clients and Qualified Purchasers. No investment decision should be made until prospective investors have read the detailed information in the fund offering documents of any manager mentioned in this document. This document is furnished on a confidential basis only for the use of the recipient and only for discussion purposes and is subject to amendment This document is neither advice nor a recommendation to enter into any transaction. This document is not an offer to buy or sell, nor a solicitation of an offer to buy or sell, any security or other financial instrument. This presentation is based on information obtained from sources that TopTradersUnplugged (“TTU”) (“considers to be reliable however, TTU makes no representation as to, and accepts no responsibility or liability for, the accuracy or completeness of the information. TTU has not independently verified third party manager or benchmark information, does not represent it as accurate, true or complete, makes no warranty, express or implied regarding it and shall not be liable for any losses, damages, costs or expenses relating to its adequacy, accuracy, truth, completeness or use.
All projections, valuations, and statistical analyses are provided to assist the recipient in the evaluation of the matters described herein. Such projections, valuations and analyses may be based on subjective assessments and assumptions and may use one among many alternative methodologies that produce different results accordingly, such projections, valuations and statistical analyses should not be viewed as facts and should not be relied upon as an accurate prediction of future events. There is no guarantee that any targeted performance will be achieved Commodity trading involves substantial risk of loss and may not be suitable for everyone
TTU is not and does not purport to be an advisor as to legal, taxation, accounting, financial or regulatory matters in any jurisdiction. The recipient should independently evaluate and judge the matters referred to herein. TTU does not provide advice or recommendations regarding an investor’s decision to allocate to funds or accounts managed by any manager (“or to maintain or sell investments in funds or accounts managed by any manager, and no fiduciary relationship under ERISA is created by the investor investing in funds or accounts managed by any manager, or through any communication between TTU and the investor
In reviewing this document, it should be understood that the past performance results of any asset class, or any investment or trading program set forth herein, are not necessarily indicative of any future results that may be achieved in connection with any transaction. Any persons subscribing for an investment must be able to bear the risks involved and must meet the suitability requirements relating to such investment. Some or all alternative investment programs discussed herein may not be suitable for certain investors This document is directed only to persons having professional experience in matters relating to investments. Any investment or investment activity to which this document relates is available only to such investment professionals. Persons who do not have professional experience in matters relating to investments should not rely upon this document.
This document and its contents are proprietary information of TTU and may not be reproduced or otherwise disseminated in whole or in part without TTU’s prior written consent.
This document contains simulated or hypothetical performance results that have certain inherent limitations AND SHOULD BE VIEWED FOR ILLUSTRATIVE PURPOSES. Unlike the results shown in an actual performance record, these results do not represent actual trading. HYPOTHETICAL PERFORMANCE RESULTS HAVE MANY INHERENT LIMITATIONS, SOME OF WHICH ARE DESCRIBED BELOW. NO REPRESENTATION IS BEING MADE THAT ANY ACCOUNT WILL OR IS LIKELY TO ACHIEVE PROFITS OR LOSSES SIMILAR TO THOSE SHOWN IN FACT, THERE ARE FREQUENTLY SHARP DIFFERENCES BETWEEN HYPOTHETICAL PERFORMANCE RESULTS AND THE ACTUAL RESULTS SUBSEQUENTLY ACHIEVED BY ANY PARTICULAR INVESTMENT ACCOUNT.
ONE OF THE LIMITATIONS OF HYPOTHETICAL PERFORMANCE RESULTS IS THAT THEY ARE GENERALLY PREPARED WITH THE BENEFIT OF HINDSIGHT IN ADDITION, HYPOTHETICAL TRADING DOES NOT INVOLVE FINANCIAL RISK, AND NO HYPOTHETICAL TRADING RECORD CAN COMPLETELY ACCOUNT FOR THE IMPACT OF FINANCIAL RISK IN ACTUAL TRADING FOR EXAMPLE, THE ABILITY TO WITHSTAND LOSSES OR TO ADHERE TO A PARTICULAR TRADING PROGRAM OR OTHER ASSET.
There are numerous other factors related to the markets in general or to the implementation of any specific trading program which cannot be fully accounted for in the preparation of hypothetical performance results and all of which can adversely affect actual trading results. No representation is being made that any investment will or is likely to achieve profits or losses similar to those being shown.
Most Comprehensive Guide to the Best Investment Books of All Time

Most Comprehensive Guide to the Best Investment Books of All Time
Get the most comprehensive guide to over 600 of the BEST investment books, with insights, and learn from some of the wisest and most accomplished investors in the world. A collection of MUST READ books carefully selected for you. Get it now absolutely FREE!
Get Your FREE Guide HERE!