


Trend Following - Week in Review— May 15, 2026

“Energy Surges, Precious Metals Slump, and the Barometer Climbs Back to Strong at 57%”
This Week in Trend – 15 May 2026
Welcome to This Week in Trend, your weekly view into the evolving structure of global futures markets and the behaviour of systematic trend following. This edition covers conditions through the close of US markets on Friday, 15 May 2026.
Energy reversed sharply higher, the sector averaging +5.70% with five of six contracts moving higher in unison. WTI advanced 10.80%, Brent 7.87%, Natural Gas 7.36%, Gasoline RBOB 4.97%, and Heating Oil 3.96%. Ethanol at -0.78% was the lone counter-direction print. The rebound followed renewed geopolitical risk premium after President Trump returned from his summit with President Xi in China and signalled a tougher posture toward Iran. Reports indicated he had rejected a proposed framework aimed at de-escalating the conflict and told Fox News he was “losing patience” with Tehran. Brent settled near 109 and WTI near 105 by Friday after sharp intraday swings during the week. The petroleum complex recovered the prior week’s entire giveback and then some.
Equity indices averaged -1.19% with six of seven contracts lower. The Nikkei 225 fell 2.91%, the Russell 2000 lost 2.37%, the DAX 1.51%, the Euro Stoxx 50 1.21%, the Nasdaq 100 0.34%, and the DJIA 0.15%. The S&P 500 at +0.18% was the lone material positive print. The week marked Jerome Powell’s formal term expiring on 15 May, with the Fed appointing him chair pro tempore until Kevin Warsh, already confirmed by the Senate, is formally sworn in. April CPI printed at 3.8% year-over-year, exceeding consensus, and PPI logged its largest single-month spike since early 2022. CME FedWatch moved to near-zero probability of a 2026 rate cut, with markets beginning to price a chance of a December rate hike. Metals averaged -3.02% with all five contracts moving lower in unison for the first time in several weeks. Palladium fell 4.13%, Silver 4.10%, Gold 3.57%, and Platinum 3.28%. Copper at -0.02% was the lone non-participant. Soft commodities averaged -3.41%, the largest sector reversal in the current comparison, dragged by Orange Juice at -10.23%, Cotton -4.86%, and Cocoa -4.30%. Bonds extended weakness across the curve at -1.33%, with the long end leading the decline as the 30-year fell 2.59% and the 10-year 1.42%. The dollar advanced 1.46%, with all seven non-USD currencies lower against it.
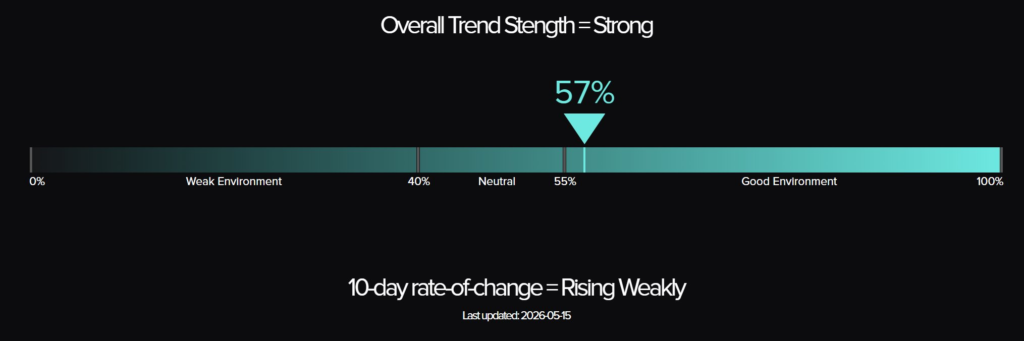
The TTU Trend Barometer recovered from 43% to 57%, a 14-point rebound and the largest single-week rise of the cycle, with the overall trend strength classification shifting from Neutral back to Strong. The 10-day rate of change reversed from “Falling Moderately” to “Rising Weakly”. The SG Trend Index reads +2.13% month to date and +12.48% year to date as of 15 May, after closing the prior week at -0.61% MTD and +9.47% YTD. The second week of May has added roughly 275 basis points to the headline figure and pushed the YTD reading back above the double-digit threshold.
For trend followers, the week reordered which directional reads carry conviction and shifted the cycle from Neutral back to Strong. Long Energy exposure recovered substantial ground in a single uniform-direction reversal back to the upside, with five of six contracts higher. Long Equity exposure gave back ground as the rate-cut narrative collapsed under the inflation surprise. Long Metals exposure took a clean setback as the dollar strengthened, real yields rose, and the precious complex absorbed the hawkish repricing. The barometer’s 14-point rebound with the rate of change reversing to “Rising Weakly” argues that the energy-led directional regime has returned with sufficient breadth and persistence to validate the Strong classification, with the leadership rotating back from financial assets to commodities inside a single week.
SG Trend Index Performance
Month to date (through 15 May): +2.13 percent
Year to date: +12.48 percent
Prior week reading (week ending 8 May 2026):
Prior week MTD: -0.61 percent
Year to date: +9.47 percent
The SG Trend Index reads +2.13% MTD and +12.48% YTD as of 15 May, after closing the prior week at -0.61% MTD and +9.47% YTD. The second week of May has added roughly 275 basis points to the headline figure and pushed the YTD reading back above the double-digit threshold. The mechanism is straightforward: the Energy reversal back to the upside rewarded retained or re-established long petroleum exposure, and the breadth of the upward move across five of six contracts produced a single-week contribution large enough to outweigh detractions from Equity, Metals, and Bonds.
The contributions inverted from the prior week. Long Energy exposure, which had been the largest negative contributor last week, was the largest positive contributor this week with five of six contracts moving higher in unison. Long Equity index exposure turned negative, with six of seven contracts lower and the rate-cut narrative collapsing under the inflation surprise from April CPI at 3.8% year-over-year and the PPI spike. Long Metals exposure took a clean setback, with all five contracts moving lower in unison as the dollar strengthened, real yields rose, and CME FedWatch shifted to near-zero probability of a 2026 cut. Long Soft commodity exposure detracted on the largest sector reversal in the current comparison, with Orange Juice -10.23%, Cotton -4.86%, and Cocoa -4.30% all reversing the prior week’s direction. Long Bonds detracted at -1.33% with the long end leading the curve sell-off. Short USD exposure detracted as the dollar advanced 1.46% with all seven counter-currencies lower.
The cycle has lifted back into Strong. The five-week barometer sequence now reads 55, 50, 55, 43, 57: a 14-point rebound in a single week that has converted the prior Neutral reading back into Strong territory. The composition of the week is the relevant context: leadership rotated back from financial assets to commodities inside a single week, with Energy moving from -3.72% to +5.70% and Metals from +2.29% to -3.02% in the largest sector-level pivot of the current comparison. Contract-level breadth thinned further on the headline count, with 15 of 49 contracts positive against 34 negative, but the directional alignment inside the Energy complex was uniform enough to drive the index higher. The barometer is calibrated to detect breadth and persistence, and the persistence of the Energy move alongside the clean directional alignment inside Metals and Softs was sufficient to register the largest single-week climb of the cycle.
TTU Trend Barometer
Current reading: 57 percent
Previous reading: 43 percent
10-day rate of change: Rising Weakly
The barometer rebounded from 43% to 57%, a 14-point recovery and the largest single-week rise of the cycle. The classification has shifted from Neutral back to Strong, with the headline level now sitting 2 points above the lower boundary of the Strong band. The five-week sequence reads 55, 50, 55, 43, 57: a pattern that traced the threshold three times in the prior month, dropped into Neutral for a single week, and has now reasserted the Strong reading. The 10-day rate of change has reversed from “Falling Moderately” last week to “Rising Weakly” this week, the deceleration of the prior three weeks now flipped into a renewed upward tilt.
The mechanism is the inverse of last week. Where the prior week featured Energy uniform-direction down, Equity-and-Metals leading the upside, and breadth thinning at the contract level, this week features Energy uniform-direction up, Equity-and-Metals reversing to the downside, and the leadership rotating back from financial assets to commodities. Contract-level breadth was the narrowest of the cycle at 15 of 49 positive against 34 negative, but the persistence and uniformity of the Energy move alongside the clean directional alignment inside Metals (five of five down) and Softs (four of six down, with two of the downside prints exceeding 4%) was sufficient to drive the barometer higher. Importantly, the barometer is not a measure of positive market breadth. It measures the share of markets generating medium-to-strong trends, whether those trends are rising or falling. Strong downside trends lift the barometer just as upside trends do. The directional cleanness across multiple sectors registered the 14-point rise even with the headline positive-return count thinned.
A 57% reading inside the Strong band argues for renewed engagement at this stage of the cycle. The classification favours fuller participation; the level itself sits 2 points above the Strong threshold, with the rate-of-change tilt now pointing further up rather than stabilising. The cycle was inside the Neutral band for one week before the Strong reading reasserted; a single further upward step would put the reading into more durable Strong territory. Whether the cycle consolidates above the threshold or slips back into Neutral turns on whether the Energy rebound extends into a multi-week move higher or stabilises here, whether the Equity weakness extends from the inflation-and-rates repricing or recovers, and whether the broad-based contract-level breadth widens or thins further. The reassertion of Strong suggests the breadth-and-persistence regime that had weakened last week has recovered rather than continued to soften.
The 10-day rate of change reversing from “Falling Moderately” to “Rising Weakly” is the relevant tilt: the deceleration of the prior three weeks has now flipped into a renewed upward bias. The headline level has broken back above the 55% threshold, and the rate of change suggests further extension rather than stabilisation. A reading that holds at or above 57% with a stabilising or improving rate of change over the next two weeks would consolidate the read inside Strong territory; a slip back below 55% with a Falling rate of change would convert the cycle from Strong back to Neutral. Either resolution sits ahead of the cycle, and the pattern over the next two weeks is the relevant evidence to monitor.
The Top Traders Unplugged (TTU) Trend Barometer is a proprietary tool that measures the percentage of markets with medium to strong trends. Similar to a thermometer, where 0 degrees Celsius equates to freezing, a TTU Trend Barometer reading below 40% indicates a “cold” environment for trend-following, while readings above 55% signal a “hotter,” more favorable trend environment.
Weekly Asset Class Snapshot
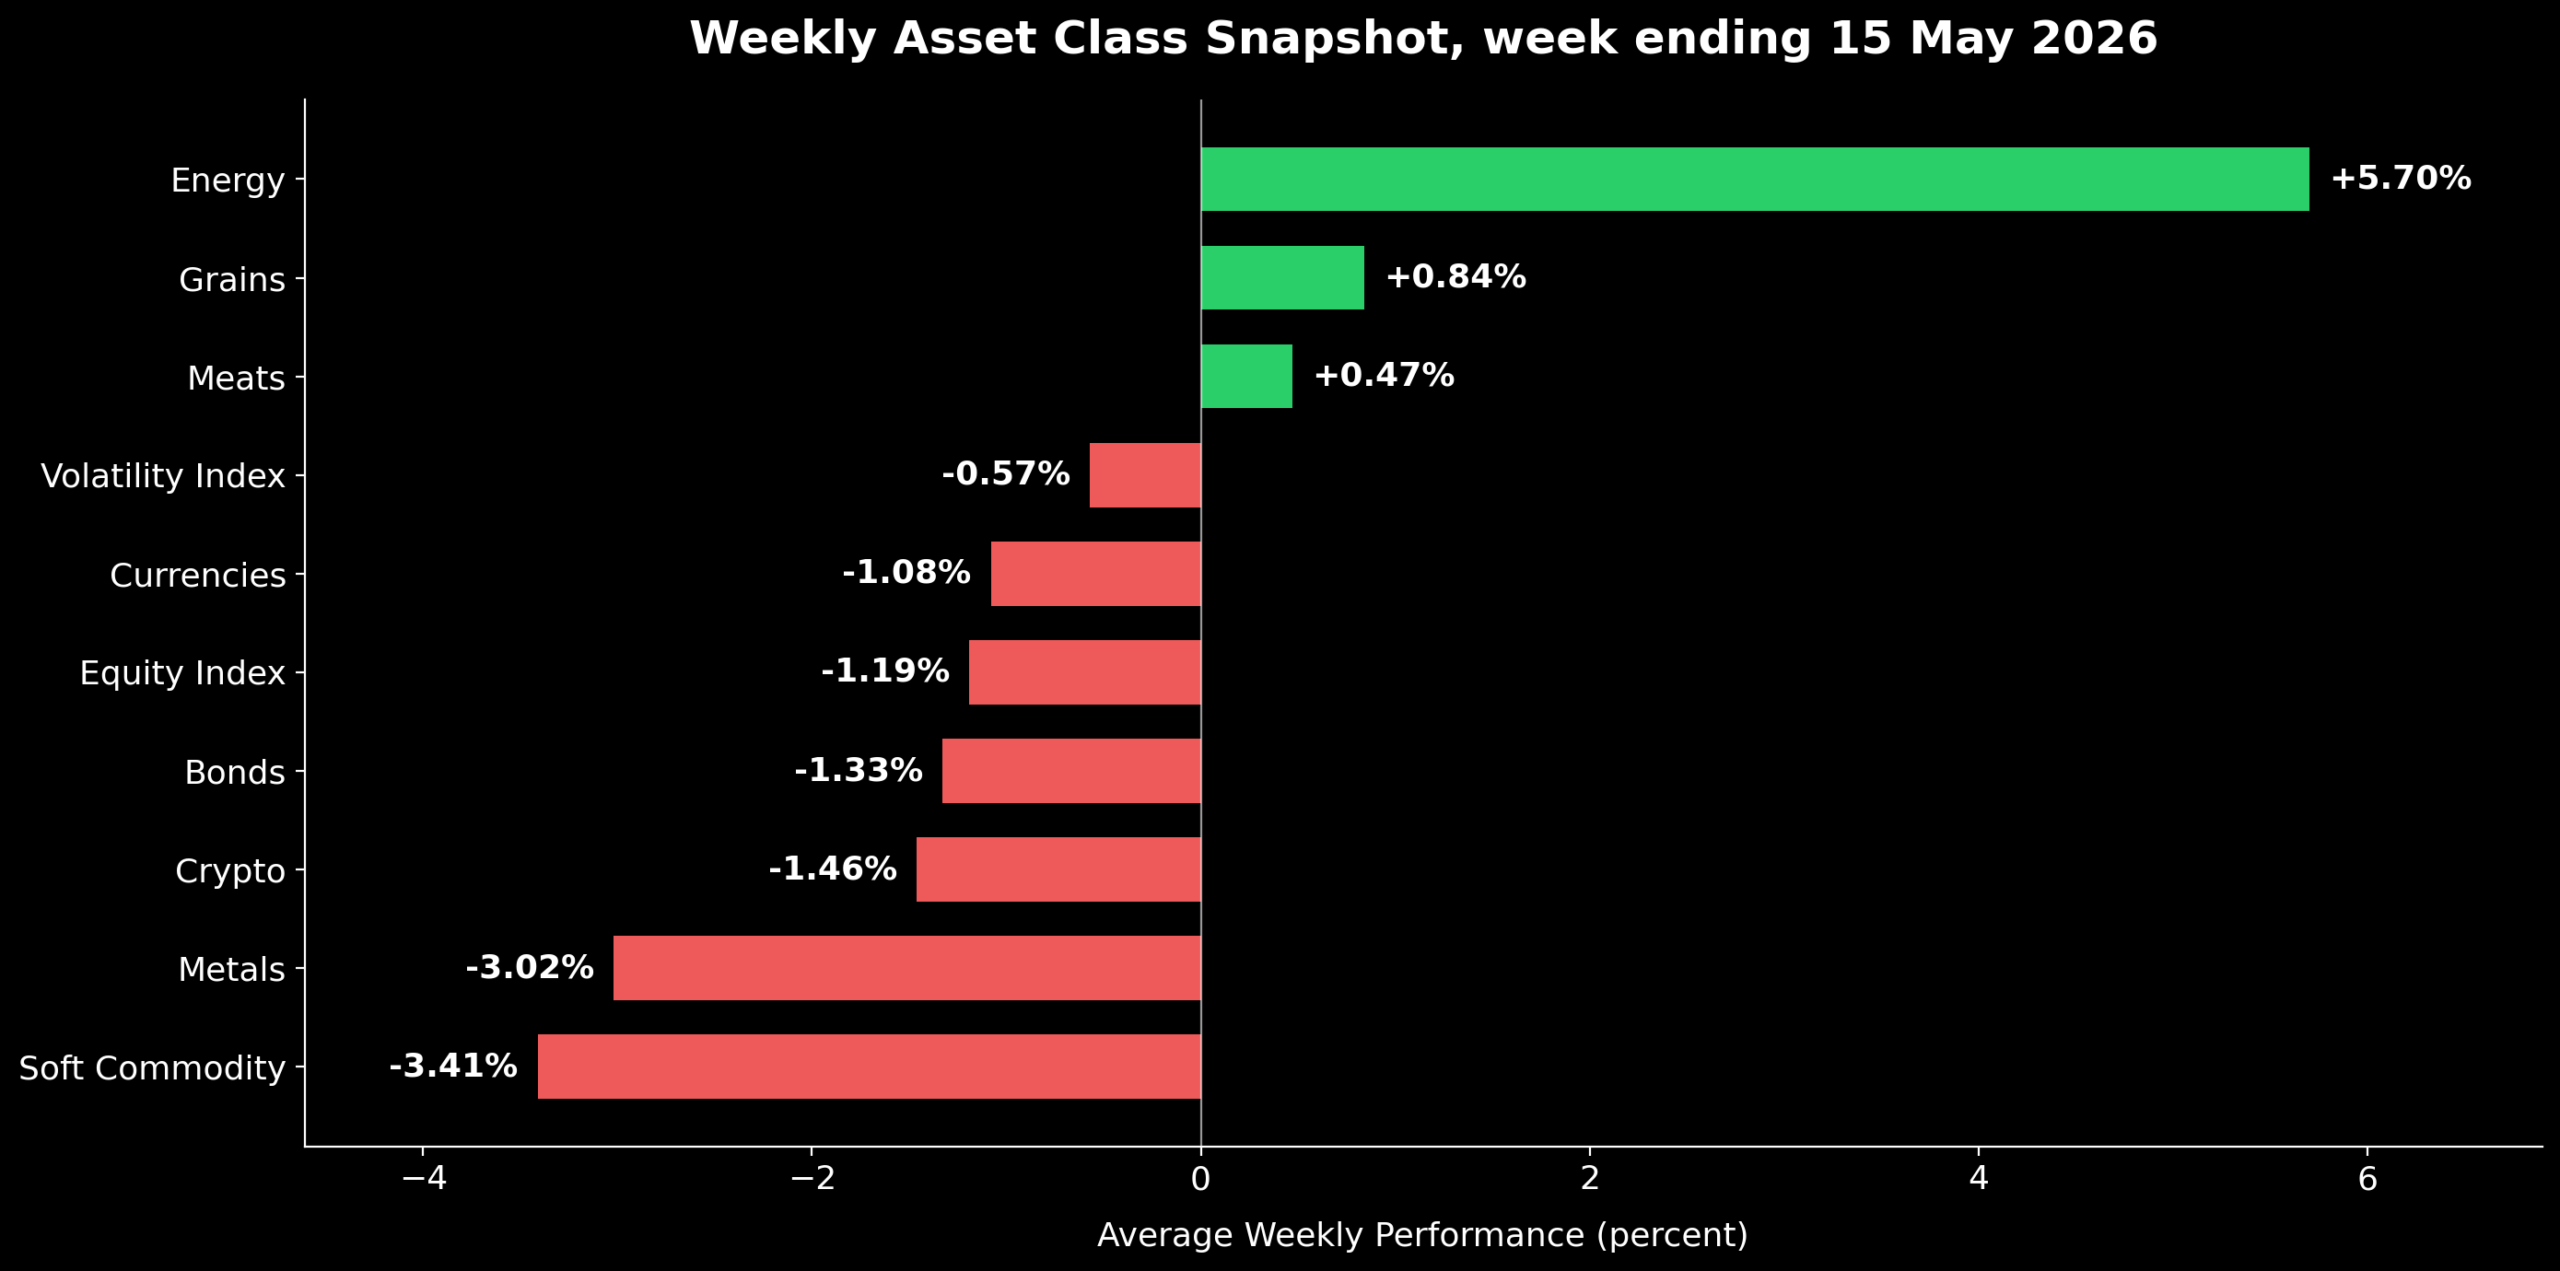
Source: Finviz.com
Energy (+5.70 percent | prev -3.72 percent)
Energy reversed sharply higher, the sector averaging +5.70% with five of six contracts moving higher. WTI advanced 10.80%, Brent 7.87%, Natural Gas 7.36%, Gasoline RBOB 4.97%, and Heating Oil 3.96%. Ethanol at -0.78% was the lone counter-direction print. The rebound was driven by renewed geopolitical risk premium around the Strait of Hormuz: President Trump returned from his summit with President Xi in China and signalled a tougher posture toward Iran. Reports indicated he had rejected a proposed framework aimed at de-escalating the conflict and told Fox News he was “losing patience” with Tehran. The CNBC report on 15 May noted Brent settled near 109 and WTI near 105 on Friday, with markets pricing the renewed escalation risk and a return of the supply-disruption premium that had unwound during the prior week’s diplomatic progress.
WTI prints near 101.16 and Brent near 109.47, both having recovered the prior week’s entire giveback and then some. Gasoline RBOB near 3.71 and Heating Oil near 4.04 have moved back to fresh recent highs. Natural Gas near 2.96 has reversed two consecutive weeks of weakness with a single decisive upward print. Ethanol near 1.92 was the lone non-participant, sitting inside its established range. The chart structure across the petroleum complex has reasserted the upward channel that broke down last week, with the prior week’s pullback now looking like a single-week correction inside a broader advance rather than a regime change. The IEA Oil Market Report released this week continued to flag that the conflict was disrupting roughly 14 million barrels per day of supply, and the rejected framework reopened the question of when, rather than whether, those volumes would return. The opportunity is now back on the long side with conviction, with the renewed escalation risk providing the catalyst the prior week’s diplomatic channel had removed.
Bonds (-1.33 percent | prev +0.13 percent)
Bonds sold off across the curve at -1.33% with all four contracts lower for the first time in several weeks. The 30-year Bond fell 2.59%, the 10-year Note dropped 1.42%, the 5-year Note declined 0.98%, and the 2-year Note slipped 0.33%. The long end led the sell-off, the inverse of the prior week’s recovery pattern. The mechanism was a hawkish repricing: April CPI printed at 3.8% year-over-year, exceeding consensus, and April PPI logged its largest single-month spike since early 2022. CME FedWatch moved to near-zero probability of any 2026 rate cut, with markets beginning to price a chance of a December rate hike. The 2-year Treasury yield climbed to a 14-month high. The combination of the inflation surprise, the hawkish Fed transition with Powell’s formal term expiring on 15 May and the Fed appointing him chair pro tempore until Kevin Warsh is sworn in, and the energy-driven inflation impulse pressured duration across the curve.
The 30-year sits near 110.72, the 10-year near 109.19, the 5-year near 106.81, and the 2-year near 103.21. The complex has logged a clean directional alignment across the curve, with the long end registering the steepest decline and the front end the most resilient, consistent with a duration-led repricing on the inflation surprise rather than a curve-shape shift. The read across the complex is now firmly on the short side, with the multi-month consolidation pattern broken to the downside and the curve resetting to a higher real-yield regime. A second consecutive negative week with similar magnitude would convert the read into a sustained downward bias; a single modest reversal sits inside the broader correction pattern.
Soft Commodity (-3.41 percent | prev +1.19 percent)
Soft commodities averaged -3.41%, the largest sector reversal in the current comparison, with four of six contracts lower. Orange Juice fell 10.23%, the largest single-asset move of the week in either direction. Cotton declined 4.86%, Cocoa 4.30%, and Coffee 2.87%. Lumber at +1.03% and Sugar at +0.75% were the only positive prints. The Orange Juice move was the standout: the contract has been unwinding from its 2024 weather-driven highs through the past several months, and the prior week’s +16.85% counter-trend bounce has now been fully retraced and exceeded. Trading Economics reported OJ trading near 172, with the contract down approximately 50% on a year-to-date basis. Cotton extended a downward move with the broader risk-off tape weighing on cyclical commodities. Cocoa reversed sharply lower after the prior week’s +16.30% short-covering rally, with profit-taking on the record fund repositioning and a partial reassessment of the West African crop concerns. Coffee continued its multi-month downward structure with another negative print.
Orange Juice near 170.05 has resumed its multi-month downward structure with one of the largest single-week declines in the contract’s recent history. Cotton near 80.33 has rolled over from the prior week’s break-out highs. Cocoa near 4030 has given back substantial ground from the prior week’s 4241 reclaim. Coffee near 265.75 sits at multi-week lows and continues its multi-month downward structure. Lumber near 588 has held the upper end of its established range. Sugar near 14.78 has paused its slow downward drift with a modest positive print. The sector-internal alignment has flipped from last week’s bifurcated picture into a clean downside read for four of six contracts, with the OJ unwind and the Cotton-Cocoa-Coffee declines producing the largest sector-level move on the short side in the current comparison.
Metals (-3.02 percent | prev +2.29 percent)
Metals averaged -3.02% with all five contracts moving lower in unison for the first time in several weeks. Palladium fell 4.13%, Silver 4.10%, Gold 3.57%, and Platinum 3.28%. Copper at -0.02% was the lone non-participant. The mechanism was a hawkish-Fed-driven setback across the complex: April CPI surprised to the upside at 3.8% year-over-year, the PPI spike compounded the read, CME FedWatch shifted to near-zero probability of a 2026 cut, and the 2-year yield climbed to a 14-month high. The dollar advanced 1.46%, the largest single-week DXY-style move of the cycle, and real yields rose alongside. The combination drained the precious complex of its rate-and-currency tailwinds and pulled Silver and Platinum lower despite their industrial demand stories.
Gold near 4543.60 has slipped to its lowest level since March, with the contract down approximately 5% across the past four weeks and now sitting about 18% below the January 2026 all-time high. Silver near 76.30 has given back the prior week’s gains and dropped back below the 80 threshold. Platinum near 1985.20 has slipped back below 2000. Palladium near 1429 has extended its multi-month downward drift, with UBS reportedly cutting its long-term price forecast from $1,800 to $1,600 per ounce on supply-overhang concerns. Copper near 6.29 was the lone non-participant, holding the upper end of its multi-month range as the industrial demand read held even as the rest of the complex retreated. The read inside the complex has reversed from last week’s broad upward alignment to a clean downside read for four of five contracts, with the inflation-and-rates repricing producing the largest single-week metals reversal in the current cycle.
Meats (+0.47 percent | prev -2.13 percent)
Meats firmed to +0.47% with two of three contracts higher. Live Cattle advanced 2.04% and Lean Hogs added 0.13%. Feeder Cattle at -0.76% was the lone counter-direction print. The prior week’s reversal in the cattle complex did not extend, and the multi-month upward structure in Live Cattle has reasserted with a single-week recovery from last week’s setback. Lean Hogs continued the alternating-week pattern that has dominated the contract for the past several weeks, with a modest positive print after last week’s sharper decline.
Live Cattle near 248.03 has recovered the prior week’s setback and is sitting near multi-week highs. Feeder Cattle near 361.28 has paused, with the broader upward structure intact but the past two weeks producing a sideways read. Lean Hogs near 98.75 has continued its volatile chop inside an established range. The cattle complex now offers a cleaner upward read: Live Cattle has reasserted its multi-month structure with a single decisive recovery, and the broader meats picture has stabilised after last week’s synchronised setback. The clearest read is in Live Cattle on the long side; Feeder Cattle and Lean Hogs remain contract-specific rather than thematic.
Grains (+0.84 percent | prev +0.17 percent)
Grains held a fifth consecutive positive sector reading at +0.84%, with the internal split widening. Soybean Meal advanced 4.57%, Oats 4.53%, Rough Rice 3.37%, and Wheat 2.71%. Soybean Oil fell 0.59%, Canola 1.99%, Soybeans 2.57%, and Corn 3.29%. Four contracts moved higher, four moved lower. The sector-internal alignment has bifurcated, with the protein-and-grain pocket holding the upside while the vegetable oil pocket and Corn rolled over. The drivers were mixed: Soybean Meal and Oats on continued tighter supply reads, Rough Rice extending its prior-week single-contract break, Wheat picking up on US export and global supply concerns. Soybeans and Corn unwound on improving US planting conditions and seasonal weakness; Canola tracked Soybean Oil on the vegetable oil pause.
Soybean Meal near 334.10 has broken decisively higher, extending the prior weeks’ gains and now sitting at multi-month highs. Oats near 362.75 has logged a sharp upward print and reclaimed levels last seen in March. Rough Rice near 12.57 has extended the prior week’s break and confirmed the reversal off recent base levels. Wheat near 635.50 has picked up a second consecutive positive print after the prior week’s pause. Soybeans near 1177.25 has slipped back below 1200 and lost the prior weeks’ momentum. Corn near 455.25 has reversed sharply lower, breaking down from the prior week’s consolidation. Soybean Oil near 73.76 has paused, and Canola near 738.30 has slipped back from recent highs. The sector-internal alignment is bifurcated: the protein-feed-grain pocket on the long side, the oilseed-and-Corn pocket on the short side. The contract-by-contract read favours selectivity, with Soybean Meal and Oats the clearest structural breakouts.
Equity Index (-1.19 percent | prev +2.46 percent)
Equity indices reversed to -1.19% with six of seven contracts lower. The Nikkei 225 fell 2.91%, the Russell 2000 declined 2.37%, the DAX dropped 1.51%, the Euro Stoxx 50 lost 1.21%, the Nasdaq 100 slipped 0.34%, and the DJIA edged down 0.15%. The S&P 500 at +0.18% was the lone material positive print, sitting essentially flat after touching record territory earlier in the week. The drivers combined an inflation surprise from April CPI at 3.8% year-over-year and the PPI spike, the hawkish Fed transition with Powell’s formal term expiring on 15 May and the Fed appointing him chair pro tempore until Kevin Warsh is sworn in, the rejection of the Iran de-escalation framework that drove oil sharply higher, and the resulting selling pressure across rate-sensitive technology, manufacturing, transport, and consumer discretionary stocks. The Dow slipped more than 380 points on Friday on the renewed geopolitical and inflation read. The market concentration concern previously discussed extended into the week as the AI-driven leadership pattern of the prior weeks paused.
The S&P 500 near 7418 has held just below recent record territory after touching above 7500 earlier in the week. The Nasdaq 100 near 29173 has paused its multi-month leadership pattern. The DJIA near 49485 has slipped back below 50000. The Russell 2000 near 2792 has rolled over more sharply, consistent with the rate-sensitivity of small-caps to the hawkish repricing. The Nikkei 225 near 61840 has given back substantial ground from the prior week’s catch-up break, the Euro Stoxx 50 near 5799 has slipped back below 5800, and the DAX near 23910 has fallen sharply. The read across most of the complex has shifted from clean upward to consolidating-or-correcting, with the largest single-week giveback in the Nikkei after the prior week’s outsized advance and the Russell 2000 on rate sensitivity. The multi-month upward structures across the major US indices remain intact, but the prior weeks’ AI-themed leadership has paused under the inflation-and-rates repricing.
Currencies (-1.08 percent | prev +0.22 percent)
The dollar advanced 1.46% on the week, while the seven non-USD currencies averaged -1.45%. Including the dollar, the currency complex averaged -1.08%. GBP fell 2.22%, NZD declined 2.01%, EUR dropped 1.37%, CHF lost 1.40%, JPY 1.33%, AUD 1.23%, and CAD 0.57%. All seven counter-currencies moved lower in unison for the first time in several weeks. The mechanism was a clean hawkish-Fed-and-yields repricing: April CPI surprised higher at 3.8% year-over-year, the PPI spike compounded the read, CME FedWatch shifted to near-zero probability of a 2026 cut, and the 2-year yield climbed to a 14-month high. The dollar caught a renewed bid as Treasury yields rose across the curve, and the broader risk-off tape from the equity correction reinforced the move. CAD was the most resilient counter-currency, helped by the rebound in crude oil offsetting the broader dollar strength.
The USD near 99.20 has broken back above the recent range and reversed the prior weeks’ downward bias. EUR near 1.1642 has slipped back into the prior consolidation, GBP near 1.3324 has given back the prior week’s firmer levels, and CHF near 1.2749 has eased back from its recent safe-haven bid. The commodity-linked complex split modestly: CAD near 0.7281 held firmer than the broader complex on the crude rebound, while AUD near 0.7143 and NZD near 0.5845 rolled over on the risk-off tape. JPY near 0.6315 slipped lower as Treasury yields rose, the rate-differential argument re-asserting. The read across the complex has shifted from the prior weak-dollar regime to a renewed strong-dollar one, with internal differentiation between CAD on the firmer side and GBP and NZD on the softer side.
Volatility Index (-0.57 percent | prev -2.42 percent)
The VIX fell 0.57%, the third consecutive declining week despite the equity weakness. The contract trades near 19.25, still firmly below the 20 threshold. The modest decline alongside the equity correction is the notable feature: the equity sell-off this week did not produce a material pickup in implied volatility, with the term structure remaining well-anchored and the headline level pressing slowly lower despite the inflation surprise, the rejected Iran framework, and the renewed geopolitical risk. The level near 19 sits inside a normal equity-volatility regime.
The three consecutive declining weeks confirm the read despite this week’s equity setback. The pattern suggests options markets are not pricing the inflation-and-rates risk or the renewed geopolitical risk as a sustained volatility regime, with the move in oil, bonds, metals, and currencies absorbed into directional positioning rather than into implied volatility. The short-volatility signal that has operated through the prior weeks remains in place, and the level sits comfortably inside the normal range. A pickup back above 20 with broader risk-off reinforcement would shift the read; the current pattern reads as a clean continuation on the short side.
Crypto (-1.46 percent | prev +2.04 percent)
Bitcoin fell 1.46%, reversing the prior two weeks’ modest upward turn. The contract trades near 79165. The decline was consistent with the broader risk-off tape: equities lower, dollar firmer, and bonds and precious metals selling off. There was no specific crypto-side catalyst; the contract’s behaviour now mirrors the equity-and-risk complex more closely than it has in recent weeks, with the renewed inflation-and-rates repricing pulling Bitcoin lower alongside.
The chart structure has paused. The prior two weeks’ modest upward break has been given back, with the contract now slipping back below 80000. The longer-term picture remains a downward drift from the January 2026 highs near 120000, and the contract is now down approximately 35% from those levels. The opportunity is now ambiguous: the multi-week trend remains down, the immediate-week move is down, but the contract sits inside an established range above 70000 that has held through the past several months of volatility. A further move below 75000 would compromise the established range; a recovery back above 85000 would re-establish the prior weeks’ upward attempt.
Performance Highlights – This Week’s Market Leaders & Laggards
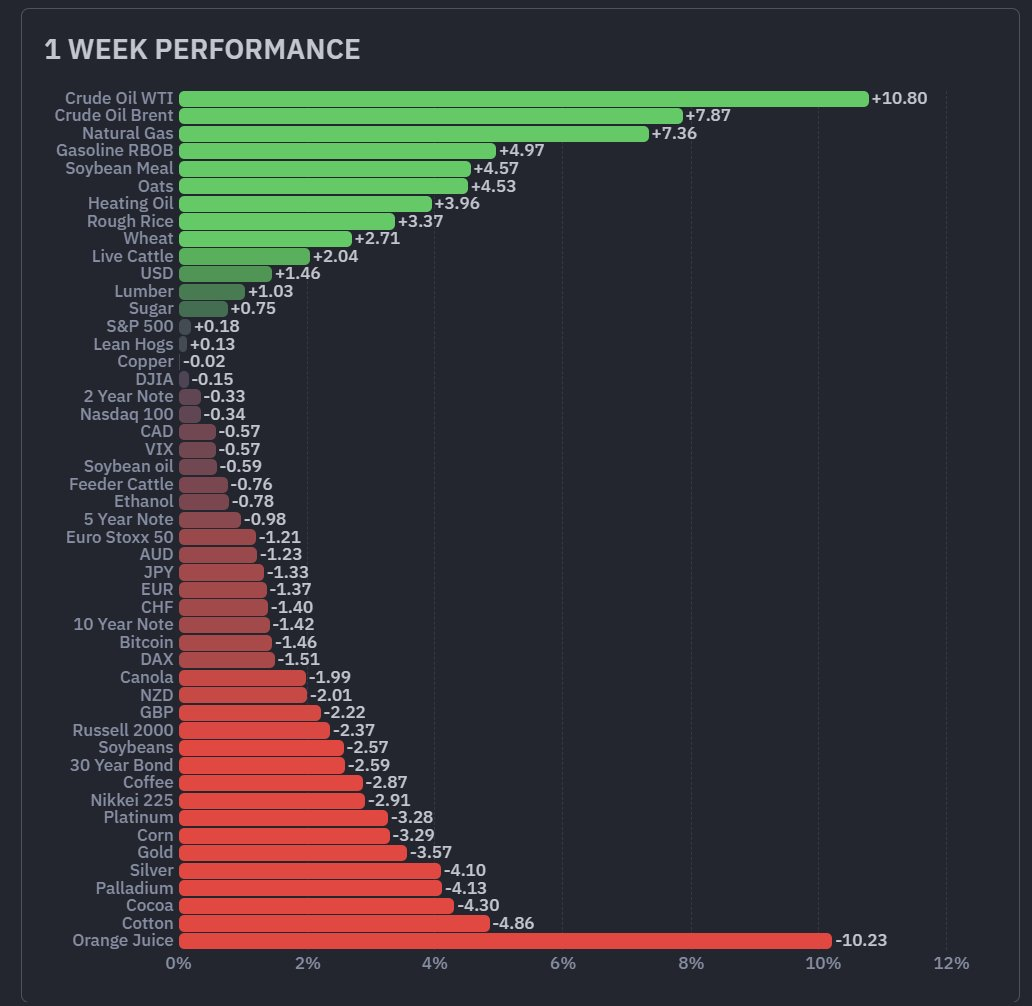
Source: Finviz.com
Top Market Movers
Top Gainers
1. Crude Oil WTI +10.80 percent
Crude Oil WTI advanced 10.80%, the largest single-asset move of the week in either direction and the largest upward print across the 49-contract universe. The contract trades near 101.16, reclaiming the 100 threshold for the first time since the prior week’s reversal. The driver was renewed geopolitical risk premium around the Strait of Hormuz: President Trump returned from his summit with President Xi in China and rejected a proposed framework aimed at de-escalating the Iran conflict. He told Fox News he was “losing patience” with Tehran and was prepared to consider further action. The market repriced the supply-disruption premium that had unwound during the prior week’s diplomatic progress. The IEA Oil Market Report continued to flag the conflict was disrupting roughly 14 million barrels per day of supply, with global oil supply having declined 1.8 mb/d in April to 95.1 mb/d. The single-week move has reasserted the upward channel that broke down last week.
2. Crude Oil Brent +7.87 percent
Crude Oil Brent advanced 7.87%, the second-largest single-asset move of the week. The contract trades near 109.47, having recovered the prior week’s decline and pushed back above 109 for the first time in two weeks. The drivers mirror WTI: the rejection of the Iran de-escalation framework, the renewed geopolitical risk premium, and the broader recognition that the supply-disruption premium that had unwound last week was being repriced higher. The IEA flagged that output from Gulf countries affected by the closure of the Strait of Hormuz remained 14.4 mb/d below capacity. The chart structure has reasserted the upward channel that broke down last week, with the prior week’s pullback now looking like a single-week correction.
3. Natural Gas +7.36 percent
Natural Gas advanced 7.36%, the third-largest single-asset move of the week. The contract trades near 2.96, having reversed two consecutive weeks of weakness with a single decisive upward print. The driver combined the broader Energy complex strength on the Iran headlines and the renewed read that global LNG flows remained vulnerable to the Hormuz disruption, with Asian demand for non-Hormuz cargoes underpinning the rebound. The move has lifted the contract back into the upper half of its recent range and confirms the broader Energy sector’s upward reassertion.
4. Gasoline RBOB +4.97 percent
Gasoline RBOB advanced 4.97%, the fourth-largest single-asset move of the week. The contract trades near 3.71, reclaiming fresh recent highs alongside the broader petroleum complex. The move tracked the WTI and Brent rebound, with the inflation impulse from higher gasoline prices feeding back into the broader inflation surprise that drove the bond curve sell-off and the precious metals decline. The contract has now logged a clean upward print after the prior week’s broader Energy giveback, with the recent uptrend reasserted.
Top Losers
1. Orange Juice -10.23 percent
Orange Juice fell 10.23%, the largest single-asset decline of the week and the inverse of WTI almost mirror-symmetrically. The contract trades near 170.05, down approximately 50% on a year-to-date basis according to Trading Economics. The driver was a continuation of the multi-month unwind from the 2024 weather-driven highs, with the prior week’s +16.85% counter-trend bounce now fully retraced and exceeded. The behaviour reads as classic exhaustion of a counter-trend rally: a sharp single-week reversal up, followed by a sharper single-week move down resuming the multi-month downward structure. The chart shows a contract well inside its established downward trend, with the recent attempt to break higher decisively rejected.
2. Cotton -4.86 percent
Cotton fell 4.86%, the second-largest single-asset decline of the week. The contract trades near 80.33, rolling over from the prior week’s break-out highs. The driver combined the broader risk-off tape pressuring cyclical commodities, the stronger dollar reducing import demand from cost-sensitive importers, and a recalibration of the prior week’s weather-driven advance. The chart structure shows the contract giving back the largest single-week of the prior month, with the multi-week upward bias paused and the read shifting toward sideways or downward from here.
3. Cocoa -4.30 percent
Cocoa fell 4.30%, the third-largest single-asset decline of the week and a reversal of the prior week’s +16.30% short-covering rally. The contract trades near 4030, having given back substantial ground from the prior week’s 4241 reclaim. The driver was profit-taking on the record fund repositioning combined with a partial reassessment of the West African crop concerns that had driven the prior week’s surge. The chart structure shows the contract still holding above the prior multi-month base levels, but the largest single-week upward print of the current cycle has now been partially given back. The reversal reads as a fund-positioning unwind rather than a fundamental shift, with the broader 2026/27 surplus revision still in place.
4. Palladium -4.13 percent
Palladium fell 4.13%, the fourth-largest single-asset decline of the week. The contract trades near 1429, extending its multi-month downward drift. The driver combined the broader Metals complex setback on the hawkish Fed repricing and a specific supply-overhang read: UBS was reported to have cut its long-term price forecast for the metal from $1,800 to $1,600 per ounce. The chart structure shows the contract pressing back toward the lower end of its established range, with the multi-month downward bias intact and the inflation-and-rates repricing reinforcing the read.
Portfolio View - Positioning and Impact
Long Energy exposure was the largest contributor for the week, reversing the prior week’s setback. WTI +10.80%, Brent +7.87%, Natural Gas +7.36%, Gasoline RBOB +4.97%, Heating Oil +3.96%, Ethanol -0.78%. Five of six contracts moved higher in unison, the clearest single-week directional alignment in the complex of the current cycle. Portfolios that had held long Energy exposure through the prior week’s pullback recovered the full giveback and added; portfolios that had trimmed at the prior week’s reversal missed substantial upside. Systems aligned short detracted materially on the unison reversal.
Long Equity index exposure was a material detractor, with six of seven contracts lower. Nikkei 225 -2.91%, Russell 2000 -2.37%, DAX -1.51%, Euro Stoxx 50 -1.21%, Nasdaq 100 -0.34%, DJIA -0.15%, S&P 500 +0.18%. The breadth on the downside was broad and the directional alignment clean. The prior week’s AI-themed leadership pattern paused under the inflation-and-rates repricing, with the Nikkei’s catch-up giveback the largest single-contract decline in the complex.
Long Metals exposure detracted cleanly. Palladium -4.13%, Silver -4.10%, Gold -3.57%, Platinum -3.28%, Copper -0.02%. Four of five contracts lower with material magnitude, Copper the lone non-participant. The hawkish-Fed repricing on the inflation surprise pulled the precious complex lower despite firm physical demand reads, with Silver and Platinum’s industrial demand stories not enough to offset the broader rate-and-currency setback.
Long Soft commodity exposure produced a sector-negative and contract-bifurcated read. Orange Juice -10.23%, Cotton -4.86%, Cocoa -4.30%, Coffee -2.87%, Sugar +0.75%, Lumber +1.03%. Four contracts ended negative with material magnitude, two ended positive with modest magnitude. Systems holding diversified long exposure across the complex took a clean setback; systems aligned with the multi-month Orange Juice and Coffee downward structures captured the most directly aligned contributions on the short side.
Long Bonds detracted at -1.33% with all four contracts lower on the curve sell-off. Long Bitcoin detracted at -1.46% as the broader risk-off tape pulled the contract lower. Short USD against majors took a clean setback with the dollar at +1.46% and all seven counter-currencies lower; systems aligned long dollar against the basket captured the move. Long Grains held a fifth positive print at +0.84% but with the internal split widening: four contracts higher, four lower. Long Meats firmed to +0.47% with the Live Cattle structure reasserting. Long VIX detracted at -0.57% as the short-volatility signal extended despite the equity weakness.
Final Reflections: Leadership Rotates Back to Energy as the Barometer Climbs to Strong
The week ending 15 May 2026 reordered which directional reads carry conviction and shifted the cycle from Neutral back to Strong. Energy reversed sharply higher with five of six contracts moving in the same direction up, the clearest single-week directional alignment in the complex of the current cycle, after President Trump returned from his summit with President Xi in China and rejected a proposed framework aimed at de-escalating the Iran conflict. The hawkish Fed transition was the broader regime signal: April CPI printed at 3.8% year-over-year, PPI logged its largest single-month spike since early 2022, CME FedWatch shifted to near-zero probability of a 2026 rate cut, Powell’s formal term expired on 15 May with the Fed appointing him chair pro tempore until Kevin Warsh is sworn in, and Warsh had already been confirmed by the Senate as the hawkish successor. The 2-year Treasury yield climbed to a 14-month high. Equity indices reversed to -1.19% with six of seven contracts lower, Metals reversed to -3.02% with all five contracts lower in unison, Bonds sold off across the curve at -1.33%, and the dollar advanced 1.46% with all seven counter-currencies lower. The TTU Barometer climbed from 43% to 57%, a 14-point rebound and the largest single-week rise of the cycle, with the classification shifting from Neutral to Strong and the rate of change reversing from “Falling Moderately” to “Rising Weakly”. The SG Trend Index now reads +2.13% MTD and +12.48% YTD, having added roughly 275 basis points to the headline figure and pushed the YTD reading back above the double-digit threshold.
Three observations define the week:
1. The barometer has climbed from 43% to 57%, the largest single-week rebound of the cycle and a return to Strong territory.
The five-week sequence reads 55, 50, 55, 43, 57: three weeks of consolidation around the threshold, one week into Neutral, and now a clean move back into Strong. The classification has shifted from Neutral to Strong, and the 10-day rate of change has reversed from “Falling Moderately” last week to “Rising Weakly” this week. The classification favours fuller participation; the level itself sits 2 points above the Strong threshold, with the rate-of-change tilt now pointing further up rather than stabilising. The 40% boundary into Weak-environment territory now sits 17 points below the current reading. The next two weeks of evidence will determine whether the cycle consolidates inside Strong or slips back into Neutral.
2. Energy has converted from spike-and-reverse back to spike-and-extend, with five of six contracts up in unison on the Iran posture shift.
The petroleum complex recovered the prior week’s entire giveback and then some, with five of six contracts moving higher in unison. WTI has gone from near 95 last week back to near 101, Brent from near 100 back to near 109, Natural Gas from near 2.75 back to near 2.96. The drivers were geopolitical: President Trump returned from his summit with President Xi in China and rejected a proposed framework aimed at de-escalating the Iran conflict, telling Fox News he was “losing patience” with Tehran. The IEA Oil Market Report continued to flag the conflict was disrupting roughly 14 million barrels per day of supply, with output from Gulf countries affected by the closure of the Strait of Hormuz remaining 14.4 mb/d below capacity. The market repriced the supply-disruption premium that had unwound during the prior week’s diplomatic progress. The opportunity is now back on the long side with conviction, with the renewed escalation risk providing the catalyst the prior week’s diplomatic channel had removed.
3. The hawkish Fed transition is the broader regime signal, with the inflation surprise and the rates repricing producing clean cross-asset directional alignment.
April CPI printed at 3.8% year-over-year, exceeding consensus on both monthly and annual measures, and April PPI logged its largest single-month spike since early 2022. CME FedWatch moved to near-zero probability of any 2026 rate cut, with markets pricing a chance of a December rate hike. The 2-year Treasury yield climbed to a 14-month high, the dollar advanced 1.46% against all seven counter-currencies, Bonds sold off across the curve at -1.33%, Metals fell -3.02% with all five contracts lower in unison, and Equity indices declined -1.19% with six of seven contracts lower. The week marked Powell’s formal term expiring on 15 May, with the Fed appointing him chair pro tempore until Kevin Warsh, already confirmed by the Senate as the hawkish successor, is sworn in. The combined directional alignment across rates, dollar, metals, bonds, equities, and energy gives systematic trend followers an unusually clean cross-asset read after the prior fortnight’s regime ambiguity. Contract-level breadth thinned to 15 of 49 positive against 34 negative, the narrowest of the cycle, but the cleanness of the directional alignment across the major regime-defining sectors registered as the largest single-week barometer rise of the cycle.
For trend followers, the week was not defined by whether markets rose or fell. It was defined by whether the moves were persistent enough to be captured. The opportunity was directional, but not directionally biased.
One question defines the week ahead: Does the hawkish Fed repricing and the renewed Iran posture extend the Energy and dollar moves into a multi-week regime, or do the prior weeks’ AI-themed equity leadership and the precious complex reassert as the inflation surprise fades from the front of the news cycle?

List of Resources used in the Week in Review
Important Disclaimers
This document is directly solely to Accredited Investors, Qualified Eligible Participants, Qualified Clients and Qualified Purchasers. No investment decision should be made until prospective investors have read the detailed information in the fund offering documents of any manager mentioned in this document. This document is furnished on a confidential basis only for the use of the recipient and only for discussion purposes and is subject to amendment This document is neither advice nor a recommendation to enter into any transaction. This document is not an offer to buy or sell, nor a solicitation of an offer to buy or sell, any security or other financial instrument. This presentation is based on information obtained from sources that TopTradersUnplugged (“TTU”) (“considers to be reliable however, TTU makes no representation as to, and accepts no responsibility or liability for, the accuracy or completeness of the information. TTU has not independently verified third party manager or benchmark information, does not represent it as accurate, true or complete, makes no warranty, express or implied regarding it and shall not be liable for any losses, damages, costs or expenses relating to its adequacy, accuracy, truth, completeness or use.
All projections, valuations, and statistical analyses are provided to assist the recipient in the evaluation of the matters described herein. Such projections, valuations and analyses may be based on subjective assessments and assumptions and may use one among many alternative methodologies that produce different results accordingly, such projections, valuations and statistical analyses should not be viewed as facts and should not be relied upon as an accurate prediction of future events. There is no guarantee that any targeted performance will be achieved Commodity trading involves substantial risk of loss and may not be suitable for everyone
TTU is not and does not purport to be an advisor as to legal, taxation, accounting, financial or regulatory matters in any jurisdiction. The recipient should independently evaluate and judge the matters referred to herein. TTU does not provide advice or recommendations regarding an investor’s decision to allocate to funds or accounts managed by any manager (“or to maintain or sell investments in funds or accounts managed by any manager, and no fiduciary relationship under ERISA is created by the investor investing in funds or accounts managed by any manager, or through any communication between TTU and the investor
In reviewing this document, it should be understood that the past performance results of any asset class, or any investment or trading program set forth herein, are not necessarily indicative of any future results that may be achieved in connection with any transaction. Any persons subscribing for an investment must be able to bear the risks involved and must meet the suitability requirements relating to such investment. Some or all alternative investment programs discussed herein may not be suitable for certain investors This document is directed only to persons having professional experience in matters relating to investments. Any investment or investment activity to which this document relates is available only to such investment professionals. Persons who do not have professional experience in matters relating to investments should not rely upon this document.
This document and its contents are proprietary information of TTU and may not be reproduced or otherwise disseminated in whole or in part without TTU’s prior written consent.
This document contains simulated or hypothetical performance results that have certain inherent limitations AND SHOULD BE VIEWED FOR ILLUSTRATIVE PURPOSES. Unlike the results shown in an actual performance record, these results do not represent actual trading. HYPOTHETICAL PERFORMANCE RESULTS HAVE MANY INHERENT LIMITATIONS, SOME OF WHICH ARE DESCRIBED BELOW. NO REPRESENTATION IS BEING MADE THAT ANY ACCOUNT WILL OR IS LIKELY TO ACHIEVE PROFITS OR LOSSES SIMILAR TO THOSE SHOWN IN FACT, THERE ARE FREQUENTLY SHARP DIFFERENCES BETWEEN HYPOTHETICAL PERFORMANCE RESULTS AND THE ACTUAL RESULTS SUBSEQUENTLY ACHIEVED BY ANY PARTICULAR INVESTMENT ACCOUNT.
ONE OF THE LIMITATIONS OF HYPOTHETICAL PERFORMANCE RESULTS IS THAT THEY ARE GENERALLY PREPARED WITH THE BENEFIT OF HINDSIGHT IN ADDITION, HYPOTHETICAL TRADING DOES NOT INVOLVE FINANCIAL RISK, AND NO HYPOTHETICAL TRADING RECORD CAN COMPLETELY ACCOUNT FOR THE IMPACT OF FINANCIAL RISK IN ACTUAL TRADING FOR EXAMPLE, THE ABILITY TO WITHSTAND LOSSES OR TO ADHERE TO A PARTICULAR TRADING PROGRAM OR OTHER ASSET.
There are numerous other factors related to the markets in general or to the implementation of any specific trading program which cannot be fully accounted for in the preparation of hypothetical performance results and all of which can adversely affect actual trading results. No representation is being made that any investment will or is likely to achieve profits or losses similar to those being shown.
Most Comprehensive Guide to the Best Investment Books of All Time

Most Comprehensive Guide to the Best Investment Books of All Time
Get the most comprehensive guide to over 600 of the BEST investment books, with insights, and learn from some of the wisest and most accomplished investors in the world. A collection of MUST READ books carefully selected for you. Get it now absolutely FREE!
Get Your FREE Guide HERE!