


Trend Following - Week in Review— May 8, 2026

“Energy Reverses Hard, Equities Print Records, and the Barometer Slips to Neutral at 43%”
This Week in Trend – 8 May 2026
Welcome to This Week in Trend, your weekly view into the evolving structure of global futures markets and the behaviour of systematic trend following. This edition covers conditions through the close of US markets on Friday, 8 May 2026.
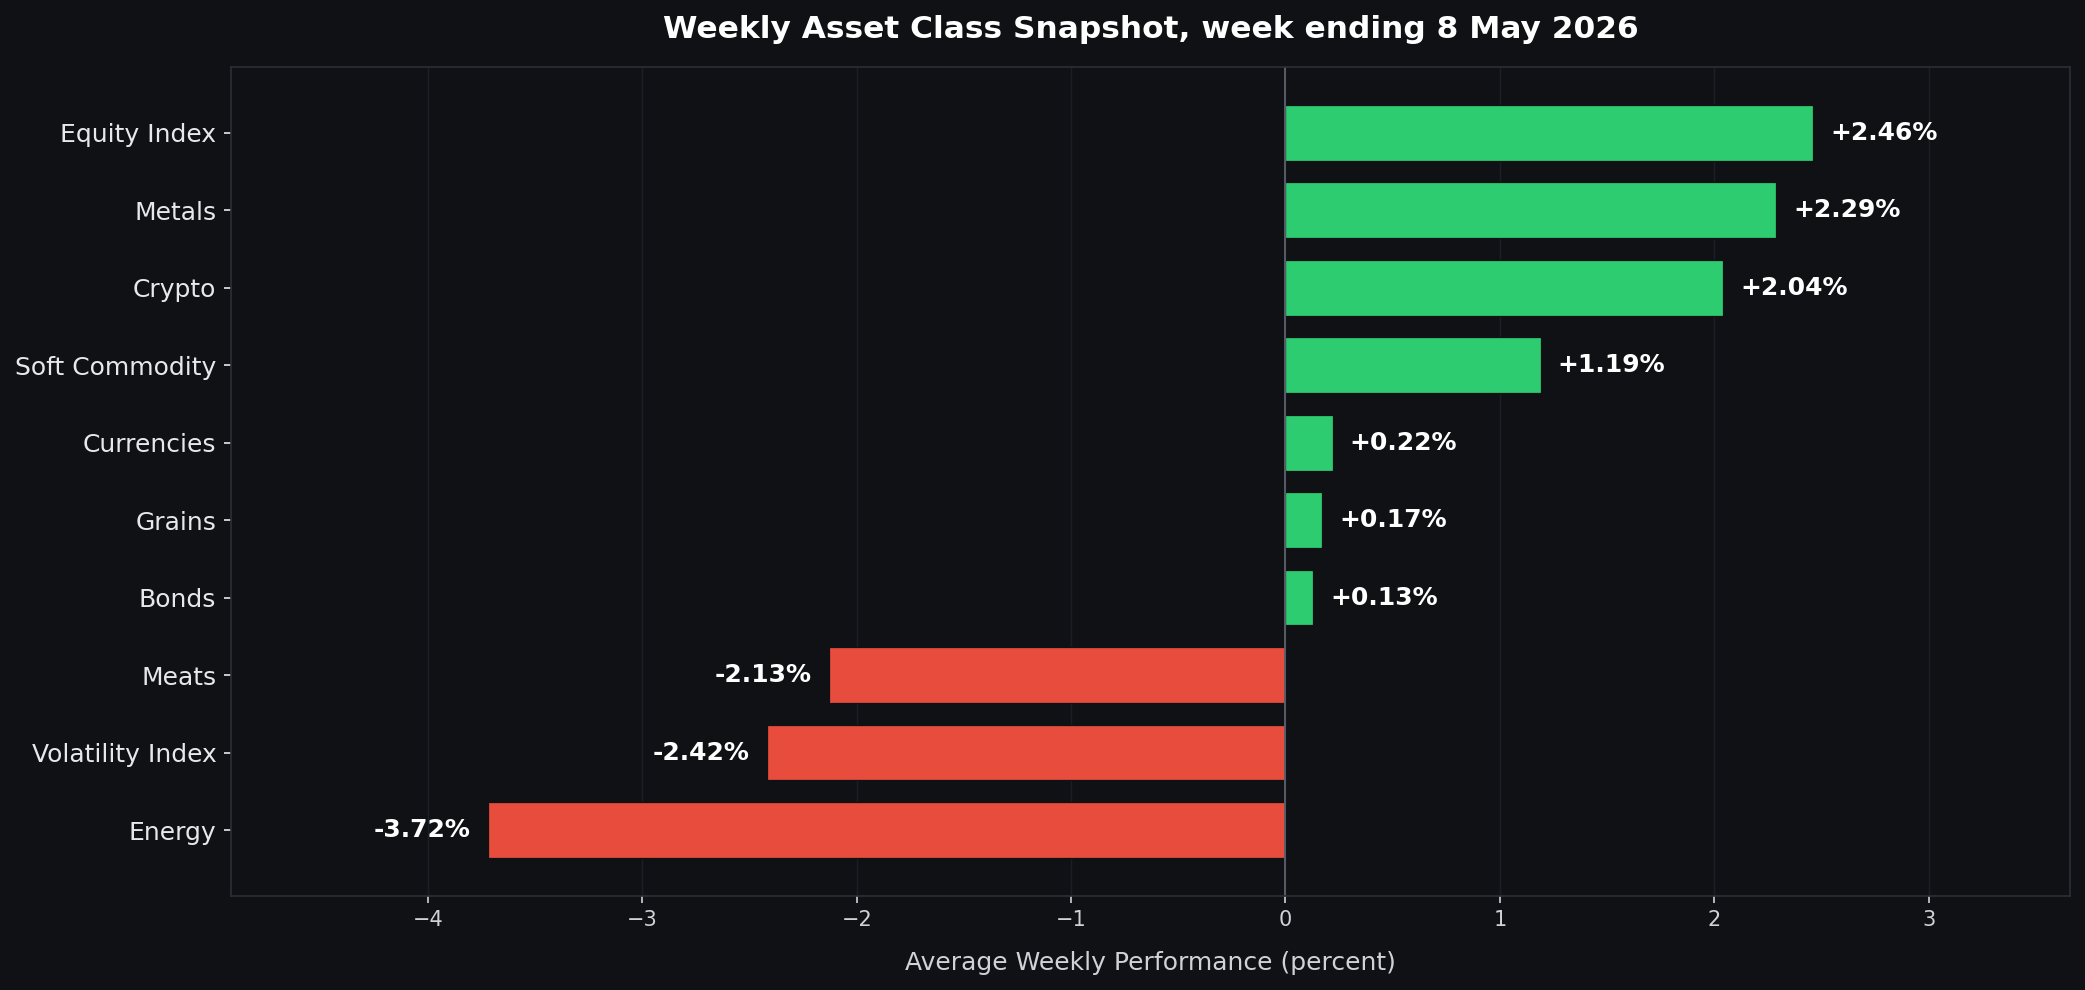
Energy reversed sharply lower, the sector averaging -3.72% with all six contracts moving in the same direction down for the first time in the current cycle. WTI fell 6.40%, Brent 6.36%, and Ethanol 5.62%, after diplomatic developments around the Strait of Hormuz reduced the geopolitical risk premium that had supported the complex through the prior fortnight. Reports suggested the US administration had advanced a framework via Pakistani intermediaries aimed at de-escalating the conflict and restoring commercial flows through the strait, with President Trump reportedly halting the previously announced “Project Freedom” mid-week citing progress toward a final agreement. The petroleum complex gave back roughly half of the prior two-week advance in a single week.
Equity indices led on the upside at +2.46%, with the Nikkei 225 +7.15%, Nasdaq 100 +5.38%, and S&P 500 +2.22% all printing fresh records on a tech and AI-driven rally. The Nikkei reopened from Japan’s Golden Week holiday and re-priced three sessions of global moves in one, with SoftBank surging more than 18% on the catch-up trade. Strong AMD earnings extended the AI-related leadership pattern across the chip complex globally. The DAX at -0.12% was the lone equity laggard. Metals printed +2.29% with four of five contracts higher: Silver +5.80%, Copper +5.21%, Platinum +2.36%, and Gold +1.86%. Palladium at -3.77% was the lone counter-direction print. The complex reasserted its multi-month upward read after two prior weeks of consolidation. Soft commodities printed +1.19% on the back of an outsized Cocoa move at +16.30%, the largest single-asset move of the week, with Cotton +0.64% the only other positive print and four contracts negative. Bonds firmed slightly at +0.13%, with the long end firmest. The dollar fell 0.23% against a mixed currency complex.
The TTU Trend Barometer broke from 55% to 43%, a 12-point drop and the largest single-week decline of the cycle, with the overall trend strength classification shifting from Strong back to Neutral. The 10-day rate of change accelerated from “Falling Weakly” to “Falling Moderately”. The SG Trend Index reads -0.61% month to date and +9.47% year to date as of 8 May, after closing April at +2.98% MTD and +10.27% YTD. The first week of May has given back roughly 80 basis points of headline performance and trimmed the YTD figure back below the double-digit threshold reclaimed at the end of April.
For trend followers, the week reordered which directional reads carry conviction and shifted the cycle from Strong back to Neutral. Long Energy gave back substantial ground in a single uniform-direction reversal. Long Equity exposure caught a clean week of broad upward moves across most of the complex. Long Metals exposure recovered cleanly as the corrective phase resolved upward. The barometer’s 12-point drop with the rate of change accelerating to “Falling Moderately” argues that the consolidation around the threshold has resolved to the downside, with the energy-driven leadership of the prior fortnight replaced by an equity-and-metals leadership that the barometer has not yet validated as a sustained breadth-and-persistence regime.
SG Trend Index Performance
Month to date (through 8 May): -0.61 percent
Year to date: +9.47 percent
Prior week reading (April month-end, 1 May 2026):
April month-end: +2.98 percent
Year to date: +10.27 percent
The SG Trend Index reads -0.61% MTD and +9.47% YTD as of 8 May, after closing April at +2.98% MTD and +10.27% YTD. The first week of May has given back roughly 80 basis points of headline performance and trimmed the YTD figure back below the double-digit threshold reclaimed at the end of April. The mechanism is straightforward: the Energy reversal hit long petroleum exposure that had been building for a fortnight, and that single-sector reversal was large enough to offset positive contributions from Equity, Metals, and Crypto.
The contributions inverted from the prior week. Long Energy exposure, which had been the largest positive contributor for two consecutive weeks, was the largest negative contributor this week with all six contracts moving lower in unison. Long Equity index exposure turned strongly to the upside, with the Nikkei 225 +7.15%, Nasdaq 100 +5.38%, and S&P 500 +2.22% all printing records, and the broad pattern across the complex consistent with an extended risk-on tape. Long Metals exposure recovered cleanly, with Silver, Copper, Platinum, and Gold all higher and the multi-month upward structure reasserted. Long Soft commodity exposure produced a mixed read, dominated by the outsized Cocoa move but offset by Sugar, Coffee, OJ, and Lumber lower. Long Bonds added a modest contribution at +0.13%. Short USD exposure detracted modestly as the dollar fell only 0.23% against a mixed currency complex.
The cycle has settled back into Neutral. The five-week barometer sequence now reads 52, 55, 50, 55, 43: a 12-point drop in a single week that has converted the prior consolidation around the threshold into a Neutral classification. The composition of the week is the relevant context: leadership shifted from Energy to Equity-and-Metals inside a single week, and breadth held at the sector level with seven of ten sectors positive, but contract-level breadth thinned to a near-even 25 of 49 positive against 24 negative. The Energy detraction was large enough on its own to register in the SG Index headline, and the broader pattern has rotated from a commodity-led tape to a financial-asset-led one without the breadth-and-persistence confirmation the barometer is calibrated to detect.
TTU Trend Barometer
Current reading: 43 percent
Previous reading: 55 percent
10-day rate of change: Falling Moderately
The barometer broke from 55% to 43%, a 12-point decline and the largest single-week drop of the cycle. The classification has shifted from Strong back to Neutral, with the headline level now sitting 12 points below the lower boundary of the Strong band. The five-week sequence reads 52, 55, 50, 55, 43: a pattern that traced the threshold three times in the prior month before resolving lower in a single week. The 10-day rate of change has accelerated from “Falling Weakly” over the prior three weeks to “Falling Moderately” this week, the deceleration that had been gradual now sharpening into a cleaner downward tilt.
The mechanism is the inverse of last week. Where the prior week featured Energy uniform-direction up, Softs reversed sharply higher, and breadth widening across five sectors, this week features Energy uniform-direction down, Softs splitting bifurcated again with Cocoa offsetting four negatives, and the leadership rotating from commodities to Equity-and-Metals. Contract-level breadth thinned to a near-even 25 of 49 positive against 24 negative. The barometer is calibrated to detect breadth and persistence rather than sector averages alone; with breadth narrower at the individual contract level and the leadership pattern shifting mid-cycle without confirmation, the 12-point drop reflects the loss of broad-based persistence even as several sector averages held up.
A 43% reading inside the Neutral band argues for reduced engagement at this stage of the cycle. The classification no longer favours full participation; the level itself sits 12 points below the Strong threshold, with the rate-of-change tilt now pointing further down rather than stabilising. The cycle has not yet reached the Weak-environment threshold of 40%, but a further softening would put the reading inside that band. Whether the cycle stabilises inside Neutral or breaks further lower turns on whether the Energy reversal continues into a multi-week move down or stabilises here, whether the Equity rally extends from records or consolidates, and whether the broad-based contract-level breadth recovers or thins further. The settling back into Neutral suggests the breadth-and-persistence regime that supported the prior month has weakened rather than merely paused.
The 10-day rate of change accelerating from “Falling Weakly” to “Falling Moderately” is the relevant tilt: the deceleration that had been gradual through the prior three weeks has now sharpened. The headline level has broken out of the Strong band, and the rate of change suggests further softening rather than stabilisation. A reading that holds at or above 43% with a stabilising or improving rate of change over the next two weeks would consolidate the read inside Neutral territory; a slip below 40% with a Falling rate of change would convert the cycle from Neutral to a Weak-environment classification. Either resolution sits ahead of the cycle, and the pattern over the next two weeks is the relevant evidence to monitor.
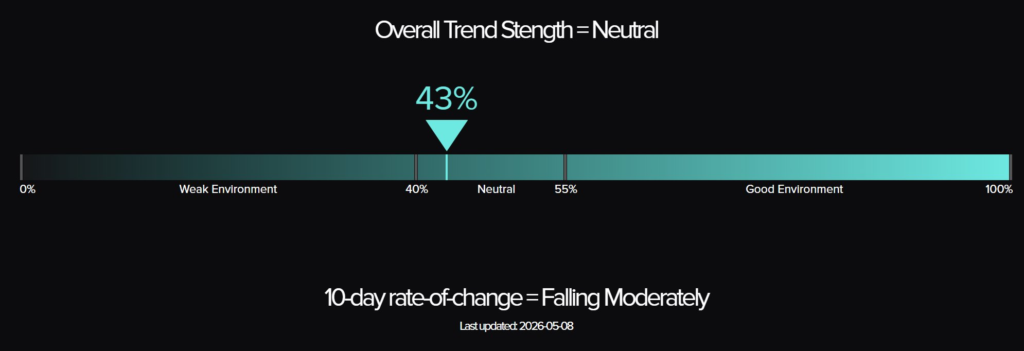
The Top Traders Unplugged (TTU) Trend Barometer is a proprietary tool that measures the percentage of markets with medium to strong trends. Similar to a thermometer, where 0 degrees Celsius equates to freezing, a TTU Trend Barometer reading below 40% indicates a “cold” environment for trend-following, while readings above 55% signal a “hotter,” more favorable trend environment.
Weekly Asset Class Snapshot
Source: Finviz.com
Energy (-3.72 percent | prev +6.02 percent)
Energy reversed hard, the sector averaging -3.72% with all six contracts moving lower in unison. WTI fell 6.40%, Brent 6.36%, Ethanol 5.62%, Gasoline RBOB 1.91%, Heating Oil 1.20%, and Natural Gas 0.83%. The reversal was driven by diplomatic progress around the Strait of Hormuz: reports suggested the US administration had advanced a framework via Pakistani intermediaries aimed at de-escalating the nearly ten-week conflict and restoring commercial flows through the strait. President Trump was reported to have halted the previously announced “Project Freedom” mid-week, citing progress toward a final agreement, and EIA data showed a 2.3 million barrel inventory draw for the week ending 1 May, smaller than the 3.4 million forecast. The IEA continued to flag that the conflict was disrupting roughly 14 million barrels per day of supply, but the diplomatic channel reopened the question of when, rather than whether, those volumes would return.
WTI prints near 94.68 and Brent near 100.25, both having given back roughly half of the prior two-week advance in a single week. Gasoline RBOB near 3.52 and Heating Oil near 3.88 have moderated from the prior week’s break-out levels. Natural Gas near 2.75 has resumed its broader downward bias after a single week of upward participation. The chart structure across the petroleum complex has shifted from clean upward channel to a pullback inside the recent advance: the prior two weeks of gains have not been fully reversed, but the upward bias has lost its clean run. The opportunity is now bidirectional with material conviction in either direction depending on whether the diplomatic channel resolves into a confirmed agreement or breaks down with renewed escalation.
Bonds (+0.13 percent | prev -0.48 percent)
Bonds firmed slightly at +0.13% after two consecutive negative weeks. The 30-year Bond rose 0.41%, the 10-year Note added 0.10%, the 5-year Note edged up 0.02%, and the 2-year Note fell 0.01%. The long end led on the way up, the inverse of the prior two weeks’ pattern. The mechanism is straightforward: the energy reversal removed a portion of the inflation impulse that had weighed on the curve through the prior fortnight, and the 10-year yield pulled back a few basis points to around 4.30%. The duration story has stabilised after two weeks of pressure, though the magnitude of the recovery is modest.
The 30-year sits near 113.72, having recovered modestly from the prior week’s lows. The 10-year near 110.78 has paused the prior week’s break. The 5-year near 107.90 and 2-year near 103.56 have stabilised. The complex now reads as consolidating rather than extending in either direction, with the long end showing the cleanest single-week recovery. A second consecutive positive week with similar magnitude would convert the read into a clearer upward bias; a single modest positive week sits inside the broader consolidation pattern.
Soft Commodity (+1.19 percent | prev +4.93 percent)
Soft commodities averaged +1.19%, dominated by an outsized Cocoa move at +16.30%, the largest single-asset move of the week. Cotton at +0.64% was the only other positive print. Lumber fell 0.77%, Sugar 1.74%, Orange Juice 3.22%, and Coffee 4.05%. Four of six contracts moved lower, with the sector average pulled positive by the magnitude of the Cocoa print alone. The Cocoa move reflected a combination of West African crop concerns: early surveys of the 2026/27 cocoa crop indicated below-average cherelle formation on cocoa trees, drought conditions reportedly covering about two-thirds of Ghana and more than half of Côte d’Ivoire, fund short-covering on a record net-short fund position, and the continued Hormuz disruption raising shipping costs and fertiliser prices. StoneX cut its 2026/27 global surplus estimate to 149,000 metric tonnes from 267,000 in January, citing risks from an expected El Niño weather event.
Cocoa near 4241 has reclaimed levels last seen in late January, and the contract has now reversed a multi-month downtrend with a single decisive upward print. Cotton near 84.70 sits at fresh multi-month highs after extending its weather-driven structure. Coffee near 274.20 continues its multi-month downward structure with another negative print. Sugar near 14.69 has resumed its slow downward drift. Orange Juice near 183.20 has given back the prior week’s outsized reversal, consistent with the contract’s well-documented liquidity profile. Lumber near 583.50 sits inside its established range. The sector-internal alignment is now bifurcated: Cocoa and Cotton on the long side, four contracts on the short side, the cleanest contract-by-contract read in some weeks.
Metals (+2.29 percent | prev -0.57 percent)
Metals printed +2.29% with four of five contracts higher. Silver advanced 5.80%, Copper rose 5.21%, Platinum added 2.36%, and Gold gained 1.86%. Palladium at -3.77% was the lone counter-direction print. The corrective phase that had operated through the prior two weeks resolved upward, with the multi-month upward structure across the complex reasserting. The mechanism combined a softer dollar, the broader risk-on tape, and continued reserve-diversification flows into the precious complex. Silver and Copper led on the industrial side, lifted by the equity-and-AI tape and Chinese demand reads stabilising; Gold and Platinum participated on the precious side as the dollar slipped 0.23% on the week.
Silver near 80.84 has reclaimed the 80 threshold and now sits at the upper end of its multi-month range. Gold near 4723.70 has recovered roughly half of the prior two-week giveback. Platinum near 2069.30 has moved back above 2050. Copper near 6.28 has printed fresh multi-month highs. Palladium near 1503.50 has slipped back to its base levels. The read inside the complex is clean for four of five contracts on the long side, with Palladium the lone hold-out. The cleanest structural breakout is in Copper, where the contract has now pushed through resistance at the prior month’s highs.
Meats (-2.13 percent | prev +1.81 percent)
Meats reversed to -2.13% with all three contracts lower. Live Cattle fell 1.62%, Feeder Cattle 2.14%, and Lean Hogs 2.62%. The prior week’s reversal in the cattle complex did not extend, with both Live Cattle and Feeder Cattle giving back part of the prior week’s recovery. The cattle structure that had been reasserted last week has paused rather than confirmed. Lean Hogs continued the alternating-week pattern that has dominated the contract for the past several weeks.
Live Cattle near 249.18 has slipped back from the prior week’s recovery. Feeder Cattle near 364.15 has done the same. Lean Hogs near 98.83 has continued its volatile chop. The cattle complex now offers an ambiguous read: the multi-month upward structure has not been broken, but the prior week’s clean reversal has been partially given back. The opportunity is now contract-specific rather than thematic, with the cleanest read awaiting either a third week down that compromises the structure or a resumption of the upward break that would reassert it.
Grains (+0.17 percent | prev +2.70 percent)
Grains held a fourth consecutive positive sector reading at +0.17%, with the breadth fracturing materially. Rough Rice advanced 8.23%, the second-largest single-asset move of the week and the standout in the complex. Soybeans added 0.39% and Soybean Meal 0.13%. Canola fell 0.32%, Soybean Oil 1.12%, Oats 1.14%, Corn 1.87%, and Wheat 2.94%. Three contracts moved higher, five moved lower. The thematic upward read of the prior week has resolved into a contract-specific picture, with the Rough Rice move dominating the sector-level positive average. The drivers were mixed: Rough Rice on tighter supply, the broader complex paused after three consecutive weeks of strong gains.
Rough Rice near 12.15 has logged a sharp single-week reversal upward off recent base levels. Soybeans near 1206 has held the recent advance but lost momentum. Wheat near 620.00 has given back part of the prior three weeks of strength. Corn near 471.00 has paused below the prior week’s break of resistance. Soybean Oil near 74.16 has paused the two-week strong advance. Oats near 350.50 has moderated from the prior week’s reversal. The vegetable oil pocket that had been the cleanest pattern in the complex has paused; Rough Rice has emerged as the standout single-contract move. The sector-internal alignment is now contract-specific rather than thematic, with the broader complex consolidating after three weeks of gains.
Equity Index (+2.46 percent | prev +0.39 percent)
Equity indices led the week at +2.46% with six of seven contracts higher. The Nikkei 225 advanced 7.15%, the Nasdaq 100 added 5.38%, the S&P 500 rose 2.22%, the Russell 2000 gained 1.71%, the Euro Stoxx 50 added 0.80%, and the DJIA edged up 0.09%. The DAX at -0.12% was the lone material laggard. The drivers were a combination of strong AMD earnings, which lifted the AI-related chip complex globally, and the Nikkei’s reopening from Japan’s Golden Week holiday catching up to three sessions of global moves in one. SoftBank surged more than 18% on the catch-up, its largest single-day move since 2020. The Nasdaq Composite and S&P 500 both printed fresh record closing highs.
The Nikkei 225 near 63850 has broken decisively above the 62000 threshold for the first time, the Nasdaq 100 near 29333 has extended the multi-month leadership pattern, and the S&P 500 near 7420 has logged another fresh record. The Russell 2000 near 2869 and the DJIA near 49745 have participated more modestly. The Euro Stoxx 50 near 5920 turned upward, and the DAX near 24452 paused. The read across most of the complex is now firmly on the long side, with the cleanest structural breakouts in the technology-weighted indices and the broader pattern consistent with continued AI-themed leadership. The level question is the standard one for indices at fresh records: the structure favours the long side, and short-cycle profit-taking remains a near-term risk.
Currencies (+0.22 percent | prev +0.47 percent)
The dollar fell 0.23% on the week, with the seven non-USD currencies averaging +0.22%. NZD led at +0.90%, CHF added 0.51%, AUD 0.46%, EUR 0.40%, GBP 0.29%, and JPY 0.16%. CAD at -0.73% was the lone material laggard, weighed by the sharp drop in oil. The mechanism reads as a continuation of the weak-dollar regime that has operated through most of April: oil-down, dollar-down, risk-on, and majors firmer. The energy reversal that detracted from the petroleum complex did not materially shift the dollar narrative, and the broader risk-on tape supported the equity-linked currencies more than the commodity-linked ones.
The USD near 97.77 has extended its downward bias, now sitting at the lows of the past several weeks. EUR near 1.1807 has firmed modestly, GBP near 1.3631 has held its level, and CHF near 1.2931 has caught a renewed safe-haven bid against the broader weak-dollar read. The commodity-linked complex split: AUD near 0.7242 and NZD near 0.5972 firmed on the equity-and-metals tape, but CAD near 0.7324 weakened as oil fell. The read across the complex is now a renewed weak-dollar regime with internal differentiation between the equity-linked currencies on the firmer side and the oil-linked CAD on the softer side. JPY near 0.6401 was essentially flat, with the prior week’s safe-haven bid moderated.
Volatility Index (-2.42 percent | prev -5.58 percent)
The VIX fell 2.42%, the second consecutive declining week and a continuation of the short-volatility signal that resumed last week. The contract trades near 19.10, now firmly below the 20 threshold. The decline is consistent with the equity strength, the broader risk-on tape, and the Hormuz diplomatic progress reducing the geopolitical risk premium. The level near 19 sits inside a normal equity-volatility regime.
The two consecutive declining weeks confirm the read. The single uptick three weeks ago was a temporary geopolitical bid that has now been fully unwound. The short-volatility signal that had operated through the prior weeks is back in place, and the level sits comfortably inside the normal range. A third consecutive declining week would extend the read; the current pattern reads as a clean move on the short side.
Crypto (+2.04 percent | prev +0.97 percent)
Bitcoin advanced 2.04%, the second consecutive positive week and an extension of the prior week’s modest upward turn. The contract trades near 80390. The move was consistent with the broader risk-on tape: equities firmer, dollar softer, and metals higher. There was no specific crypto-side catalyst, but the contract’s behaviour now mirrors the equity complex more closely than it has in recent weeks, with the renewed risk-on read pulling Bitcoin alongside.
The chart structure has improved. The two-week consolidation has resolved into a modest upward break, with the contract now firming above 80000 for the first time in several weeks. The longer-term uptrend remains the operating read, and the next question is whether the contract can push back toward its January highs near 95000 or whether the early-summer range tops out near current levels.
Performance Highlights – This Week’s Market Leaders & Laggards
Source: Finviz.com
Top Market Movers
Top Gainers
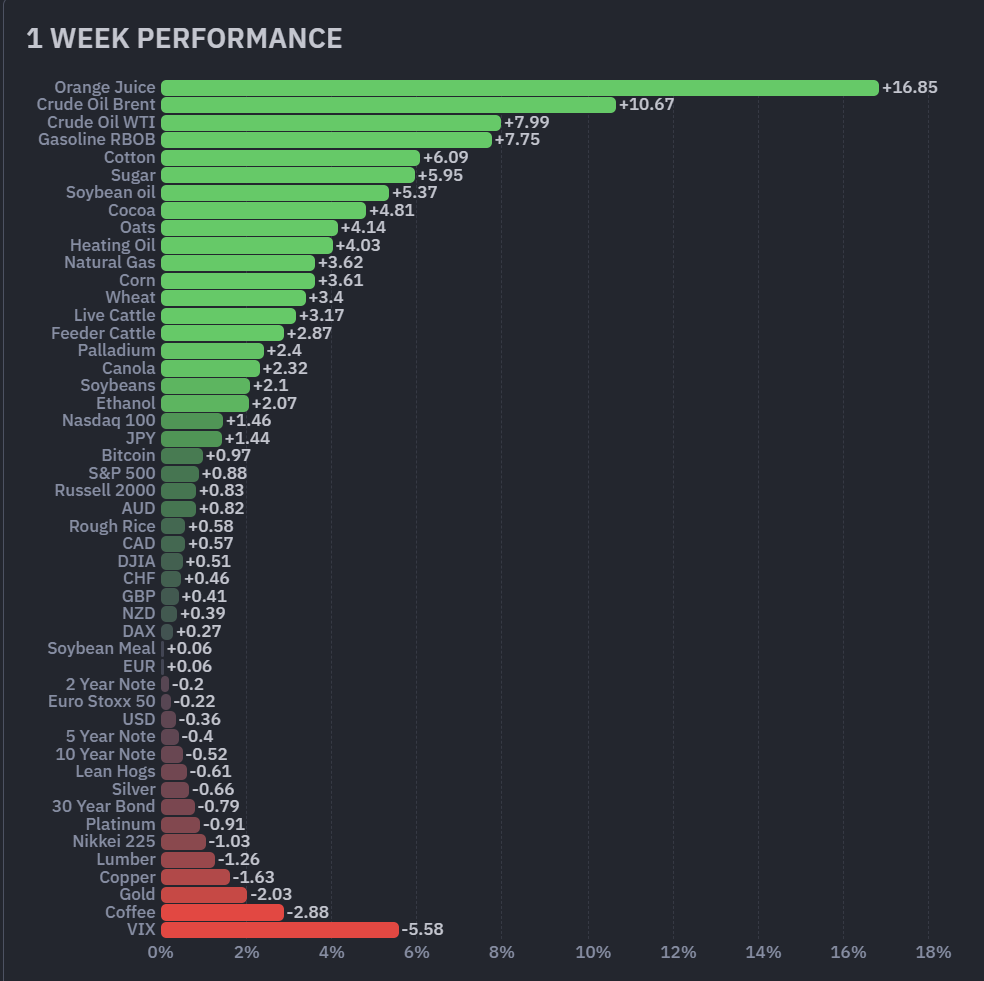
1. Cocoa +16.30 percent
Cocoa surged 16.30%, the largest single-asset move of the week in either direction and the largest upward print across the 49-contract universe. The contract trades near 4241, reclaiming levels last seen in late January. The drivers combined deteriorating early crop signals for the 2026/27 West African season, with surveys indicating below-average cherelle formation on cocoa trees, drought conditions reportedly covering about two-thirds of Ghana and more than half of Côte d’Ivoire, and a fund short-covering rally on what was reported as a record net-short fund position in NY cocoa. The Hormuz disruption added an additional cost layer, raising shipping rates and fertiliser prices for the West African origin. StoneX cut its 2026/27 global surplus forecast to 149,000 metric tonnes from 267,000 in January. The combination of crop-side concerns, fund positioning, and shipping disruption produced a single decisive upward print that has reversed the contract’s multi-month downtrend.
2. Rough Rice +8.23 percent
Rough Rice advanced 8.23%, the second-largest single-asset move of the week and the standout in the grain complex. The contract trades near 12.15, having logged a sharp single-week reversal upward off recent base levels. The driver was a tighter supply read that contrasted with the broader grain complex pause, with the rest of the sector consolidating after three weeks of gains while Rough Rice broke higher. The chart structure now shows a single-week break that has reversed the contract’s multi-week downward bias.
3. Nikkei 225 +7.15 percent
The Nikkei 225 advanced 7.15%, the third-largest single-asset move of the week. The contract trades near 63850, breaking decisively above the 62000 threshold for the first time. The move was substantially driven by the Nikkei’s reopening from Japan’s Golden Week holiday and re-pricing three sessions of global moves in one, with SoftBank surging more than 18% on the catch-up. The broader AI-themed rally lifted the Japanese chip complex alongside global counterparts. The read is now firmly on the long side, with the structural breakout above 62000 marking a fresh phase of the multi-month uptrend.
4. Silver +5.80 percent
Silver advanced 5.80%, the fourth-largest single-asset move of the week. The contract trades near 80.84, reclaiming the 80 threshold and sitting at the upper end of its multi-month range. The move combined a softer dollar, the broader risk-on tape, and the precious complex catching renewed reserve-diversification flows. Silver led the metals on the industrial side, with the AI-driven equity tape pulling industrial demand reads higher. The longer-term upward structure remains intact, and the single-week strength puts the contract at fresh multi-month highs.
Top Losers
1. Crude Oil WTI -6.40 percent
Crude Oil WTI fell 6.40%, the largest single-asset decline of the week and a sharp reversal of the prior fortnight’s advance. The contract trades near 94.68, having given back roughly half of the prior two-week move. The drivers were diplomatic developments around the Strait of Hormuz: reports suggested the US administration had advanced a framework via Pakistani intermediaries, with President Trump reported to have halted the previously announced “Project Freedom” mid-week. EIA data showed a 2.3 million barrel inventory draw for the week ending 1 May, smaller than the 3.4 million forecast. The chart structure has shifted from a clean upward channel to a pullback inside the recent advance.
2. Crude Oil Brent -6.36 percent
Crude Oil Brent fell 6.36%, the second-largest single-asset decline of the week. The contract trades near 100.25, also having given back roughly half of the prior two weeks’ gains. The drivers mirror WTI: the diplomatic channel reopening the question of when Hormuz-disrupted volumes return, the smaller-than-forecast inventory draw, and the broader unwind of the geopolitical risk premium. Brent has dipped just back to the 100 level after spending most of the prior fortnight above 109. The two-week cumulative pattern is no longer a clean upward break.
3. Ethanol -5.62 percent
Ethanol fell 5.62%, the third-largest single-asset decline of the week. The contract trades near 1.93, having joined the broader Energy reversal alongside the petroleum complex. The driver is the same Hormuz channel that has weighed on crude, expressed through the bio-fuel complex via correlated demand patterns and refining margin compression as crude prices unwound. The contract has given back the prior week’s modest upward print and resumed the broader downward bias.
4. Coffee -4.05 percent
Coffee fell 4.05%, the fourth-largest single-asset decline of the week and a continuation of the contract’s multi-month downward structure. The contract trades near 274.20. While Cocoa surged in the same sector, Coffee held its read on the short side: Brazilian and Vietnamese crop conditions remained supportive of supply, and global demand has continued to soften on cost-of-living pressures in major importing economies. The longer-term chart shows a contract still inside a clean downward structure.
Portfolio View - Positioning and Impact
Long Energy exposure was the largest detractor for the week, reversing two consecutive weeks of strong gains. WTI -6.40%, Brent -6.36%, Ethanol -5.62%, Gasoline RBOB -1.91%, Heating Oil -1.20%, Natural Gas -0.83%. All six contracts moved lower in unison, the first uniform-direction down week of the current cycle. Portfolios that had built or held long Energy exposure through the prior fortnight’s advance gave back substantial ground; portfolios that had trimmed at the prior week’s break-out levels avoided the bulk of the reversal. Systems aligned short captured the move.
Long Equity Index exposure was the largest contributor, with six of seven contracts higher. Nikkei 225 +7.15%, Nasdaq 100 +5.38%, S&P 500 +2.22%, Russell 2000 +1.71%, Euro Stoxx 50 +0.80%, DJIA +0.09%, DAX -0.12%. The breadth was broad and the directional alignment clean. The U.S.-led leadership pattern of the prior weeks extended, with the Nikkei catching up on its holiday-driven lag in a single week.
Long Metals exposure recovered cleanly. Silver +5.80%, Copper +5.21%, Platinum +2.36%, Gold +1.86%, Palladium -3.77%. Four of five contracts higher, with Silver and Copper leading. The corrective phase that had operated through the prior two weeks resolved upward, reasserting the multi-month upward structure across most of the complex.
Long Soft Commodity exposure produced a sector-positive but contract-bifurcated read. Cocoa +16.30%, Cotton +0.64%, Lumber -0.77%, Sugar -1.74%, Orange Juice -3.22%, Coffee -4.05%. The outsized Cocoa move alone pulled the sector average positive; four contracts ended negative. Systems holding diversified long exposure across the complex saw mixed results; systems with concentrated Cocoa exposure or quick to flip captured the standout move.
Long Bonds added a modest contribution at +0.13% after two consecutive negative weeks. Long Bitcoin extended +2.04% in line with the broader risk-on tape. Short USD against majors detracted modestly with the dollar at -0.23% and CAD specifically lower; the equity-linked currencies added on the firmer side. Long Grains held a fourth positive print at +0.17% but with breadth fracturing materially. Long Meats reversed to -2.13% with all three contracts lower. Long VIX detracted again at -2.42% as the short-volatility signal extended.
Final Reflections: Leadership Rotates as the Barometer Slips to Neutral
The week ending 8 May 2026 reordered which directional reads carry conviction and shifted the cycle from Strong back to Neutral. Energy reversed hard with all six contracts moving lower in unison, the first uniform-direction down week of the current cycle, after diplomatic developments around the Strait of Hormuz reduced the geopolitical risk premium that had supported the complex through the prior fortnight. Equity indices led on the upside at +2.46%, with the Nikkei 225, Nasdaq 100, and S&P 500 all printing fresh records on a tech and AI-driven rally. Metals printed +2.29% with four of five contracts higher, the corrective phase resolving upward and the multi-month upward structure reasserting. The TTU Barometer broke from 55% to 43%, a 12-point drop and the largest single-week decline of the cycle, with the classification shifting from Strong to Neutral and the rate of change accelerating from “Falling Weakly” to “Falling Moderately”. The SG Trend Index now reads -0.61% MTD and +9.47% YTD, having given back roughly 80 basis points of headline performance and slipped back below double-digit YTD territory.
Three observations define the week:
1. The barometer has slipped from 55% to 43%, the largest single-week drop of the cycle and a return to Neutral territory.
The five-week sequence reads 52, 55, 50, 55, 43: three weeks of consolidation around the threshold followed by a clean move back into Neutral. The classification has shifted from Strong to Neutral, and the 10-day rate of change has accelerated from “Falling Weakly” over the prior three weeks to “Falling Moderately” this week. The classification no longer favours full participation; the level itself sits 12 points below the Strong threshold, with the rate-of-change tilt pointing further down rather than stabilising. The 40% boundary into Weak-environment territory now sits three points below the current reading. The next two weeks of evidence will determine whether the cycle stabilises inside Neutral or breaks further lower.
2. Energy has converted from spike-and-extend back to spike-and-reverse, returning bidirectional opportunity to the petroleum complex.
The petroleum complex gave back roughly half of the prior two-week advance in a single week, with all six contracts moving lower in unison. WTI has gone from above 102 last week back to near 95, Brent from above 109 back to near 100. The drivers were diplomatic: reports indicated a US memorandum of understanding sent to Tehran via Pakistani intermediaries, and President Trump halted “Project Freedom” mid-week. The IEA continued to flag that the conflict was disrupting roughly 14 million barrels per day of supply, but the diplomatic channel reopened the question of when, rather than whether, those volumes would return. The opportunity is now bidirectional with material conviction in either direction depending on whether the diplomatic channel resolves into a confirmed agreement or breaks down with renewed escalation.
3. Equity-and-Metals leadership has replaced Energy leadership inside a single week, with breadth holding at the sector level.
Equity indices +2.46% and Metals +2.29% led the upside, with the Nikkei 225 +7.15% and Nasdaq 100 +5.38% printing fresh records and the precious-and-industrial metals complex reasserting its multi-month upward structure. The leadership change was driven by AI-themed equity strength, the Nikkei’s catch-up reopening from Japan’s Golden Week holiday, and the precious complex catching renewed flows on the softer dollar. Contract-level breadth thinned to a near-even 25 of 49 positive against 24 negative, and that narrower contract-level breadth is what the barometer registered with the 12-point drop into Neutral. Cocoa’s outsized +16.30% added a single-contract standout, but the more durable read for the week is that the rotation from commodities to financial assets has occurred without the broad-based contract-level breadth that would validate it as a sustained regime.
For trend followers, the week was not defined by whether markets rose or fell. It was defined by whether the moves were persistent enough to be captured. The opportunity was directional, but leadership was unstable.
One question defines the week ahead: Does the diplomatic channel around Hormuz convert into a confirmed agreement that extends the Energy reversal lower, or does the channel break down with renewed escalation and reopen the upward bias?

List of Resources used in the Week in Review
Important Disclaimers
This document is directly solely to Accredited Investors, Qualified Eligible Participants, Qualified Clients and Qualified Purchasers. No investment decision should be made until prospective investors have read the detailed information in the fund offering documents of any manager mentioned in this document. This document is furnished on a confidential basis only for the use of the recipient and only for discussion purposes and is subject to amendment This document is neither advice nor a recommendation to enter into any transaction. This document is not an offer to buy or sell, nor a solicitation of an offer to buy or sell, any security or other financial instrument. This presentation is based on information obtained from sources that TopTradersUnplugged (“TTU”) (“considers to be reliable however, TTU makes no representation as to, and accepts no responsibility or liability for, the accuracy or completeness of the information. TTU has not independently verified third party manager or benchmark information, does not represent it as accurate, true or complete, makes no warranty, express or implied regarding it and shall not be liable for any losses, damages, costs or expenses relating to its adequacy, accuracy, truth, completeness or use.
All projections, valuations, and statistical analyses are provided to assist the recipient in the evaluation of the matters described herein. Such projections, valuations and analyses may be based on subjective assessments and assumptions and may use one among many alternative methodologies that produce different results accordingly, such projections, valuations and statistical analyses should not be viewed as facts and should not be relied upon as an accurate prediction of future events. There is no guarantee that any targeted performance will be achieved Commodity trading involves substantial risk of loss and may not be suitable for everyone
TTU is not and does not purport to be an advisor as to legal, taxation, accounting, financial or regulatory matters in any jurisdiction. The recipient should independently evaluate and judge the matters referred to herein. TTU does not provide advice or recommendations regarding an investor’s decision to allocate to funds or accounts managed by any manager (“or to maintain or sell investments in funds or accounts managed by any manager, and no fiduciary relationship under ERISA is created by the investor investing in funds or accounts managed by any manager, or through any communication between TTU and the investor
In reviewing this document, it should be understood that the past performance results of any asset class, or any investment or trading program set forth herein, are not necessarily indicative of any future results that may be achieved in connection with any transaction. Any persons subscribing for an investment must be able to bear the risks involved and must meet the suitability requirements relating to such investment. Some or all alternative investment programs discussed herein may not be suitable for certain investors This document is directed only to persons having professional experience in matters relating to investments. Any investment or investment activity to which this document relates is available only to such investment professionals. Persons who do not have professional experience in matters relating to investments should not rely upon this document.
This document and its contents are proprietary information of TTU and may not be reproduced or otherwise disseminated in whole or in part without TTU’s prior written consent.
This document contains simulated or hypothetical performance results that have certain inherent limitations AND SHOULD BE VIEWED FOR ILLUSTRATIVE PURPOSES. Unlike the results shown in an actual performance record, these results do not represent actual trading. HYPOTHETICAL PERFORMANCE RESULTS HAVE MANY INHERENT LIMITATIONS, SOME OF WHICH ARE DESCRIBED BELOW. NO REPRESENTATION IS BEING MADE THAT ANY ACCOUNT WILL OR IS LIKELY TO ACHIEVE PROFITS OR LOSSES SIMILAR TO THOSE SHOWN IN FACT, THERE ARE FREQUENTLY SHARP DIFFERENCES BETWEEN HYPOTHETICAL PERFORMANCE RESULTS AND THE ACTUAL RESULTS SUBSEQUENTLY ACHIEVED BY ANY PARTICULAR INVESTMENT ACCOUNT.
ONE OF THE LIMITATIONS OF HYPOTHETICAL PERFORMANCE RESULTS IS THAT THEY ARE GENERALLY PREPARED WITH THE BENEFIT OF HINDSIGHT IN ADDITION, HYPOTHETICAL TRADING DOES NOT INVOLVE FINANCIAL RISK, AND NO HYPOTHETICAL TRADING RECORD CAN COMPLETELY ACCOUNT FOR THE IMPACT OF FINANCIAL RISK IN ACTUAL TRADING FOR EXAMPLE, THE ABILITY TO WITHSTAND LOSSES OR TO ADHERE TO A PARTICULAR TRADING PROGRAM OR OTHER ASSET.
There are numerous other factors related to the markets in general or to the implementation of any specific trading program which cannot be fully accounted for in the preparation of hypothetical performance results and all of which can adversely affect actual trading results. No representation is being made that any investment will or is likely to achieve profits or losses similar to those being shown.
Most Comprehensive Guide to the Best Investment Books of All Time

Most Comprehensive Guide to the Best Investment Books of All Time
Get the most comprehensive guide to over 600 of the BEST investment books, with insights, and learn from some of the wisest and most accomplished investors in the world. A collection of MUST READ books carefully selected for you. Get it now absolutely FREE!
Get Your FREE Guide HERE!