


Trend Following - Week in Review - November 21, 2025

“When the Tide Turns”
This Week in Trend – 21 November 2025
Welcome to This Week in Trend, your lens into the shifting dynamics of global futures markets and the evolving landscape of systematic trend following.
This edition reflects conditions through the close of US markets on Friday 21 November 2025. The third week of November delivered a clear shift in tone. The calm that characterised the earlier part of the month gave way to broad risk pressure, rising volatility and a decisive turn lower across crypto, equities and commodities. Almost every major asset class finished the week in the red, with only isolated defensive pockets offering relief.
The SG Trend Index, which had staged a meaningful rebound in early November, slipped back toward flat for the month and returned to a small loss for the year. The TTU Trend Barometer dropped to 48 percent with a falling rate of change, signalling that trend strength is deteriorating rather than stabilising. The environment has moved from uneven opportunity to rising stress, with fewer clean signals and more sectors pulling against each other.
The market no longer hides its turbulence beneath a quiet surface. This week revealed a visible break in trend alignment. Correlations tightened, speculative areas unwound and several of the earlier leadership groups lost momentum. Trend followers faced a more challenging environment as the tide turned across a broad cross section of markets.
SG Trend Index Performance
• Month to date (as of Nov 21): +0.06 percent
• Year to date: -0.83 percent
• Previous week: +1.99 percent MTD | +1.08 percent YTD
The SG Trend Index stalled after a strong start to November. Gains in energy, metals and selective grains that had supported performance earlier in the month were overwhelmed by broad weakness this week. The sharp decline in crypto, the pullback in global equity indices and the widespread softness across commodities reversed much of the early month progress.
After regaining positive territory last week, the year to date profile has slipped negative again. The index now reflects a market where earlier conviction in real assets is fading and risk assets are moving lower together. Systems are still finding some support from defensive trends in bonds and the dollar, but these were not enough to offset the breadth of declines across risk markets. The transition from early-month resilience to mid-month deterioration is now visible in the headline numbers.
The SG Trend Index captures realised trend following performance. The TTU Trend Barometer provides a forward looking measure of trend strength across the broader futures universe.
TTU Trend Barometer
• Current reading: 48 percent – Neutral
• Previous reading: 50 percent
• 10 day rate of change: Falling moderately
The TTU Trend Barometer stepped down from 50 to 48 percent, with the 10 day rate of change turning decisively lower. This move signals a weakening environment where fewer markets show medium to strong trends. Early week strength was replaced with broad reversals across crypto, energy, equities and soft commodities. This deterioration erased the tentative improvement seen earlier in the month.
At 48 percent, the barometer still points to a neutral environment, but the direction of travel is negative. Participation has shrunk, alignment has weakened and more markets have moved into corrective phases. Strong trends in sugar, cocoa and orange juice remain present on the short side, yet these isolated opportunities cannot offset the fading strength across the wider landscape.
The key message from the barometer this week is retreat. Trends remain present, but they are losing coherence across sectors. The market has shifted from mixed opportunity to growing instability, and systems now need to navigate a less forgiving environment where the tide is moving against broad trend alignment.
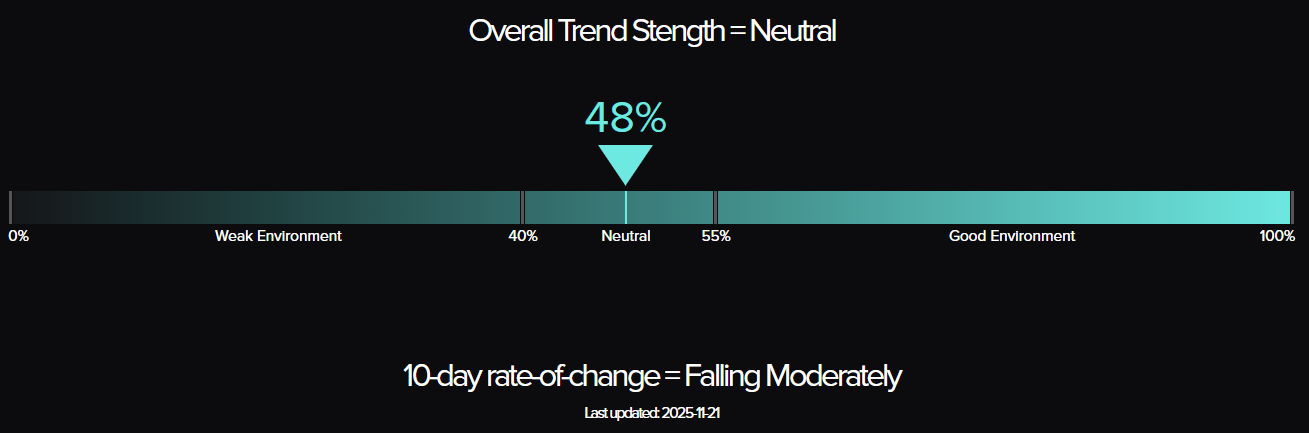
The Top Traders Unplugged (TTU) Trend Barometer is a proprietary tool that measures the percentage of markets with medium to strong trends. Similar to a thermometer, where 0 degrees Celsius equates to freezing, a TTU Trend Barometer reading below 40% indicates a “cold” environment for trend-following, while readings above 55% signal a “hotter,” more favourable trend environment.
Weekly Asset Class Snapshot
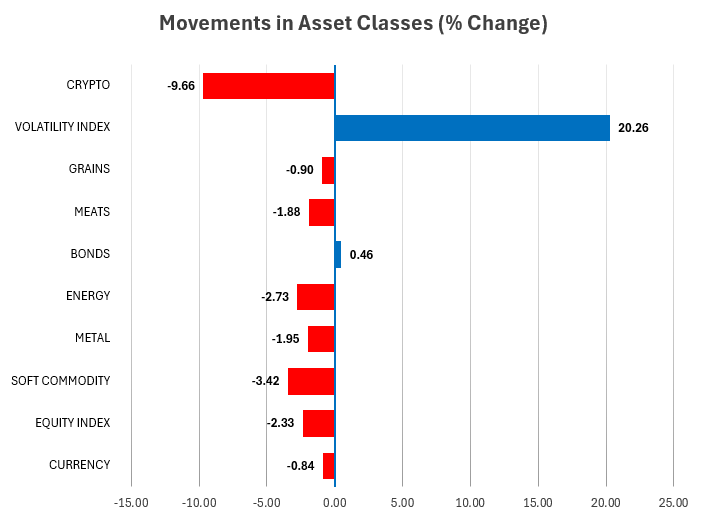
Source: Finwiz.com
• Volatility Index (+20.26 percent | prev +0.22 percent)
Volatility jumped sharply and became the dominant feature of the week. The VIX surged more than twenty percent as selling pressure spread across crypto, equities and commodities. This marks a clear shift from last week’s subdued profile. Traders moved quickly to rebuild protection, and the spike in volatility reflects a more fragile market backdrop. Rising volatility is consistent with the barometer’s decline to 45 percent and confirms that trend conditions have weakened.
• Metals (−1.95 percent | prev +1.97 percent)
Metals reversed lower after last week’s strength. Precious metals softened, with silver and platinum leading the decline, while copper held closer to flat. The sector has cooled from the constructive tone of earlier in the month. Trend signals remain present but have weakened, and the group no longer anchors broader trend strength as it did last week.
• Crypto (−9.66 percent | prev −8.64 percent)
Crypto suffered another heavy setback. Bitcoin fell almost ten percent, compounding last week’s decline and breaking deeper into corrective territory. The sector remains the weakest part of the futures universe, with models predominantly flat or short. Trend structure points to ongoing stress rather than any sign of repair, and the selling pressure continues to intensify.
• Energy (−2.73 percent | prev +2.30 percent)
Energy turned decisively lower. Crude benchmarks, gasoline and heating oil all declined after several weeks of steady gains. Natural gas held up better but still lost momentum. The complex has shifted from being a reliable upside driver to a source of drag. Trend signals have weakened across the board as the entire group rolled over.
• Soft Commodities (−3.42 percent | prev −3.43 percent)
Softs extended their multi week correction. Cocoa, orange juice and lumber all posted meaningful declines. The sector continues to show strong downside momentum with no evidence of a base forming. The pattern remains one of persistent unwinding after parabolic earlier advances, and short positions continue to dominate the trend landscape within softs.
• Equity Index (−2.33 percent | prev +0.31 percent)
Equities retreated across global markets. The S&P 500, Nasdaq, DAX, Euro Stoxx and Nikkei all finished lower. The decline was broad and orderly but marked a clear shift from last week’s stabilisation. Trend signals across indices have weakened as markets roll over from elevated levels and leadership narrows further.
• Grains (−0.90 percent | prev +1.15 percent)
Grains slipped modestly. Wheat and corn weakened, soybean oil softened and oats held firmer. The sector remains mixed, with no unified direction across the complex. Some early signs of strength present last week have faded, and trend conditions remain uneven.
• Meats (−1.88 percent | prev −0.75 percent)
Meats continued to decline, with lean hogs, feeder cattle and live cattle all moving lower. The group remains a steady drag on trend portfolios. The selling pressure has broadened compared with last week, although volatility in the sector has moderated slightly.
• Bonds (+0.46 percent | prev −0.27 percent)
Bonds offered rare stability. Long duration Treasuries and global government bonds posted small gains as yields eased. While the broader trend structure remains choppy, fixed income provided one of the few positive contributions during a week of widespread declines across risk assets.
• Currencies (−0.84 percent | prev +0.33 percent)
Currencies weakened as the US dollar strengthened. EUR, GBP, CAD and CHF all slipped, while AUD and NZD remained near recent lows. The complex shows limited trend strength and continues to trade in a low conviction manner. The weekly decline reflects broader risk-off sentiment rather than strong directional moves in FX.
Summary
This week delivered a broad wave of weakness across nearly every major asset class. Volatility spiked, crypto broke down further, equities rolled over and commodities lost momentum. Metals softened, softs extended their decline and energy reversed lower. Bonds were the only meaningful offset. The overall backdrop has shifted from mixed opportunity to visible stress, aligning with the TTU Trend Barometer’s fall to 48 percent and confirming that the tide has turned across the global futures landscape.
Performance Highlights – This Week’s Market Leaders & Laggards
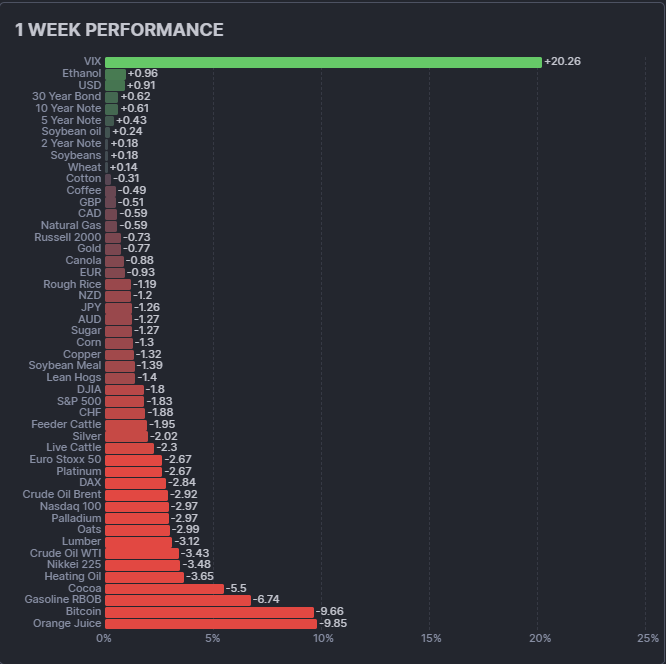
Top Market Movers
Top Gainers
- VIX +20.26 percent – Volatility Returns With Force
Volatility was the standout mover this week, surging more than twenty percent as risk appetite evaporated across global markets. The spike reflected a rapid shift from complacency to caution, with traders increasing protection as equities, commodities, and crypto all rolled over. For trend followers, the VIX move did not translate directly into positions, but it signalled a clear deterioration in market tone and helped confirm the barometer’s slide back into weaker territory. - Ethanol +0.96 percent – A Lone Bright Spot
Ethanol posted a small gain and stood almost alone among commodities in positive territory. The move was modest but notable in a week defined by broad selling pressure. The contract remains volatile on the medium-term charts, yet its relative resilience illustrated how isolated pockets of the agricultural complex can diverge sharply from the broader risk narrative. - USD +0.91 percent – Safe Haven Bid Reasserts Itself
The dollar edged higher as global markets weakened. While the move was not dramatic, it aligned with a classic flight to safety dynamic, with investors favouring the world’s reserve currency as risk assets came under stress. Trend signals in FX remain subdued, but dollar strength this week was consistent with the de-risking seen elsewhere.
Top Losers
- Orange Juice −9.85 percent – The Slide Deepens
Orange juice extended its multi-month unwind, posting one of the steepest losses in the futures universe. The contract has transitioned from a parabolic leader earlier in the year to a persistent source of downside momentum. The latest decline reinforced the structural breakdown already in place, keeping OJ among the clearest short side opportunities in the softs complex. - Bitcoin −9.66 percent – Risk Unwinds in Full View
Bitcoin fell sharply again, closing the week near recent lows and accelerating the reversal that began earlier in November. Liquidity remains thin and sellers remain in control. The breakdown in crypto continues to weigh heavily on systematic allocations, with most models either flat or holding small tactical shorts as the asset class remains one of the weakest across the entire trend universe. - Gasoline RBOB −6.74 percent – Cracks in the Energy Tape
Gasoline delivered the sharpest decline among the energy contracts, dropping nearly seven percent as the complex shifted decisively lower. The move marked a clear break from the resilience energy showed earlier in the quarter. RBOB now sits in a pronounced downtrend, contributing to the broader pressure that pulled energy into negative territory for the week.
Summary
This week’s leadership came entirely from defensive pockets rather than growth or real assets. Volatility surged, the dollar firmed, and isolated agricultural contracts held their ground. In contrast, the laggards revealed where the real stress emerged: soft commodities continued their powerful unwinds, crypto slid deeper into breakdown, and parts of the energy complex suffered meaningful technical damage.
The result was a landscape where the strongest signals appeared at the extremes, with downside momentum dominating and upside opportunities restricted to a very narrow set of defensive or idiosyncratic markets. This sharp reversal reinforced the barometer’s fall to 45 percent and confirmed that the tide has turned decisively since early November.
Portfolio View - Positioning and Impact
Equities
Equity markets turned lower across all major regions. The S&P 500, Nasdaq, DAX, Nikkei and Dow all slipped, with the pullback broad rather than concentrated. What had been a controlled consolidation in early November devolved into a more decisive rotation out of risk, and systematic long exposure across equity benchmarks was generally scaled back as stops tightened. The tone has shifted from quiet resilience to visible pressure, and leadership has narrowed further as small caps and cyclicals underperformed. Trend systems remain lightly long or flat, with little conviction until a more stable structure emerges.
Metals
Metals lost altitude after months of sustained strength. Gold held up reasonably well, but silver and platinum retreated and copper broke lower within its consolidation range. The pause in precious metals has not erased their broader uptrends, but momentum has weakened, and position sizes across systematic programs are moderating as volatility picks up. The complex is still constructive on a longer horizon, but this week marked a clear deceleration, reducing metals’ contribution to portfolio performance.
Energy
Energy weakened materially. Crude oil benchmarks extended their multi-month decline, gasoline posted one of the steepest losses in the complex, and heating oil also traded lower. Only natural gas held up, but even there momentum cooled. Trend exposure across the sector has shifted toward flat or lightly short, depending on the program. The sector that previously provided clean upside signals has now turned mixed to negative, creating a more defensive alignment across energy positioning.
Crypto
Crypto remained firmly in breakdown mode. Bitcoin dropped sharply again, extending one of the steepest declines in the futures landscape this week. The structural weakness that emerged earlier in November has accelerated, and most systematic portfolios hold either small shorts or no exposure at all. Crypto continues to function as a source of downside momentum rather than an opportunity for constructive trend participation.
Softs and Meats
Soft commodities delivered another heavy week of losses. Orange juice and cocoa continued to unwind spectacularly, deepening their multi-month breakdowns. Sugar and cotton held steadier but remain under pressure. Meats were also negative, with live cattle, feeder cattle and lean hogs all trending lower. Trend portfolios remain skewed toward short positions in softs, particularly in cocoa and orange juice, and exposure in meats is minimal until more durable bases form.
Rates and FX
Fixed income posted small gains across the curve, with long bonds, 10-year notes and short-dated rates all firming modestly. These moves offered a rare pocket of stability in an otherwise difficult week, although the trend structure in rates is still uneven. FX was mixed, with a mild bid for USD and scattered weakness across EUR, AUD and JPY. Trend exposure in currencies remains low conviction, with systems maintaining diversified small positions rather than directional bets.
Summary
Portfolio dynamics this week reflected a decisive shift in tone. Real assets that previously anchored performance turned lower, equity trends weakened, and crypto remained deeply negative. Gains in bonds and isolated agricultural contracts helped offset some of the broad market pressure, but overall trend conditions deteriorated as the TTU Trend Barometer fell to 45 percent. Trend followers entered a more defensive phase, leaning on short exposure in softs and crypto, reducing long positions elsewhere, and relying on risk controls to navigate a week defined by correlated selling rather than opportunity.
Final Reflections – When the Tide Turns
The third week of November brought a decisive shift in market tone. What had been a controlled and uneven environment earlier in the month gave way to broad weakness across equities, commodities and crypto. The pullback was not dramatic in a single sector. It was widespread and persistent, with only a handful of defensive markets holding their ground. Volatility surged, equities slipped, energy and metals weakened, and softs and crypto extended their breakdowns. The calm surface that characterised the earlier part of November has clearly fractured.
The SG Trend Index now sits at plus 0.06 percent month to date and minus 0.83 percent for the year. The TTU Trend Barometer closed at 48 percent, marking a move back into softer territory and reflecting a loss of alignment across the opportunity set. Trend structure did not collapse, but it deteriorated enough to shift conditions from usable to fragile. The momentum seen in real assets earlier in the month has faded, and the week’s selling pressure has left many trends vulnerable to further reversal.
Three observations capture the essence of the week:
- Trend conditions have weakened. A barometer reading at 45 percent signals an environment where opportunities remain, but they are fewer and more dispersed. Selectivity has become essential and broad participation is no longer present.
- Downside momentum is now clearer than upside momentum. Soft commodities, crypto and parts of the energy complex delivered some of the strongest moves, but almost all in the wrong direction. Real assets no longer lead. Instead, they are adjusting to the same pressure seen across the wider market.
- Equity markets no longer mask rotation. The gentle stability of recent weeks has given way to visible stress, with global indices turning lower and leadership narrowing even further. Systematic portfolios have been reducing risk rather than leaning into equity exposure.
The message for now is straightforward. The tide has turned. Trend conditions are weaker, correlations are tightening, and volatility has returned. This is a market where discipline matters more than conviction and where protective rules hold greater value than directional views. Systems that remain diversified, patient and grounded in process are best placed to navigate the next phase as markets search for their footing.

List of Resources used in the Week in Review
Important Disclaimers
This document is directly solely to Accredited Investors, Qualified Eligible Participants, Qualified Clients and Qualified Purchasers. No investment decision should be made until prospective investors have read the detailed information in the fund offering documents of any manager mentioned in this document. This document is furnished on a confidential basis only for the use of the recipient and only for discussion purposes and is subject to amendment This document is neither advice nor a recommendation to enter into any transaction. This document is not an offer to buy or sell, nor a solicitation of an offer to buy or sell, any security or other financial instrument. This presentation is based on information obtained from sources that TopTradersUnplugged (“TTU”) (“considers to be reliable however, TTU makes no representation as to, and accepts no responsibility or liability for, the accuracy or completeness of the information. TTU has not independently verified third party manager or benchmark information, does not represent it as accurate, true or complete, makes no warranty, express or implied regarding it and shall not be liable for any losses, damages, costs or expenses relating to its adequacy, accuracy, truth, completeness or use.
All projections, valuations, and statistical analyses are provided to assist the recipient in the evaluation of the matters described herein. Such projections, valuations and analyses may be based on subjective assessments and assumptions and may use one among many alternative methodologies that produce different results accordingly, such projections, valuations and statistical analyses should not be viewed as facts and should not be relied upon as an accurate prediction of future events. There is no guarantee that any targeted performance will be achieved Commodity trading involves substantial risk of loss and may not be suitable for everyone
TTU is not and does not purport to be an advisor as to legal, taxation, accounting, financial or regulatory matters in any jurisdiction. The recipient should independently evaluate and judge the matters referred to herein. TTU does not provide advice or recommendations regarding an investor’s decision to allocate to funds or accounts managed by any manager (“or to maintain or sell investments in funds or accounts managed by any manager, and no fiduciary relationship under ERISA is created by the investor investing in funds or accounts managed by any manager, or through any communication between TTU and the investor
In reviewing this document, it should be understood that the past performance results of any asset class, or any investment or trading program set forth herein, are not necessarily indicative of any future results that may be achieved in connection with any transaction. Any persons subscribing for an investment must be able to bear the risks involved and must meet the suitability requirements relating to such investment. Some or all alternative investment programs discussed herein may not be suitable for certain investors This document is directed only to persons having professional experience in matters relating to investments. Any investment or investment activity to which this document relates is available only to such investment professionals. Persons who do not have professional experience in matters relating to investments should not rely upon this document.
This document and its contents are proprietary information of TTU and may not be reproduced or otherwise disseminated in whole or in part without TTU’s prior written consent.
This document contains simulated or hypothetical performance results that have certain inherent limitations AND SHOULD BE VIEWED FOR ILLUSTRATIVE PURPOSES. Unlike the results shown in an actual performance record, these results do not represent actual trading. HYPOTHETICAL PERFORMANCE RESULTS HAVE MANY INHERENT LIMITATIONS, SOME OF WHICH ARE DESCRIBED BELOW. NO REPRESENTATION IS BEING MADE THAT ANY ACCOUNT WILL OR IS LIKELY TO ACHIEVE PROFITS OR LOSSES SIMILAR TO THOSE SHOWN IN FACT, THERE ARE FREQUENTLY SHARP DIFFERENCES BETWEEN HYPOTHETICAL PERFORMANCE RESULTS AND THE ACTUAL RESULTS SUBSEQUENTLY ACHIEVED BY ANY PARTICULAR INVESTMENT ACCOUNT.
ONE OF THE LIMITATIONS OF HYPOTHETICAL PERFORMANCE RESULTS IS THAT THEY ARE GENERALLY PREPARED WITH THE BENEFIT OF HINDSIGHT IN ADDITION, HYPOTHETICAL TRADING DOES NOT INVOLVE FINANCIAL RISK, AND NO HYPOTHETICAL TRADING RECORD CAN COMPLETELY ACCOUNT FOR THE IMPACT OF FINANCIAL RISK IN ACTUAL TRADING FOR EXAMPLE, THE ABILITY TO WITHSTAND LOSSES OR TO ADHERE TO A PARTICULAR TRADING PROGRAM OR OTHER ASSET.
There are numerous other factors related to the markets in general or to the implementation of any specific trading program which cannot be fully accounted for in the preparation of hypothetical performance results and all of which can adversely affect actual trading results. No representation is being made that any investment will or is likely to achieve profits or losses similar to those being shown.
Most Comprehensive Guide to the Best Investment Books of All Time

Most Comprehensive Guide to the Best Investment Books of All Time
Get the most comprehensive guide to over 600 of the BEST investment books, with insights, and learn from some of the wisest and most accomplished investors in the world. A collection of MUST READ books carefully selected for you. Get it now absolutely FREE!
Get Your FREE Guide HERE!