


Trend Following - Week in Review - November 7, 2025

“From Friction to Fragmentation”
This Week in Trend – 7 November 2025
Welcome to This Week in Trend, your lens into the shifting dynamics of global futures markets and the evolving landscape of systematic trend following.
This edition reflects conditions through the close of US markets on Friday 7 November 2025. The first week of November unfolded as a battle of opposing forces rather than a unified directional drive. While volatility and energy found renewed traction, risk assets fractured, crypto reversed sharply, equities lost rhythm, and commodities broke into isolated surges and retreats.
The SG Trend Index drifted lower, underscoring a landscape defined more by dispersion than decay. After October’s strong ignition phase, trend structure is now grinding through friction. The TTU Trend Barometer edged higher to 48 percent, revealing a neutral yet restless environment where momentum exists but refuses to synchronize.
What was once a coordinated advance has fragmented into competing micro trends. Correlations loosened, volatility stirred, and conviction thinned. The result is a market suspended between persistence and recalibration, a reminder that in the transition between cycles, friction often comes before coherence.
SG Trend Index Performance
- Month-to-date (as of Nov 7): −0.49%
- Year-to-date: −1.37%
- Previous week: +1.91% MTD | −0.39% YTD
The SG Trend Index slipped back into negative territory during the first week of November, reversing much of October’s late strength. Early gains in energy and grains were outweighed by declines in equities, crypto, and soft commodities, leading to renewed dispersion. The move highlights how fragile recent momentum has been, as leadership narrowed and trend coherence weakened.
After a brief recovery phase, the index now reflects a market struggling to maintain alignment. Directional conviction remains uneven, with trend systems rotating between opportunity and caution. The transition from October’s ignition to November’s fragmentation underscores the difficulty of sustaining coordinated strength when breadth contracts.
TTU Trend Barometer
- Current reading: 48 percent – Neutral
- Previous reading: 39 percent
- 10-day rate of change: Rising Weekly
Trend strength improved modestly this week, with the TTU Trend Barometer rising from 39 to 48 percent. The move signals a recovery from late October’s weakness, though the environment remains balanced rather than directional. The improvement was supported by renewed energy strength and a rebound in volatility, while crypto and equities lost cohesion.
At 48 percent, the trend environment sits in the middle of the neutral range, suggesting that systems are beginning to find selective opportunities but still lack broad participation. Correlations remain loose, and volatility is reasserting itself as markets test new short-term ranges. Momentum is returning, yet alignment remains incomplete—a sign that friction, not flow, defines the current landscape.
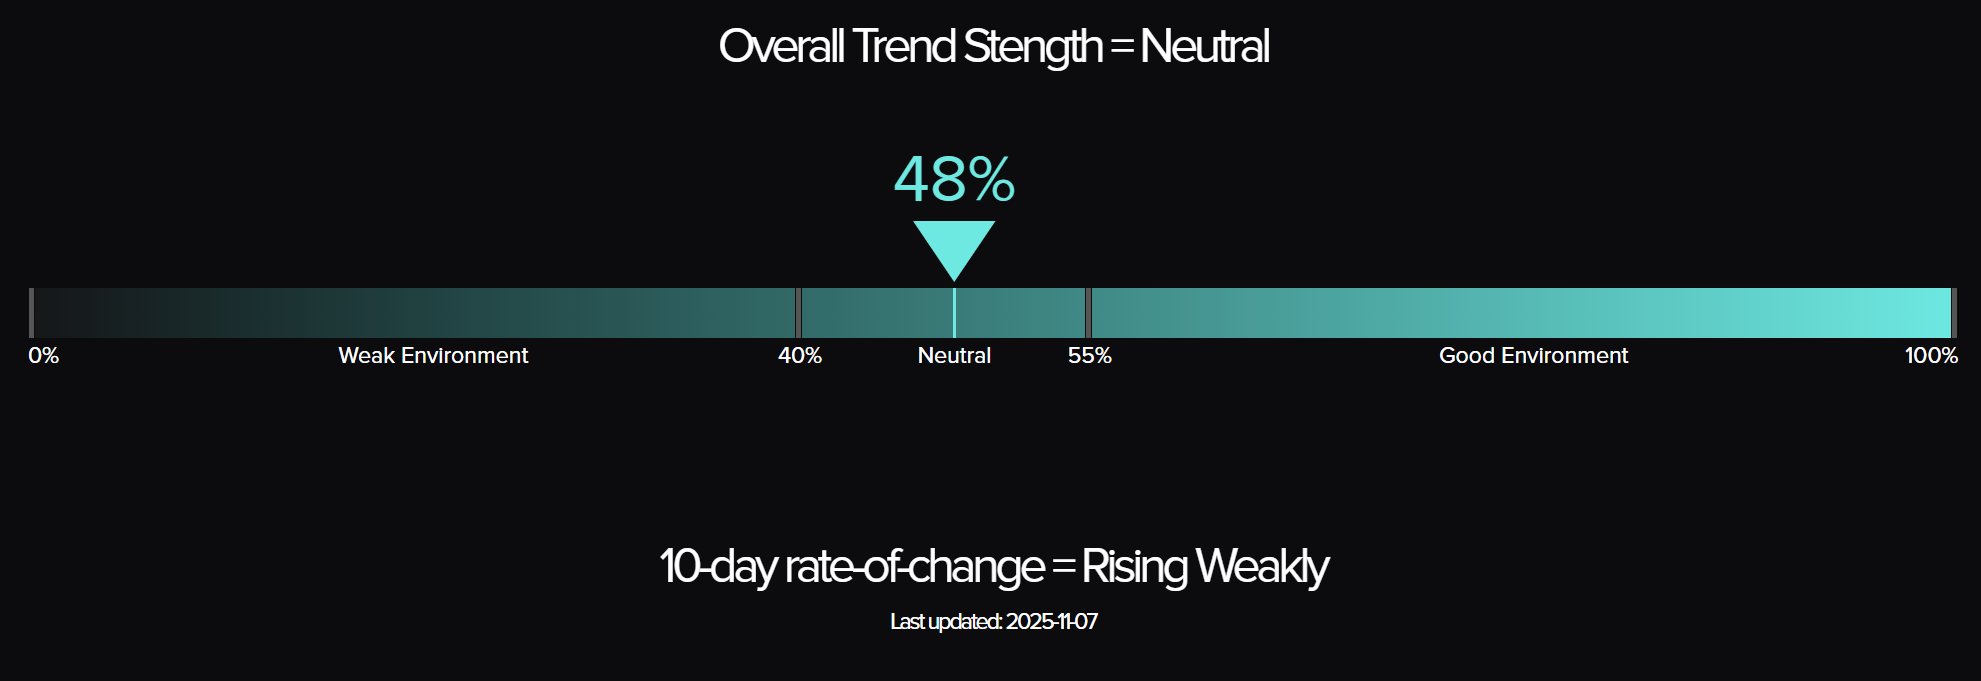
The Top Traders Unplugged (TTU) Trend Barometer is a proprietary tool that measures the percentage of markets with medium to strong trends. Similar to a thermometer, where 0 degrees Celsius equates to freezing, a TTU Trend Barometer reading below 40% indicates a “cold” environment for trend-following, while readings above 55% signal a “hotter,” more favourable trend environment.
Weekly Asset Class Snapshot
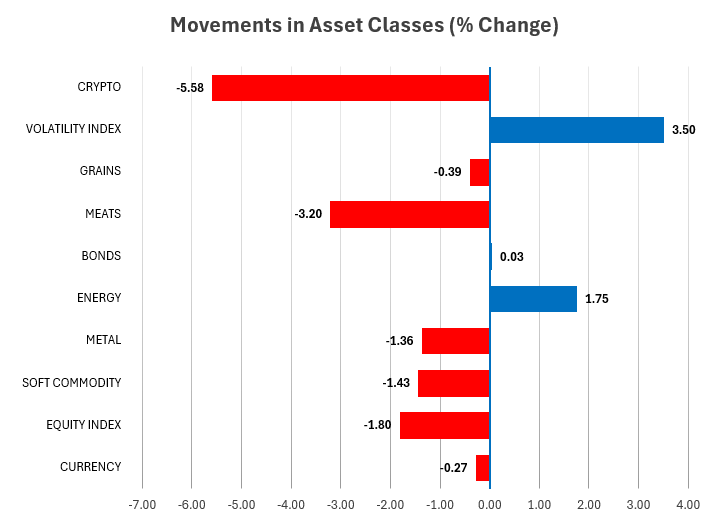
Source: Finwiz.com
- Volatility Index (+3.50% | prev +2.48%)
Volatility continued to rise for a second week, reinforcing the sense of instability emerging across markets. The VIX built on last week’s rebound as equities faltered and crypto sold off, signalling a transition from calm to cautious uncertainty. The tone remains measured rather than fearful, but volatility is once again asserting its influence on cross-asset behaviour. - Metals (−1.36% | prev −1.45%)
Metals extended their weakness, marking the third consecutive week of decline. Gold and silver were little changed, while industrial metals such as copper and palladium softened further amid sluggish demand and a firmer US dollar. The group remains a laggard, continuing to erode portfolio diversification benefits that once stemmed from its earlier September strength. - Crypto (−5.58% | prev −1.24%)
Digital assets fell sharply, reversing the mild losses of the previous week. Bitcoin led the slide as sentiment weakened and liquidity tightened, breaking the fragile rebound seen in late October. Systematic models have largely stepped aside from the sector, with the breakdown reinforcing caution across risk assets. - Energy (+1.75% | prev +1.72%)
Energy maintained upward momentum, marking a third consecutive week of gains. Natural gas surged on seasonal demand, while crude and refined products held firm but lacked strong follow-through. The sector remains a key anchor for trend portfolios, though dispersion within the complex continues to rise. - Soft Commodities (−1.43% | prev −2.84%)
Softs declined again but at a slower pace. Coffee rebounded strongly, but losses in cocoa, cotton, and orange juice offset those gains. The sector remains volatile and directionless, with systems paring back exposure as price signals conflict. - Equity Index (−1.80% | prev +0.85%)
Equities reversed course after three weeks of gains. The Nikkei and Nasdaq led the decline, while European indices flattened near highs. The pullback reflected profit-taking and renewed risk aversion, with systems trimming long exposure as volatility expanded and breadth narrowed further. - Grains (−0.39% | prev +3.98%)
Grains lost traction after last week’s strong performance. Soybeans and meal held firm, but wheat and oats retreated. The sector’s leadership has faded, leaving mixed signals that highlight the fragility of recent agricultural momentum. - Meats (−3.20% | prev −2.40%)
Meats extended losses for a fourth consecutive week. Feeder and live cattle both weakened further as supply adjustments and softening demand continued to weigh on prices. The sector remains a persistent drag on trend portfolios. - Bonds (+0.03% | prev +0.32%)
Fixed income held steady after two weeks of modest gains. Yields were little changed across the curve, reflecting a wait-and-see stance by traders following a volatile October. Bonds continue to provide mild portfolio stability but lack clear directional impulse. - Currencies (−0.27% | prev −0.46%)
Currency markets remained subdued. The US dollar inched higher, pressuring commodity-linked currencies such as the AUD and NZD, while EUR and GBP were steady. Trend structure across FX remains weak, with systems maintaining balanced or low-conviction exposure.
Summary:
Volatility’s continued rise contrasted with declining risk appetite in equities and crypto, confirming a shift from cohesion to fragmentation. Energy and bonds offered stability, but most other sectors weakened or drifted. The overall tone reflects a market in transition, where trends exist but lack synchrony, and friction rather than momentum defines the cross-asset landscape.
Performance Highlights – This Week’s Market Leaders & Laggards
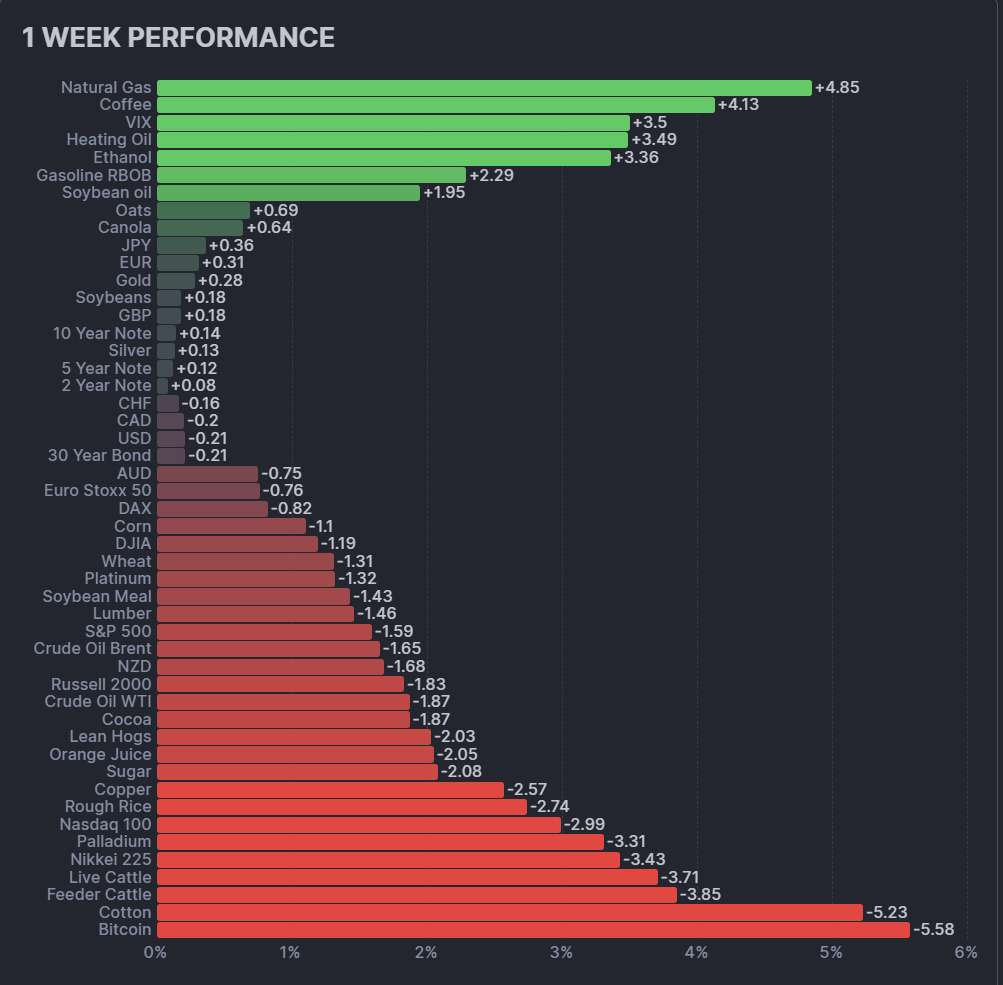
Top Market Movers
Top Gainers
- Natural Gas +4.85% – Seasonal Strength Returns
Natural gas led the market this week, rebounding sharply as colder weather forecasts and rising heating demand lifted prices. After weeks of softness, the move marked a significant technical turnaround, restoring confidence to energy trend models. - Coffee +4.13% – Supply Strain Sparks Rebound
Coffee surged following tightening supply expectations and shipping delays from key producing regions. The rally reversed part of October’s decline and re-established coffee as one of the few softs showing renewed upward momentum. - VIX +3.50% – Volatility Reawakens
The volatility index extended its advance, reflecting renewed defensive positioning as equities lost traction. The rise signals heightened sensitivity to risk and an environment where portfolio correlations are starting to loosen again.
Top Losers
- Bitcoin −5.58% – Risk Appetite Evaporates
Crypto markets tumbled as speculative flows reversed. Bitcoin’s sharp decline erased the prior month’s modest rebound and reintroduced instability to a sector that had been gradually regaining trend structure. - Feeder Cattle −5.23% – Correction Deepens
Livestock markets continued to weaken as feed costs eased and buyer demand moderated. Feeder cattle extended their multi-week slide, confirming a structural correction after an extended rally earlier in the year. - Live Cattle −3.85% – Meat Complex Under Pressure
Live cattle joined feeder cattle in retreat, adding further weight to the broader decline across the meats sector. The downtrend has now become entrenched, with systems steadily reducing exposure to limit drawdown risk.
Summary:
This week’s leadership rotated decisively toward defensive and seasonal themes. Energy regained short-term strength through natural gas, while softs such as coffee found footing on supply stress. Meanwhile, crypto and meats absorbed the bulk of the pressure, underscoring how trend persistence has narrowed into fewer, isolated opportunities.
Portfolio View - Positioning and Impact
Equities: Equity markets reversed this week as recent momentum gave way to consolidation. The Nasdaq and Nikkei, which had led through October, slipped alongside broader global indices. European markets held near recent highs but failed to extend gains. Trend systems trimmed exposure across developed markets as rising volatility and narrowing leadership signaled weakening structure. The overall bias remains lightly long to neutral, with capital preservation taking precedence over directional conviction.
Metals: Metals continued to soften. Gold and silver traded flat, while industrial metals such as copper and palladium edged lower. The group remains under pressure from a firmer US dollar and subdued macro sentiment. Systems maintain small residual exposure, but leverage has been further reduced as momentum fades and mean reversion dominates short-term movement.
Energy: Energy remains one of the few consistent contributors. Natural gas surged on weather-related demand, while crude and refined products were steady but range-bound. The sector retains a positive tilt, though conviction has moderated as dispersion within the complex increases. Trend systems continue to hold long exposure, particularly in gas and heating products, but with tighter stops and reduced sizing to manage volatility.
Crypto: Crypto markets experienced renewed weakness. Bitcoin and Ethereum led declines, breaking below short-term support levels. The retracement wiped out October’s limited recovery, leaving the sector structurally fragile. Systematic exposure remains minimal or flat, with models awaiting a clear directional reset before re-entry.
Softs and Meats: Soft commodities were mixed. Coffee rebounded sharply on supply concerns, but cocoa, cotton, and orange juice fell again. Meats extended their decline, with feeder and live cattle both trending lower. Trend followers have largely unwound long exposure across these sectors, maintaining a defensive stance as structural corrections deepen.
Rates and FX: Fixed income held steady, offering limited diversification benefit. Yields were little changed, suggesting traders are pausing after October’s volatility. In currencies, the US dollar strengthened slightly, weighing on commodity-linked pairs such as AUD and NZD. Trend alignment remains weak, keeping systems in low-conviction, balanced positions.
Summary:
Portfolio dynamics this week reflected fragmentation rather than clear leadership. Energy and volatility provided structure, while equities, crypto, and meats eroded performance. Trend systems remain active but defensive, prioritizing breadth management and volatility control over aggressive directional exposure.
Final Reflections – From Friction to Fragmentation
The first week of November underscored the market’s shift from collective direction to competing forces. Energy and volatility provided pockets of strength, but equities, crypto, and soft commodities fractured, breaking the coherence that briefly returned in October. What had looked like recovery has become recalibration.
The SG Trend Index slipped to −0.49% MTD and −1.37% YTD, reflecting a hesitant start to the month. The TTU Trend Barometer, however, rose to 48%, suggesting that while trend strength is returning, it remains selective and uneven. Momentum has not disappeared, but it is fragmented across isolated markets rather than unified across sectors.
Three takeaways stand out:
- Recovery requires alignment, not activity. The rise in the barometer shows that trends are forming, but without cross-asset coherence, returns remain inconsistent.
- Volatility signals tension, not panic. The VIX’s continued rise points to friction building beneath the surface as traders recalibrate exposure rather than capitulate.
- Energy endures, but leadership has splintered. Natural gas and heating fuels are carrying the load, while other sectors oscillate between drift and divergence.
The takeaway for now: the market is moving from friction to fragmentation. Systems are active but cautious, navigating a neutral environment where edges exist only in pockets. Until participation broadens and coherence returns, trend followers remain in adaptive mode, waiting for the next phase of synchrony to emerge.

List of Resources used in the Week in Review
Important Disclaimers
This document is directly solely to Accredited Investors, Qualified Eligible Participants, Qualified Clients and Qualified Purchasers. No investment decision should be made until prospective investors have read the detailed information in the fund offering documents of any manager mentioned in this document. This document is furnished on a confidential basis only for the use of the recipient and only for discussion purposes and is subject to amendment This document is neither advice nor a recommendation to enter into any transaction. This document is not an offer to buy or sell, nor a solicitation of an offer to buy or sell, any security or other financial instrument. This presentation is based on information obtained from sources that TopTradersUnplugged (“TTU”) (“considers to be reliable however, TTU makes no representation as to, and accepts no responsibility or liability for, the accuracy or completeness of the information. TTU has not independently verified third party manager or benchmark information, does not represent it as accurate, true or complete, makes no warranty, express or implied regarding it and shall not be liable for any losses, damages, costs or expenses relating to its adequacy, accuracy, truth, completeness or use.
All projections, valuations, and statistical analyses are provided to assist the recipient in the evaluation of the matters described herein. Such projections, valuations and analyses may be based on subjective assessments and assumptions and may use one among many alternative methodologies that produce different results accordingly, such projections, valuations and statistical analyses should not be viewed as facts and should not be relied upon as an accurate prediction of future events. There is no guarantee that any targeted performance will be achieved Commodity trading involves substantial risk of loss and may not be suitable for everyone
TTU is not and does not purport to be an advisor as to legal, taxation, accounting, financial or regulatory matters in any jurisdiction. The recipient should independently evaluate and judge the matters referred to herein. TTU does not provide advice or recommendations regarding an investor’s decision to allocate to funds or accounts managed by any manager (“or to maintain or sell investments in funds or accounts managed by any manager, and no fiduciary relationship under ERISA is created by the investor investing in funds or accounts managed by any manager, or through any communication between TTU and the investor
In reviewing this document, it should be understood that the past performance results of any asset class, or any investment or trading program set forth herein, are not necessarily indicative of any future results that may be achieved in connection with any transaction. Any persons subscribing for an investment must be able to bear the risks involved and must meet the suitability requirements relating to such investment. Some or all alternative investment programs discussed herein may not be suitable for certain investors This document is directed only to persons having professional experience in matters relating to investments. Any investment or investment activity to which this document relates is available only to such investment professionals. Persons who do not have professional experience in matters relating to investments should not rely upon this document.
This document and its contents are proprietary information of TTU and may not be reproduced or otherwise disseminated in whole or in part without TTU’s prior written consent.
This document contains simulated or hypothetical performance results that have certain inherent limitations AND SHOULD BE VIEWED FOR ILLUSTRATIVE PURPOSES. Unlike the results shown in an actual performance record, these results do not represent actual trading. HYPOTHETICAL PERFORMANCE RESULTS HAVE MANY INHERENT LIMITATIONS, SOME OF WHICH ARE DESCRIBED BELOW. NO REPRESENTATION IS BEING MADE THAT ANY ACCOUNT WILL OR IS LIKELY TO ACHIEVE PROFITS OR LOSSES SIMILAR TO THOSE SHOWN IN FACT, THERE ARE FREQUENTLY SHARP DIFFERENCES BETWEEN HYPOTHETICAL PERFORMANCE RESULTS AND THE ACTUAL RESULTS SUBSEQUENTLY ACHIEVED BY ANY PARTICULAR INVESTMENT ACCOUNT.
ONE OF THE LIMITATIONS OF HYPOTHETICAL PERFORMANCE RESULTS IS THAT THEY ARE GENERALLY PREPARED WITH THE BENEFIT OF HINDSIGHT IN ADDITION, HYPOTHETICAL TRADING DOES NOT INVOLVE FINANCIAL RISK, AND NO HYPOTHETICAL TRADING RECORD CAN COMPLETELY ACCOUNT FOR THE IMPACT OF FINANCIAL RISK IN ACTUAL TRADING FOR EXAMPLE, THE ABILITY TO WITHSTAND LOSSES OR TO ADHERE TO A PARTICULAR TRADING PROGRAM OR OTHER ASSET.
There are numerous other factors related to the markets in general or to the implementation of any specific trading program which cannot be fully accounted for in the preparation of hypothetical performance results and all of which can adversely affect actual trading results. No representation is being made that any investment will or is likely to achieve profits or losses similar to those being shown.
Most Comprehensive Guide to the Best Investment Books of All Time

Most Comprehensive Guide to the Best Investment Books of All Time
Get the most comprehensive guide to over 600 of the BEST investment books, with insights, and learn from some of the wisest and most accomplished investors in the world. A collection of MUST READ books carefully selected for you. Get it now absolutely FREE!
Get Your FREE Guide HERE!