


Trend Following - Week in Review - October 24, 2025

“Energy Ignites the Trend”
This Week in Trend – 24 October 2025
Welcome to This Week in Trend, your lens into the shifting dynamics of global futures markets and the evolving landscape of systematic trend following.
This edition reflects conditions through the close of US markets on Friday 24 October 2025. The week delivered contrasting signals across asset classes. While the Energy complex roared higher, broader participation remained uneven and the lift to trend portfolios was modest. It was a week of strength without symmetry — where leadership narrowed even as volatility declined.
The standout moves came from Heating Oil, WTI, and Brent, all surging between 7 and 10 percent, yet offset by softness in metals, meats, and volatility-linked instruments. Bonds steadied but failed to advance the momentum seen earlier in October, and the SG Trend Index gave back some of its mid-month gains.
The tone of the week was one of selective ignition rather than broad acceleration. Trend followers saw directional clarity reappear in Energy and Crypto, but dispersion elsewhere kept conviction restrained. After a volatile start to October, the market appears to be transitioning from counter-trend rebound to fragile equilibrium once again.
SG Trend Index Performance
- Month-to-date (as of Oct 24): +2.04%
- Year-to-date: −0.26%
(Previous week: +2.81% MTD | +0.49% YTD)
The SG Trend Index eased modestly as energy and equities strength was offset by softer metals and agriculture. Despite the minor pullback, the index remains positive for the month, suggesting that the recovery phase initiated in mid-October is holding its ground.
This week’s performance reflects consolidation rather than reversal. The rotation of leadership from metals to energy signals that trend capital is re-aligning rather than retreating, and systems continue to benefit from the emergence of new directional structure across crude and refined products.
TTU Trend Barometer
- Current reading: 55 percent: Moderately Positive
- Previous reading: 48 percent
- 10-day rate of change: Rising Steadily
Trend strength improved this week, with the TTU Trend Barometer climbing into the lower bound of a “hotter” environment. The lift was driven primarily by energy and equity trends, while dispersion across metals and softs limited the overall advance. The 55 percent reading signals a constructive backdrop, but one still defined by selective conviction rather than broad alignment.
“The market’s pulse is quickening, but the heartbeat remains irregular.”
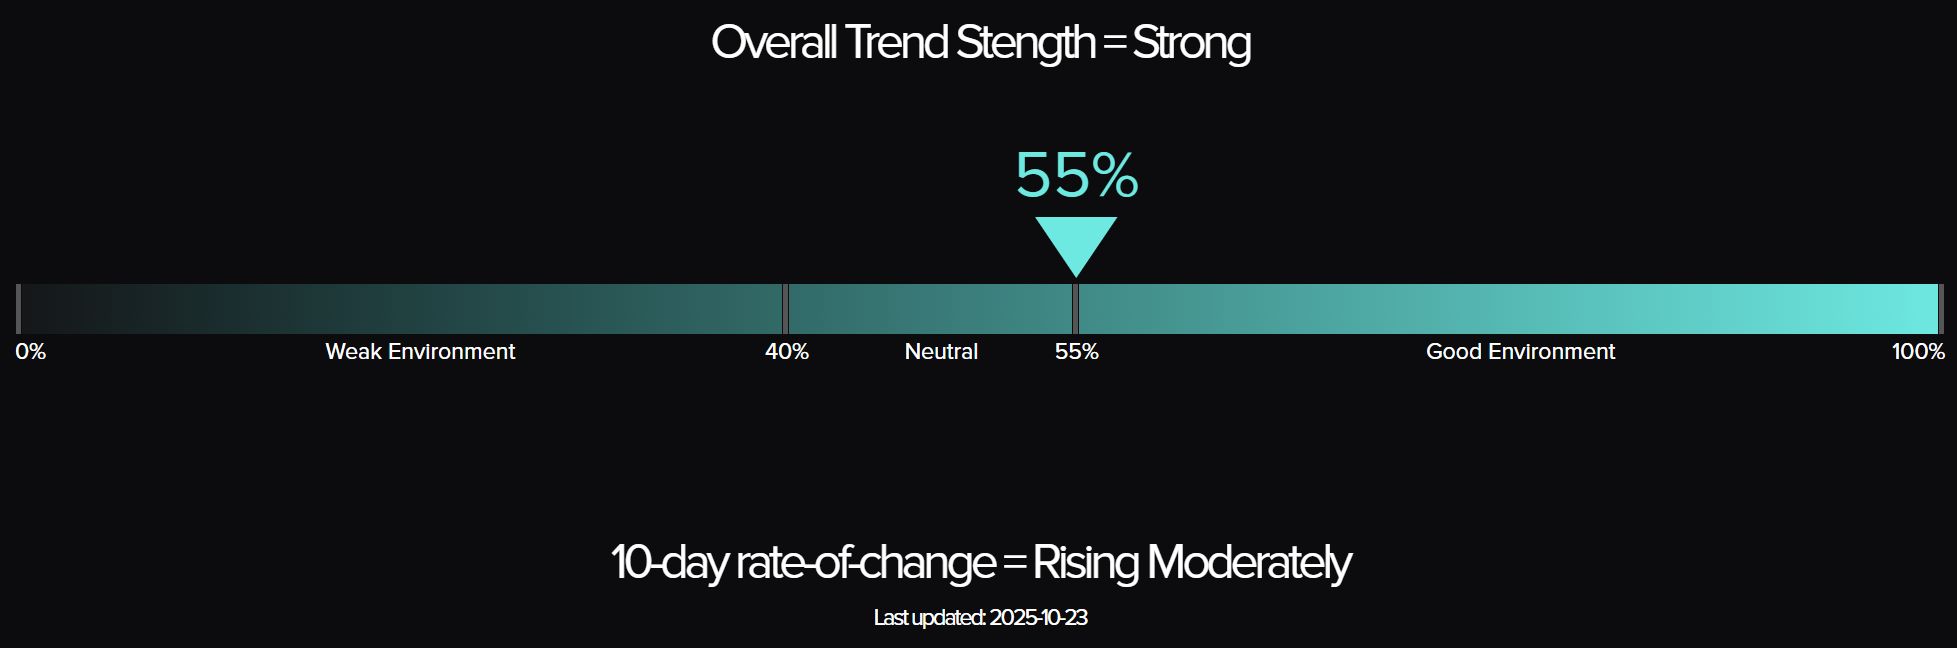
The Top Traders Unplugged (TTU) Trend Barometer is a proprietary tool that measures the percentage of markets with medium to strong trends. Similar to a thermometer, where 0 degrees Celsius equates to freezing, a TTU Trend Barometer reading below 40% indicates a “cold” environment for trend-following, while readings above 55% signal a “hotter,” more favourable trend environment.
Weekly Asset Class Snapshot
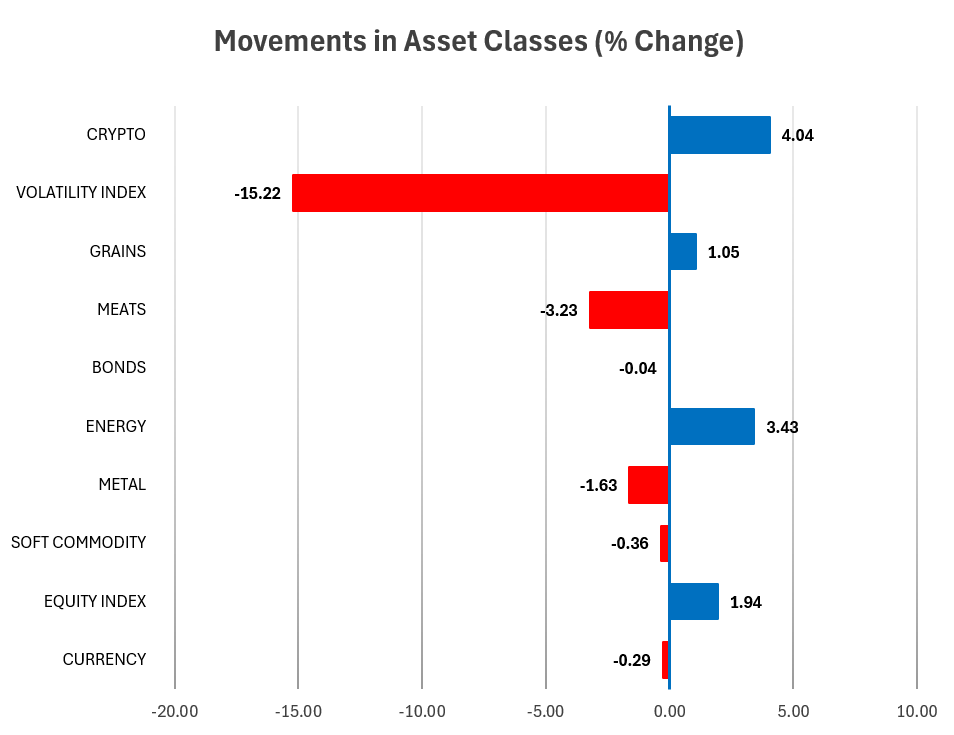
Source: Finwiz.com
- Volatility Index (−15.22% | prev +19.2%)
A decisive collapse in volatility set the tone for the week. The sharp unwind in hedging activity removed a major drag on risk assets and allowed trends in energy and equities to reassert themselves. - Metals (−1.63% | prev +8.8%)
Metals reversed sharply after last week’s surge. Gold and silver paused, while industrial metals softened under renewed risk-on sentiment. The sector shifted from leadership to laggard, offsetting part of the energy advance. - Crypto (+4.04% | prev −7.1%)
Digital assets rebounded strongly as volatility declined. Bitcoin’s steady rise helped restore confidence after several weeks of choppy mean-reverting behaviour. - Energy (+3.43% | prev −2.6%)
The clear standout. Heating Oil, WTI, and Brent all advanced sharply, reigniting directional conviction across trend portfolios. The rally restored structure to an otherwise uneven commodity complex. - Soft Commodities (−0.36% | prev −0.4%)
Largely unchanged on balance. Consolidation continues as coffee and sugar drift lower while cocoa and orange juice stabilise. - Equity Index (+1.94% | prev +1.0%)
Major indices extended gains, buoyed by easing volatility and renewed energy strength. The risk-on tone broadened modestly, though leadership remains narrow. - Grains (+1.05% | prev +0.9%)
Continued modest recovery led by oats and soybean meal. Structural softness persists, but short-covering provided temporary relief. - Meats (−3.23% | prev +1.0%)
A significant reversal. Live and feeder cattle fell sharply after months of steady gains, erasing a key pocket of defensive strength. - Bonds (−0.04% | prev +0.6%)
Duration stabilised but provided little new impetus. Yields held steady, suggesting fixed income remains a neutral contributor. - Currencies (−0.29% | prev +0.4%)
Minor weakness in the USD and crosses reflected a mild recalibration of macro positioning. FX trends remain subdued and non-directional.
Volatility’s retreat was the headline shift this week. Yet, despite the strong showing from energy, dispersion remained wide. Gains were isolated, breadth narrowed, and portfolio-level convexity was maintained but not amplified.
Performance Highlights – This Week’s Market Leaders & Laggards
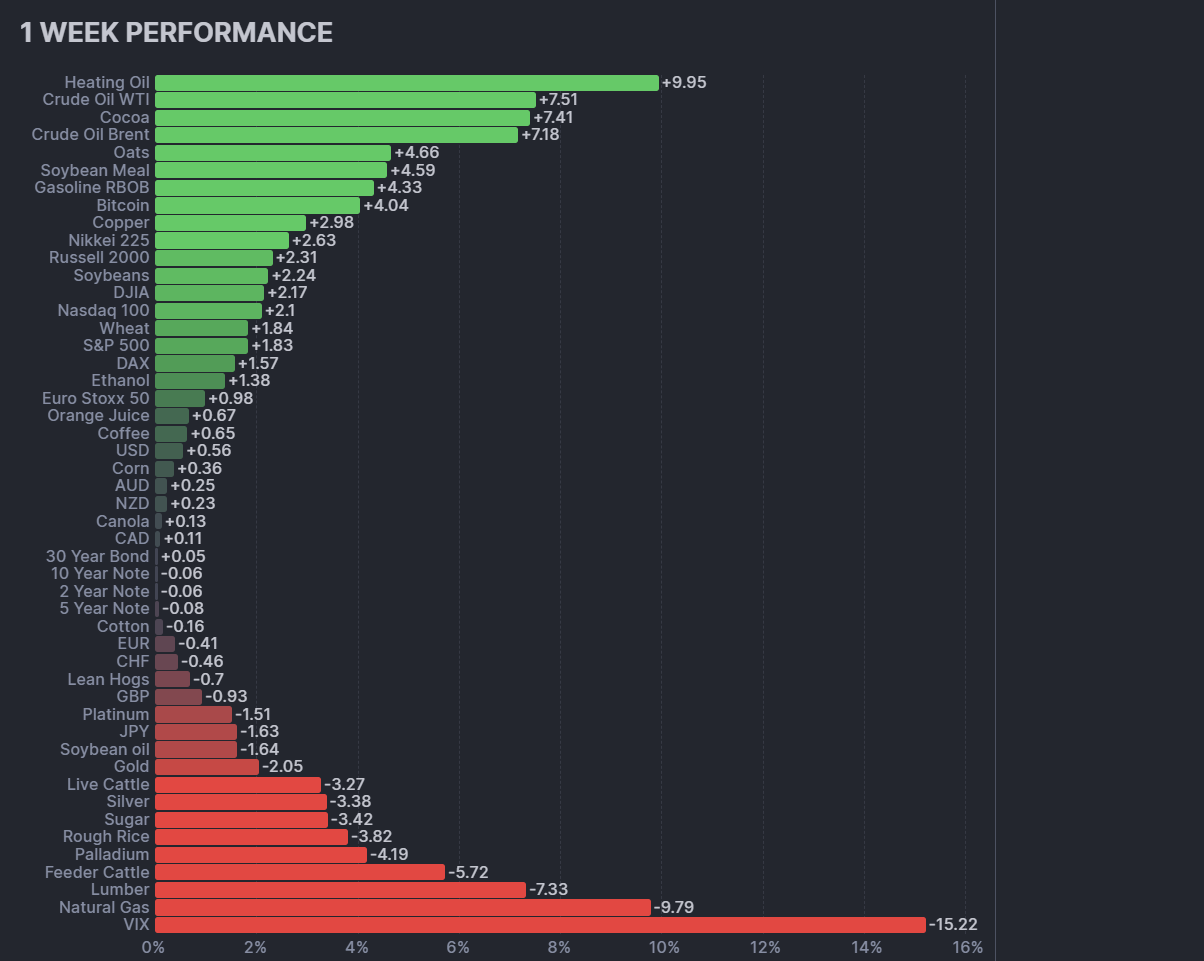
Top Market Movers
Top Gainers
Heating Oil +9.95%: Energy Ignites the Trend
A sharp breakout across refined products drove the energy complex higher. Heating Oil led the charge, registering its strongest weekly gain of the year and restoring directional clarity to trend portfolios.
Crude Oil WTI +7.51% / Brent +7.18%: Synchronized Strength
Both WTI and Brent rallied in unison, confirming a renewed structural uptrend in energy markets. The move came on broad participation and rising refinery margins, reestablishing the sector as the primary engine of momentum.
Cocoa +7.41%: Supply Strains Resurface
Tight global supply and ongoing logistics issues reignited the bull trend in Cocoa. The recovery follows weeks of liquidation and signals possible trend re-engagement in softs.
Top Losers
Volatility Index (VIX) −15.22%: Risk Appetite Returns
Volatility collapsed as risk appetite recovered, marking the steepest decline since early summer. The move removed a key drag on equities and restored calmer cross-asset correlations.
Natural Gas −9.79%: Weather Pressure Mounts
Mild temperature forecasts and rising storage levels sent Natural Gas sharply lower. The long-term trend remains negative, with systems maintaining core short exposure.
Lumber −7.33% / Feeder Cattle −5.72%: Domestic Weakness
Lumber’s decline reflects cooling construction demand, while feeder cattle reversed after months of strength. Both moves contributed to this week’s drag on commodity diversification.
Portfolio View - Positioning and Impact
Equities
Equity markets advanced for a second week, led by the US and Japan. The S&P 500, Nasdaq, and Nikkei all recorded solid gains, aided by a collapse in volatility. Trend models remain modestly long across developed markets but with constrained risk allocation given the narrow leadership profile and stretched momentum signals.
Metals
After recent strength, metals softened. Gold, Silver, and Palladium all declined modestly, while Copper held firm. The sleeve shifted from contributor to mild detractor, as profit-taking replaced defensive flows. Trend models largely maintained existing long exposure but trimmed risk as volatility compressed and momentum waned.
Energy
Energy reasserted dominance. WTI, Brent, and Heating Oil all surged to multi-month highs, reinstating positive skew across trend systems. Long exposure in refined products and crude contributed strongly to portfolio gains. Natural Gas remained the outlier, extending its sharp downtrend and offsetting part of the sector’s overall lift.
Crypto
Crypto turned constructive. Bitcoin advanced more than 4 percent, regaining upward structure and improving signal strength. Trend participation remains low but rising, with systems beginning to re-engage after recent consolidation.
Softs & Meats
Mixed conditions persisted. Softs were directionless, while Meats reversed sharply lower. Live and Feeder Cattle both sold off, unwinding a multi-month uptrend that had provided consistent portfolio support. Trend followers have started to reduce long exposure, waiting for stabilisation before redeployment.
Rates & FX
Bonds were flat to slightly softer across the curve, reflecting muted directional cues. Duration remains neutral to marginally long, acting as ballast but offering limited trend opportunity. FX markets were subdued, with the USD broadly unchanged and no strong signals evident across major pairs.
Final Reflections – Energy Reclaims Leadership Amid Diverging Signals
This week underscored a sharp return of directional structure, though not one built on broad participation. Energy surged to the forefront, driving trend metrics higher and providing much-needed lift to systematic portfolios. Yet beyond this sector, markets remained uneven and hesitant.
The SG Trend Index slipped modestly to +2.04% MTD, reflecting how gains in Energy and Crypto were tempered by reversals in Meats and mild corrections in Metals. The TTU Trend Barometer’s rise to 55% captures the improvement in breadth but also signals that conviction remains selective rather than systemic.
Three takeaways stand out:
1. Leadership can shift fast. The Energy complex flipped from laggard to leader in two weeks, reminding trend followers that robustness, not prediction, governs survival.
2. Volatility contraction hides fragility. The collapse in the VIX masks uneven structure beneath the surface, where short-term reversals still test discipline.
3. Participation beats prediction. Broad exposure across uncorrelated systems continues to be the best defense against narrow, sector-driven markets.
The takeaway for now: Trend conditions are improving but remain concentrated. The next phase will depend on whether Energy’s ignition spreads across the macro landscape, or burns out as another isolated flare.
Until breadth broadens beyond energy and equities, trend environments will remain supportive but not expansive.

List of Resources used in the Week in Review
Important Disclaimers
This document is directly solely to Accredited Investors, Qualified Eligible Participants, Qualified Clients and Qualified Purchasers. No investment decision should be made until prospective investors have read the detailed information in the fund offering documents of any manager mentioned in this document. This document is furnished on a confidential basis only for the use of the recipient and only for discussion purposes and is subject to amendment This document is neither advice nor a recommendation to enter into any transaction. This document is not an offer to buy or sell, nor a solicitation of an offer to buy or sell, any security or other financial instrument. This presentation is based on information obtained from sources that TopTradersUnplugged (“TTU”) (“considers to be reliable however, TTU makes no representation as to, and accepts no responsibility or liability for, the accuracy or completeness of the information. TTU has not independently verified third party manager or benchmark information, does not represent it as accurate, true or complete, makes no warranty, express or implied regarding it and shall not be liable for any losses, damages, costs or expenses relating to its adequacy, accuracy, truth, completeness or use.
All projections, valuations, and statistical analyses are provided to assist the recipient in the evaluation of the matters described herein. Such projections, valuations and analyses may be based on subjective assessments and assumptions and may use one among many alternative methodologies that produce different results accordingly, such projections, valuations and statistical analyses should not be viewed as facts and should not be relied upon as an accurate prediction of future events. There is no guarantee that any targeted performance will be achieved Commodity trading involves substantial risk of loss and may not be suitable for everyone
TTU is not and does not purport to be an advisor as to legal, taxation, accounting, financial or regulatory matters in any jurisdiction. The recipient should independently evaluate and judge the matters referred to herein. TTU does not provide advice or recommendations regarding an investor’s decision to allocate to funds or accounts managed by any manager (“or to maintain or sell investments in funds or accounts managed by any manager, and no fiduciary relationship under ERISA is created by the investor investing in funds or accounts managed by any manager, or through any communication between TTU and the investor
In reviewing this document, it should be understood that the past performance results of any asset class, or any investment or trading program set forth herein, are not necessarily indicative of any future results that may be achieved in connection with any transaction. Any persons subscribing for an investment must be able to bear the risks involved and must meet the suitability requirements relating to such investment. Some or all alternative investment programs discussed herein may not be suitable for certain investors This document is directed only to persons having professional experience in matters relating to investments. Any investment or investment activity to which this document relates is available only to such investment professionals. Persons who do not have professional experience in matters relating to investments should not rely upon this document.
This document and its contents are proprietary information of TTU and may not be reproduced or otherwise disseminated in whole or in part without TTU’s prior written consent.
This document contains simulated or hypothetical performance results that have certain inherent limitations AND SHOULD BE VIEWED FOR ILLUSTRATIVE PURPOSES. Unlike the results shown in an actual performance record, these results do not represent actual trading. HYPOTHETICAL PERFORMANCE RESULTS HAVE MANY INHERENT LIMITATIONS, SOME OF WHICH ARE DESCRIBED BELOW. NO REPRESENTATION IS BEING MADE THAT ANY ACCOUNT WILL OR IS LIKELY TO ACHIEVE PROFITS OR LOSSES SIMILAR TO THOSE SHOWN IN FACT, THERE ARE FREQUENTLY SHARP DIFFERENCES BETWEEN HYPOTHETICAL PERFORMANCE RESULTS AND THE ACTUAL RESULTS SUBSEQUENTLY ACHIEVED BY ANY PARTICULAR INVESTMENT ACCOUNT.
ONE OF THE LIMITATIONS OF HYPOTHETICAL PERFORMANCE RESULTS IS THAT THEY ARE GENERALLY PREPARED WITH THE BENEFIT OF HINDSIGHT IN ADDITION, HYPOTHETICAL TRADING DOES NOT INVOLVE FINANCIAL RISK, AND NO HYPOTHETICAL TRADING RECORD CAN COMPLETELY ACCOUNT FOR THE IMPACT OF FINANCIAL RISK IN ACTUAL TRADING FOR EXAMPLE, THE ABILITY TO WITHSTAND LOSSES OR TO ADHERE TO A PARTICULAR TRADING PROGRAM OR OTHER ASSET.
There are numerous other factors related to the markets in general or to the implementation of any specific trading program which cannot be fully accounted for in the preparation of hypothetical performance results and all of which can adversely affect actual trading results. No representation is being made that any investment will or is likely to achieve profits or losses similar to those being shown.
Most Comprehensive Guide to the Best Investment Books of All Time

Most Comprehensive Guide to the Best Investment Books of All Time
Get the most comprehensive guide to over 600 of the BEST investment books, with insights, and learn from some of the wisest and most accomplished investors in the world. A collection of MUST READ books carefully selected for you. Get it now absolutely FREE!
Get Your FREE Guide HERE!