


Trend Following - Week in Review - October 3, 2025
“Metallic Momentum, Broadening Strength”
This Week in Trend – 3 October 2025
Welcome back to This Week in Trend, your weekly pulse check on global futures and the state of systematic trend following.
The TTU Trend Barometer slipped to 48 percent, down from 52 percent last week, moving from “strong” back into “neutral” territory. Breadth has narrowed slightly, even as crypto and industrial metals delivered standout moves.
The SG Trend Index was nearly flat at +0.13% MTD, leaving YTD at −2.14%. This compares with last week’s +4.52% MTD and −3.38% YTD, when metals ignited broad strength. The October open has already proven uneven: crypto surged, but energy and softs collapsed, muting overall performance.
SG Trend Index Performance
- Month-to-date (as of Oct 3): +0.13%
- Year-to-date: -2.14%
(Previous week: +4.52% MTD | -3.38% YTD)
Momentum slowed after September’s recovery. Crypto and copper provided lift, but energy’s collapse and cocoa’s crash left portfolios mixed.
TTU Trend Barometer
- Current reading: 48 percent – Neutral
- Previous reading: 52 percent
- 10-day rate of change: Rising weakly
Last week metals reignited breadth, pushing conditions into strong territory. This week, the collapse in energy and softs reversed part of that strength, dragging the barometer back into neutral.
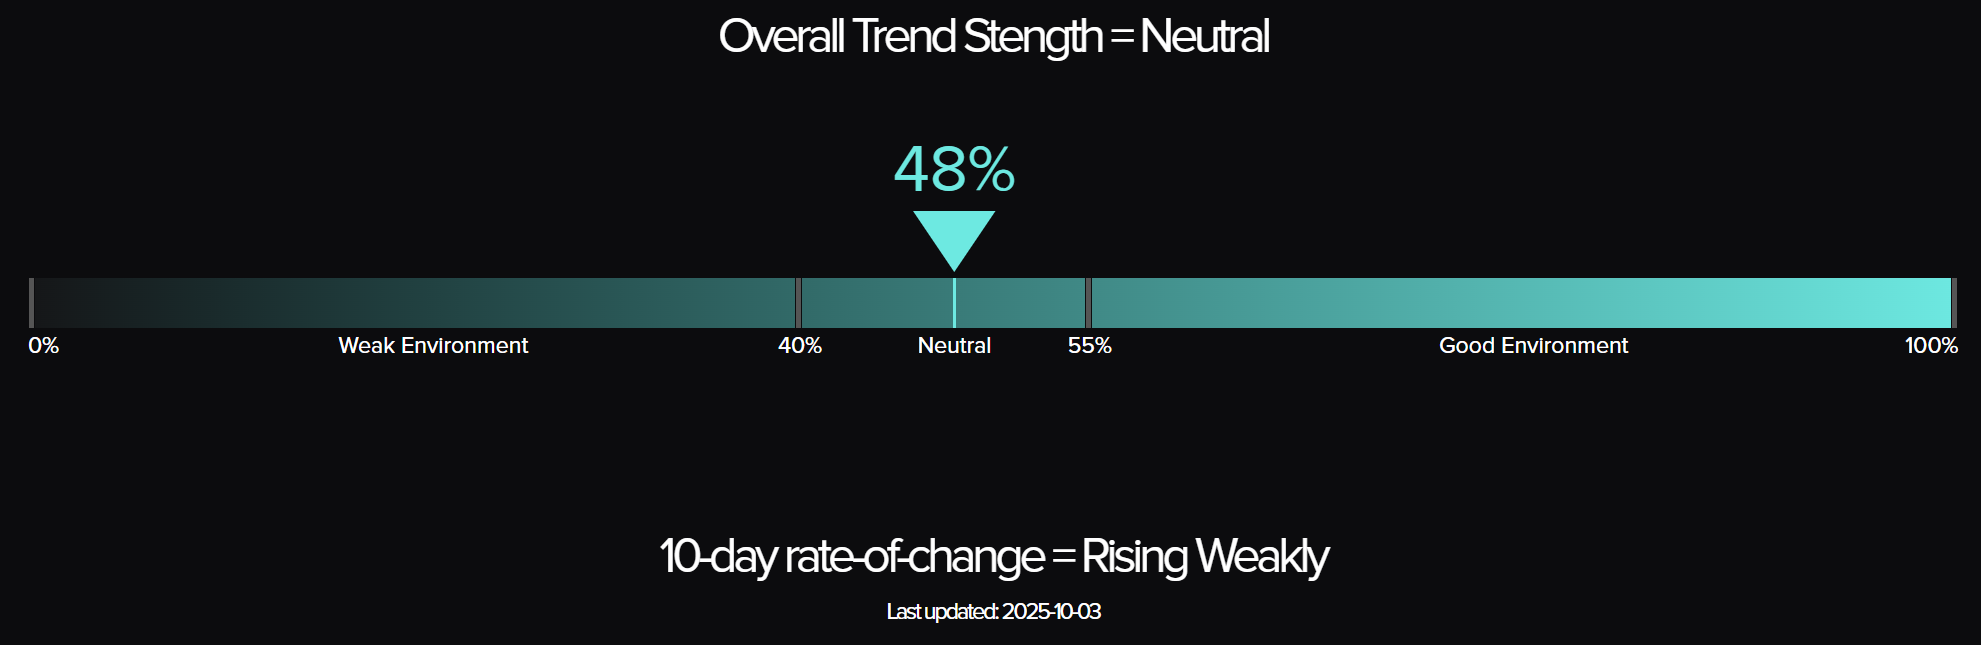
The Top Traders Unplugged (TTU) Trend Barometer is a proprietary tool that measures the percentage of markets with medium to strong trends. Similar to a thermometer, where 0 degrees Celsius equates to freezing, a TTU Trend Barometer reading below 40% indicates a “cold” environment for trend-following, while readings above 55% signal a “hotter,” more favourable trend environment.
Weekly Asset Class Snapshot
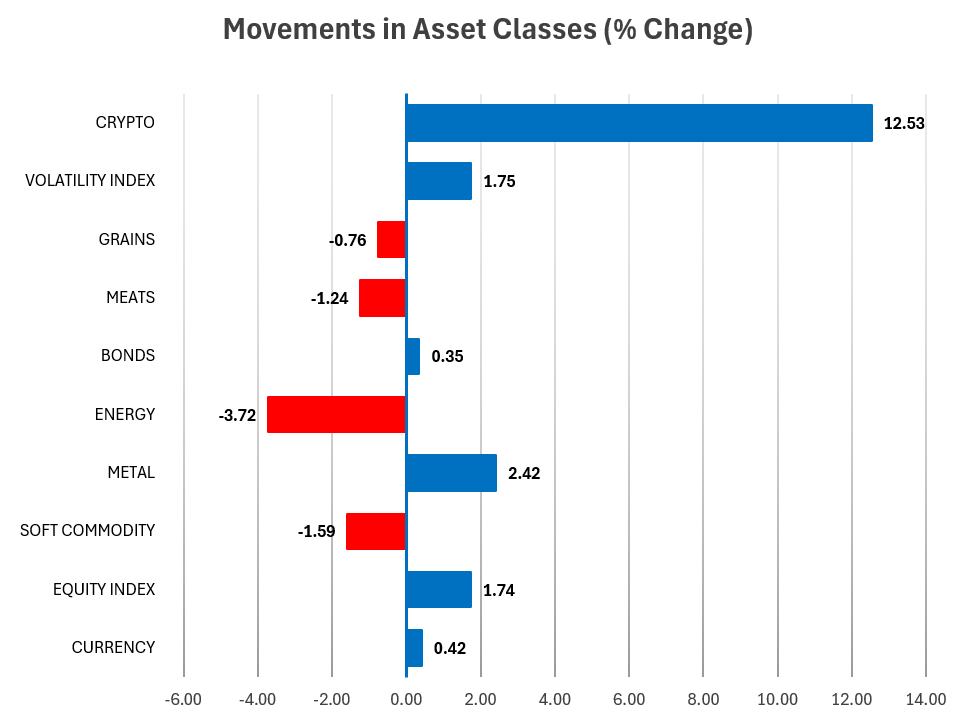
Source: Finwiz.com
- Crypto (+12.5% | prev −5.2%) – From worst to best in a single week. Bitcoin’s sharp rebound dominated sentiment, highlighting crypto’s asymmetric impact.
- Metals (+2.4% | prev +7.3%) – Still positive but less explosive than last week’s breakout, when palladium, platinum, and silver posted huge gains. Copper and silver carried momentum, palladium lagged.
- Equities (+1.7% | prev +0.7%) – Broader leadership this week, led by Europe and Japan, versus last week’s narrower U.S. strength.
- Volatility (+1.8% | prev −4.6%) – A reversal. VIX ticked higher after last week’s slide, reflecting commodity whipsaws.
- Energy (−3.7% | prev +2.5%) – The largest swing. Last week, crude and heating oil rallied strongly; this week, they collapsed 7–8%.
- Softs (−1.6% | prev −0.5%) – Losses deepened. Cocoa fell double-digits after only a mild drop last week.
- Meats (−1.2% | prev +1.8%) – A sharp reversal from steady gains last week in lean hogs and cattle.
- Grains (−0.8% | prev −1.8%) – Still under pressure, though declines were less severe than the week before.
- Bonds (+0.35% | prev flat) – Slightly supportive this week, after being neutral last week.
- Currencies (+0.42% | prev mixed) – Firmer direction this week (EUR, GBP, JPY higher vs USD), compared to a split performance previously.
Performance Highlights – This Week’s Market Leaders & Laggards
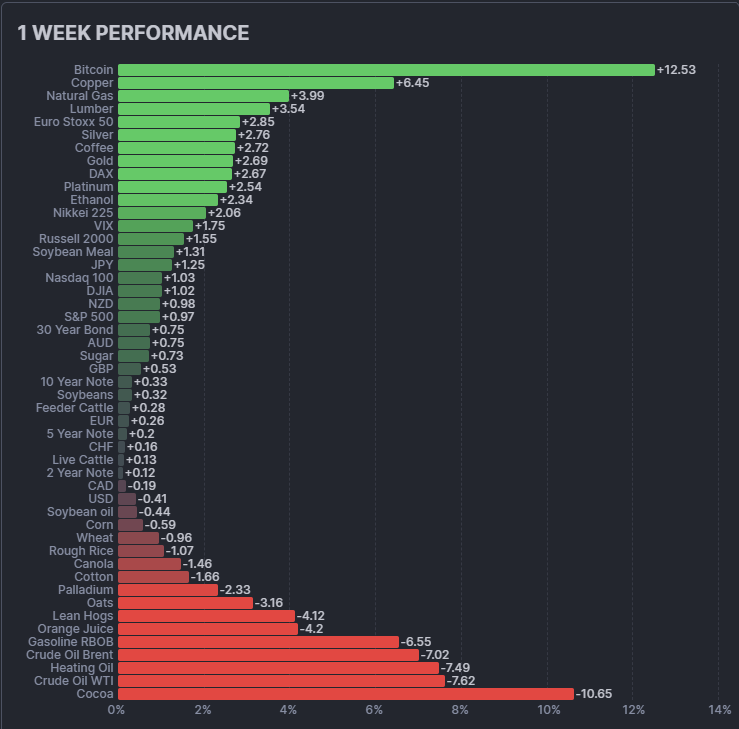
Top Market Movers
Top Gainers
Bitcoin +12.5% — Risk appetite concentrated in crypto
Bitcoin broke above USD 120,000 for the first time since August, boosted by inflows into Bitcoin spot ETFs, renewed institutional demand, and speculation around a Fed pivot. Traders also pointed to so-called ‘Uptober’ seasonality — the historical pattern of October strength in Bitcoin — as reinforcing momentum. Extended technicals suggest volatility risk remains, but for now crypto is once again behaving like a high-beta diversifier.
Copper +6.5% — Industrial metals extend breakout
Copper surged on supply shock headlines from Indonesia’s Grasberg mine, which halted operations after a mud rush, removing ~4% of global output. Against a backdrop of energy transition and infrastructure demand, copper decoupled from oil and reinforced its role as a structural growth metal.
Natural Gas +4.0% — Energy outlier in a weak sector
While crude collapsed, natural gas held firm, supported by localized supply constraints, seasonal heating demand, and tactical positioning. The divergence highlights that energy weakness is not uniform, offering trend followers potential rotation within the sector.
Euro Stoxx 50 +2.9% — Europe continues leadership
European equities led global indices. Relative stability in the eurozone, compared with U.S. fiscal gridlock, underpinned flows into European assets. The outperformance of Euro Stoxx and DAX reinforced equities’ constructive role in systematic portfolios.
Silver +2.8% — Precious metals tailwind held firm
Silver rallied in tandem with gold and copper, reflecting its dual role as a store of value and industrial input. Unlike palladium, silver sustained momentum, suggesting demand breadth across both investment and industry channels.
Top Losers
Cocoa −10.7% — Severe drawdown caps softs
Cocoa plunged to its lowest levels in nearly a year. The selloff reflects increased supply expectations from West African producers incentivized by higher farm-gate prices, along with weaker demand as global grindings slow. After last year’s weather-driven rally, the market is experiencing sharp mean reversion.
WTI −7.6% / Brent −7.0% / Heating Oil −7.5% — Energy complex collapses
Oil’s collapse came from a confluence of factors: OPEC+ signaling higher output, inventory builds, and weaker demand outlooks. China’s inventory cycles and trade friction pressures added to the downside. The sharp fall undermined one of the stronger commodity trend anchors of recent months.
Lean Hogs −4.1% / OJ −4.2% — Agricultural weakness
Lean hogs dropped on weaker demand and margin pressure in livestock, while orange juice fell as weather signals eased supply concerns. These moves reinforced softness across the agricultural complex, compounding cocoa’s slide.
Palladium −2.3% — Diverged from other precious metals
Palladium lagged its peers despite strong gains in gold, silver, and platinum. The divergence likely reflects industrial demand concerns in auto catalysts and profit-taking after prior rallies, underscoring that not all precious metals are trading on the same drivers.
Portfolio View - Positioning and Impact
- Equities: Leadership from Europe and Japan reinforced the constructive tone. Relative stability in monetary and regulatory backdrops in these regions attracted flows, while U.S. equities consolidated near highs amid policy and earnings uncertainty. For trend models, exposures are likely being maintained, though with less concentration in U.S. indices until breakouts confirm.
- Metals: Copper and silver were strong contributors, supported by both structural and tactical demand. Palladium’s underperformance, however, highlights that not all metals are aligned. Systematic portfolios are likely overweight metals, but managers will remain alert to intra-sector divergence.
- Energy: The collapse in crude and heating oil was the largest reversal risk of the week. Trend systems that had been long were likely forced to cut or even flip, reducing the sector from trend anchor to drag. Energy allocations now sit in defensive territory until a clearer directional move re-establishes.
- Crypto: Bitcoin’s outsized surge provided an asymmetric lift — a rare diversifier with meaningful upside in an otherwise uneven environment. Systematic portfolios with crypto exposure likely saw outsized short-term gains, though models will remain wary of volatility and reversal risk.
- Softs & Meats: Cocoa’s crash, alongside losses in orange juice and lean hogs, weighed heavily on diversified commodity baskets. For systematic traders, these reversals likely led to risk cuts or neutralization in the softs/agri sleeve, with stronger confirmation still required before re-engagement.
- Rates & FX: Bonds provided mild ballast, with long-end strength cushioning commodity weakness. Slight USD softness offered modest diversification gains through long EUR, GBP, and JPY exposure. For systematic portfolios, these quiet but steady contributions helped smooth volatility in a noisy week.
Final Reflections – Uneven Sparks
This week highlighted the fragility of trend breadth. Crypto lit a fire with a double-digit surge, copper reinforced metals leadership, and equities stayed constructive. Yet energy’s collapse and cocoa’s crash underlined the persistence of drag factors.
For trend followers, the lessons are clear:
- Diversity is defense — without crypto and copper, the week would have been dominated by commodity weakness.
- Fragility lingers — trend conditions are still transitional, not yet synchronized across sectors.
The TTU Barometer shows neutral conditions, rising weakly. October opens with sparks of momentum but no sustained fire. The question for systematic traders is whether crypto’s speculative burst and copper’s structural strength can broaden into a full-spectrum trend, or whether energy and softs will cap the environment once again.
The next few weeks will reveal whether crypto’s surge broadens into sustained cross-sector momentum, or whether the commodity drags reassert themselves.

List of Resources used in the Week in Review
Important Disclaimers
This document is directly solely to Accredited Investors, Qualified Eligible Participants, Qualified Clients and Qualified Purchasers. No investment decision should be made until prospective investors have read the detailed information in the fund offering documents of any manager mentioned in this document. This document is furnished on a confidential basis only for the use of the recipient and only for discussion purposes and is subject to amendment This document is neither advice nor a recommendation to enter into any transaction. This document is not an offer to buy or sell, nor a solicitation of an offer to buy or sell, any security or other financial instrument. This presentation is based on information obtained from sources that TopTradersUnplugged (“TTU”) (“considers to be reliable however, TTU makes no representation as to, and accepts no responsibility or liability for, the accuracy or completeness of the information. TTU has not independently verified third party manager or benchmark information, does not represent it as accurate, true or complete, makes no warranty, express or implied regarding it and shall not be liable for any losses, damages, costs or expenses relating to its adequacy, accuracy, truth, completeness or use.
All projections, valuations, and statistical analyses are provided to assist the recipient in the evaluation of the matters described herein. Such projections, valuations and analyses may be based on subjective assessments and assumptions and may use one among many alternative methodologies that produce different results accordingly, such projections, valuations and statistical analyses should not be viewed as facts and should not be relied upon as an accurate prediction of future events. There is no guarantee that any targeted performance will be achieved Commodity trading involves substantial risk of loss and may not be suitable for everyone
TTU is not and does not purport to be an advisor as to legal, taxation, accounting, financial or regulatory matters in any jurisdiction. The recipient should independently evaluate and judge the matters referred to herein. TTU does not provide advice or recommendations regarding an investor’s decision to allocate to funds or accounts managed by any manager (“or to maintain or sell investments in funds or accounts managed by any manager, and no fiduciary relationship under ERISA is created by the investor investing in funds or accounts managed by any manager, or through any communication between TTU and the investor
In reviewing this document, it should be understood that the past performance results of any asset class, or any investment or trading program set forth herein, are not necessarily indicative of any future results that may be achieved in connection with any transaction. Any persons subscribing for an investment must be able to bear the risks involved and must meet the suitability requirements relating to such investment. Some or all alternative investment programs discussed herein may not be suitable for certain investors This document is directed only to persons having professional experience in matters relating to investments. Any investment or investment activity to which this document relates is available only to such investment professionals. Persons who do not have professional experience in matters relating to investments should not rely upon this document.
This document and its contents are proprietary information of TTU and may not be reproduced or otherwise disseminated in whole or in part without TTU’s prior written consent.
This document contains simulated or hypothetical performance results that have certain inherent limitations AND SHOULD BE VIEWED FOR ILLUSTRATIVE PURPOSES. Unlike the results shown in an actual performance record, these results do not represent actual trading. HYPOTHETICAL PERFORMANCE RESULTS HAVE MANY INHERENT LIMITATIONS, SOME OF WHICH ARE DESCRIBED BELOW. NO REPRESENTATION IS BEING MADE THAT ANY ACCOUNT WILL OR IS LIKELY TO ACHIEVE PROFITS OR LOSSES SIMILAR TO THOSE SHOWN IN FACT, THERE ARE FREQUENTLY SHARP DIFFERENCES BETWEEN HYPOTHETICAL PERFORMANCE RESULTS AND THE ACTUAL RESULTS SUBSEQUENTLY ACHIEVED BY ANY PARTICULAR INVESTMENT ACCOUNT.
ONE OF THE LIMITATIONS OF HYPOTHETICAL PERFORMANCE RESULTS IS THAT THEY ARE GENERALLY PREPARED WITH THE BENEFIT OF HINDSIGHT IN ADDITION, HYPOTHETICAL TRADING DOES NOT INVOLVE FINANCIAL RISK, AND NO HYPOTHETICAL TRADING RECORD CAN COMPLETELY ACCOUNT FOR THE IMPACT OF FINANCIAL RISK IN ACTUAL TRADING FOR EXAMPLE, THE ABILITY TO WITHSTAND LOSSES OR TO ADHERE TO A PARTICULAR TRADING PROGRAM OR OTHER ASSET.
There are numerous other factors related to the markets in general or to the implementation of any specific trading program which cannot be fully accounted for in the preparation of hypothetical performance results and all of which can adversely affect actual trading results. No representation is being made that any investment will or is likely to achieve profits or losses similar to those being shown.
Most Comprehensive Guide to the Best Investment Books of All Time

Most Comprehensive Guide to the Best Investment Books of All Time
Get the most comprehensive guide to over 600 of the BEST investment books, with insights, and learn from some of the wisest and most accomplished investors in the world. A collection of MUST READ books carefully selected for you. Get it now absolutely FREE!
Get Your FREE Guide HERE!