


Trend Following - Week in Review - September 12, 2025

“Coming Home Strong”
This Week in Trend – 12 September 2025
Welcome back to This Week in Trend, your weekly pulse check on global futures and the state of systematic trend following.
The TTU Trend Barometer surged to 45 percent, up from 30 percent last week, lifting conditions from very weak into the neutral zone. Breadth is now broadening with more markets participating. The SG Trend Index gained further ground, improving to +2.55% month-to-date and trimming YTD losses to -5.30% (versus +0.60% MTD and -7.00% YTD last week). After a gruelling first half, strength is re-emerging across metals, crypto, and softs, even as prior leaders in meats faltered.
SG Trend Index Performance
- Month-to-date (as of Sep 12): +2.55%
- Year-to-date: -5.30%
(Previous week: +0.60% MTD | -7.00% YTD)
The SG Trend Index extended its recovery, with diversified support helping to balance sector retracements. Crypto, metals, and selective softs provided leadership, while meats and rice pulled back.
TTU Trend Barometer
- Current reading: 45 percent – Neutral
- Previous reading: 30 percent
- 10-day rate of change: Rising firmly
“Breadth is broadening at last — trend is coming home strong with renewed conviction.”
At thirty, the floor remains fragile - glimmers appear, but breadth refuses to improve.”
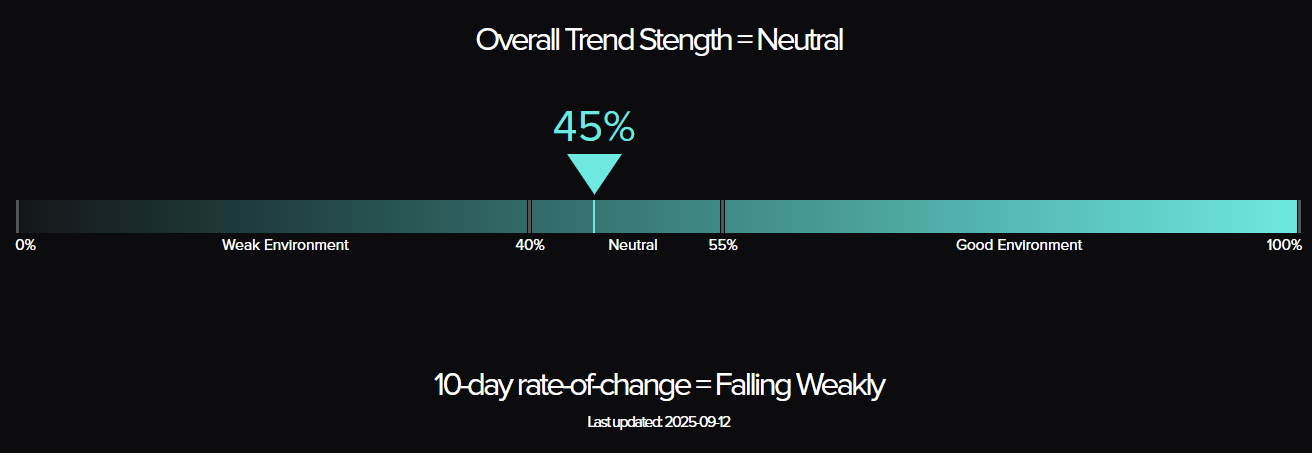
The Top Traders Unplugged (TTU) Trend Barometer is a proprietary tool that measures the percentage of markets with medium to strong trends. Similar to a thermometer, where 0 degrees Celsius equates to freezing, a TTU Trend Barometer reading below 40% indicates a “cold” environment for trend-following, while readings above 55% signal a “hotter,” more favourable trend environment.
Weekly Asset Class Snapshot
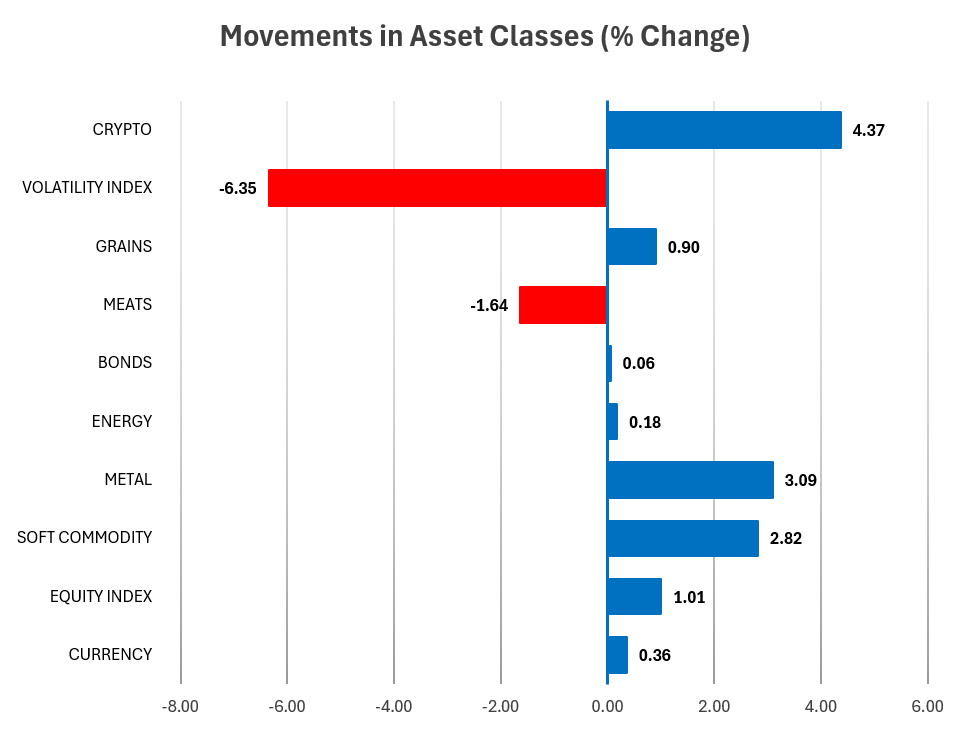
Source: Finwiz.com
Asset Class Breakdown – Uneven Glimmers
- Crypto: +4.37% – Bitcoin powered higher, regaining leadership.
- Metals: +3.09% – Palladium and silver drove sector strength.
- Soft Commodities: +2.82% – Orange juice and coffee staged strong rebounds.
- Equities: +1.01% – Nikkei and Euro Stoxx led, US indices mixed.
- Grains: +0.90% – Corn, soybeans, and canola posted solid gains.
- Currencies: +0.36% – AUD and NZD supported modest strength.
- Energy: +0.18% – Crude and nat gas steadied after prior weakness.
- Bonds: +0.06% – Long-end held gains, yields steady.
- Meats: -1.64% – Live cattle and feeders reversed sharply.
- Volatility Index: -6.35% – VIX collapsed, easing hedging demand.
Performance Highlights – This Week’s Market Leaders & Laggards
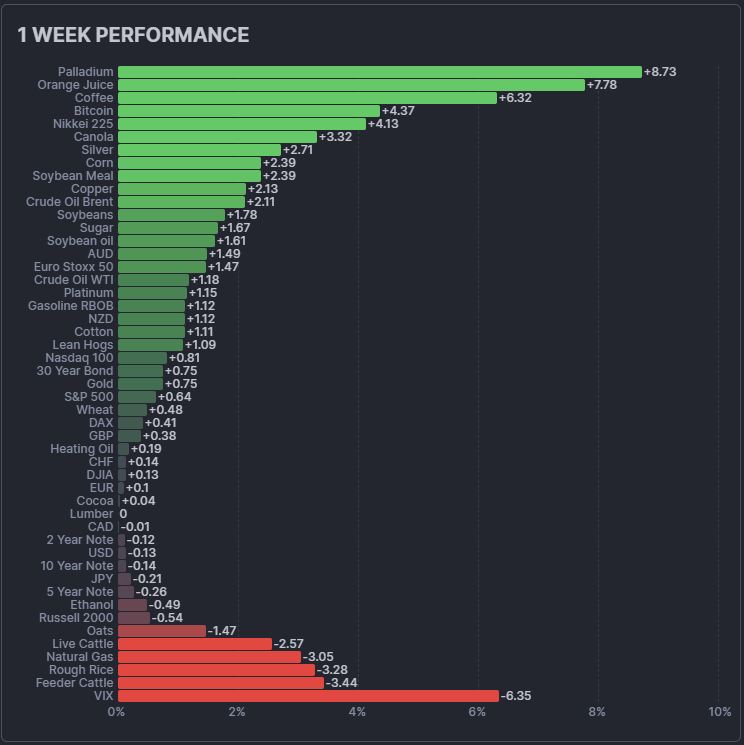
Top Market Movers
Top Gainers
- Palladium: +8.73% – Explosive surge.
- Orange Juice: +7.78% – Sharp rebound.
- Coffee: +6.32% – Strength across softs.
- Bitcoin: +4.37% – Crypto resurgence.
- Nikkei 225: +4.13% – Strongest among equities.
Top Losers
- Feeder Cattle: -3.44% – Heaviest retracement in meats.
- Rough Rice: -3.28% – Grain weakness in rice.
- Natural Gas: -3.05% – Continued softness.
- Live Cattle: -2.57% – Leaders turned to laggards.
- VIX: -6.35% – Hedging demand collapsed.
Portfolio View - Positioning and Impact
- Metals: Palladium’s outlier surge boosted exposure; silver and gold steady contributors.
- Crypto: Bitcoin rally reinforced the diversification benefit of rare positive bursts.
- Softs: Coffee and OJ provided upside offsets to recent sector weakness.
- Equities: Nikkei and Euro Stoxx firmed; Russell and US indices consolidated.
- Grains: Corn, soybeans, and canola turned higher, broadening participation.
- Meats: Cattle and feeders rolled over, erasing prior leadership.
- Energy: Crude and nat gas steady; volatility subdued.
- Currencies: Modest support from AUD, NZD, and CAD.
- Volatility: Collapsing VIX dampened breakout conditions but eased overall stress.
Final Reflections – Coming Home Strong
The story of September so far is one of resilience. After a bruising first half, breadth is finally firming. Crypto, metals, and softs are shouldering leadership while equities and grains add selective support. The retracement in meats shows how leadership can rotate, but diversification is doing its job: strength in one corner is offsetting weakness in another.
With the SG Trend Index repairing losses and the TTU Barometer pushing into neutral, trend is now coming home strong. The battle for survivability in the first half is giving way to compounding opportunities in the second.

List of Resources used in the Week in Review
Important Disclaimers
This document is directly solely to Accredited Investors, Qualified Eligible Participants, Qualified Clients and Qualified Purchasers. No investment decision should be made until prospective investors have read the detailed information in the fund offering documents of any manager mentioned in this document. This document is furnished on a confidential basis only for the use of the recipient and only for discussion purposes and is subject to amendment This document is neither advice nor a recommendation to enter into any transaction. This document is not an offer to buy or sell, nor a solicitation of an offer to buy or sell, any security or other financial instrument. This presentation is based on information obtained from sources that TopTradersUnplugged (“TTU”) (“considers to be reliable however, TTU makes no representation as to, and accepts no responsibility or liability for, the accuracy or completeness of the information. TTU has not independently verified third party manager or benchmark information, does not represent it as accurate, true or complete, makes no warranty, express or implied regarding it and shall not be liable for any losses, damages, costs or expenses relating to its adequacy, accuracy, truth, completeness or use.
All projections, valuations, and statistical analyses are provided to assist the recipient in the evaluation of the matters described herein. Such projections, valuations and analyses may be based on subjective assessments and assumptions and may use one among many alternative methodologies that produce different results accordingly, such projections, valuations and statistical analyses should not be viewed as facts and should not be relied upon as an accurate prediction of future events. There is no guarantee that any targeted performance will be achieved Commodity trading involves substantial risk of loss and may not be suitable for everyone
TTU is not and does not purport to be an advisor as to legal, taxation, accounting, financial or regulatory matters in any jurisdiction. The recipient should independently evaluate and judge the matters referred to herein. TTU does not provide advice or recommendations regarding an investor’s decision to allocate to funds or accounts managed by any manager (“or to maintain or sell investments in funds or accounts managed by any manager, and no fiduciary relationship under ERISA is created by the investor investing in funds or accounts managed by any manager, or through any communication between TTU and the investor
In reviewing this document, it should be understood that the past performance results of any asset class, or any investment or trading program set forth herein, are not necessarily indicative of any future results that may be achieved in connection with any transaction. Any persons subscribing for an investment must be able to bear the risks involved and must meet the suitability requirements relating to such investment. Some or all alternative investment programs discussed herein may not be suitable for certain investors This document is directed only to persons having professional experience in matters relating to investments. Any investment or investment activity to which this document relates is available only to such investment professionals. Persons who do not have professional experience in matters relating to investments should not rely upon this document.
This document and its contents are proprietary information of TTU and may not be reproduced or otherwise disseminated in whole or in part without TTU’s prior written consent.
This document contains simulated or hypothetical performance results that have certain inherent limitations AND SHOULD BE VIEWED FOR ILLUSTRATIVE PURPOSES. Unlike the results shown in an actual performance record, these results do not represent actual trading. HYPOTHETICAL PERFORMANCE RESULTS HAVE MANY INHERENT LIMITATIONS, SOME OF WHICH ARE DESCRIBED BELOW. NO REPRESENTATION IS BEING MADE THAT ANY ACCOUNT WILL OR IS LIKELY TO ACHIEVE PROFITS OR LOSSES SIMILAR TO THOSE SHOWN IN FACT, THERE ARE FREQUENTLY SHARP DIFFERENCES BETWEEN HYPOTHETICAL PERFORMANCE RESULTS AND THE ACTUAL RESULTS SUBSEQUENTLY ACHIEVED BY ANY PARTICULAR INVESTMENT ACCOUNT.
ONE OF THE LIMITATIONS OF HYPOTHETICAL PERFORMANCE RESULTS IS THAT THEY ARE GENERALLY PREPARED WITH THE BENEFIT OF HINDSIGHT IN ADDITION, HYPOTHETICAL TRADING DOES NOT INVOLVE FINANCIAL RISK, AND NO HYPOTHETICAL TRADING RECORD CAN COMPLETELY ACCOUNT FOR THE IMPACT OF FINANCIAL RISK IN ACTUAL TRADING FOR EXAMPLE, THE ABILITY TO WITHSTAND LOSSES OR TO ADHERE TO A PARTICULAR TRADING PROGRAM OR OTHER ASSET.
There are numerous other factors related to the markets in general or to the implementation of any specific trading program which cannot be fully accounted for in the preparation of hypothetical performance results and all of which can adversely affect actual trading results. No representation is being made that any investment will or is likely to achieve profits or losses similar to those being shown.
Most Comprehensive Guide to the Best Investment Books of All Time

Most Comprehensive Guide to the Best Investment Books of All Time
Get the most comprehensive guide to over 600 of the BEST investment books, with insights, and learn from some of the wisest and most accomplished investors in the world. A collection of MUST READ books carefully selected for you. Get it now absolutely FREE!
Get Your FREE Guide HERE!