


Trend Following Performance Report — August, 2025

August 2025: Fragile Breadth, Selective Strength
August gave trend followers a modest reprieve from July’s policy shocks. Trends remained scarce, yet several pockets delivered meaningful gains. Strength in parts of softs and precious metals, steadier equity momentum, and better risk discipline helped most composites finish in the black. The improvement trimmed, but did not erase, the year-to-date damage. Gains were driven by isolated opportunities rather than broad participation, which is consistent with the weak breadth we have discussed in recent weekly notes.
Across the indexes, August was positive for managed futures while equities also advanced. Headline results:
- TTU TF Index: +2.31% for August (YTD −9.01%, trailing 12 months −9.82%). Long-term profile remains intact, CAGR 7.06% with a 21.20% max drawdown.
- SG Trend Index: +2.74% for August (YTD −7.56%, trailing 12 months −6.38%). Long-term CAGR 4.98%, max drawdown 20.61%.
- BTOP50 Index: +1.29% for August (YTD −2.94%, trailing 12 months −0.53%). Long-term CAGR 3.90%, max drawdown 15.94%.
- S&P 500 Total Return: +2.03% for August (trailing 12 months +15.89%). Since 2000, CAGR 7.83% with a 50.95% max drawdown.
In short, August delivered a constructive, selective recovery. Equity momentum stayed firm, trend composites posted small gains, and dispersion narrowed versus July. The backdrop remains fragile, so opportunity continues to be concentrated rather than broad.
August 2025 Trend Index Performance
Weak breadth persisted into August, but selective opportunities allowed most trend indexes to recover ground. Strength in soft commodities, precious metals, and equities outweighed reversals in energy and parts of the commodity complex. The broad ensemble of systematic programs posted positive returns for the month, though gains remained concentrated rather than widespread.
Despite the fragile backdrop, long-term resilience continues to show, particularly in the TTU TF Index, which remains the standout performer over the full data period. Its enduring advantage reflects the benefit of focusing on programs with deep track records rather than size alone.
SG Trend Index
The SG Trend Index is designed to track the 10 largest trend following CTAs of the Managed Futures space.
Criteria for inclusion in the Index, as determined by Société Générale, are as follows:
• Must trade primarily futures (including FX forwards);
• Must be broadly diversified across asset classes;
• Must be an industry recognized trend follower;
• Must exhibit significant correlation to trend following peers;
• Must be open to new investment; and
• Must report returns on a daily basis (net of fees).
The index currently is:
• Equally weighted;
• Calculated in base currency;
• Has an inception date of 1st January 2000;
• Rebalanced annually on 1st January; and
• Reconstituted annually on 1st January based on eligibility criteria.
There was a slight modification to the Index from January 2013 to the present. Previously, the Programs needed to be a constituent of the SG CTA Index, and the 10 largest Managers were not a requirement.
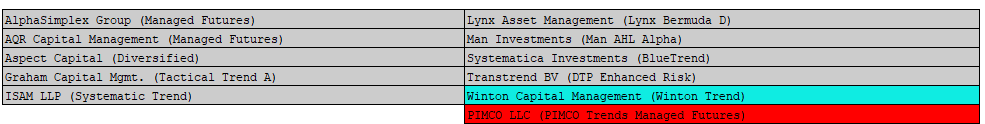
For the 2025 year, following the rebalance of the Index, we say goodbye to the PIMCO LLC (Pimco Trends Managed Futures) Program and hello again to the Winton Capital Management (Winton Trend) Program. The listing of the 10 eligible programs in the Index for 2025 is as follows:
The SG Trend Index, which tracks the 10 largest institutional CTAs, gained +2.74 percent in August. Even with the rebound, the index remains down −7.56 percent YTD and −6.38 percent over the trailing 12 months. Its maximum drawdown stands at 20.61 percent, underscoring the depth of pressure in the current cycle.
Since inception in 2000, the SG Trend Index has delivered a CAGR of 4.98 percent, positioning it between the higher-performing TTU TF Index and the more diluted BTOP50 Index. Its strong correlation (0.95) to the TTU TF Index reinforces its role as a bellwether for large institutional trend-followers, though its emphasis on AUM concentration has historically produced lower long-term returns.
The performance of the SG Trend Index since 1st January 2000 to the end of last month is seen in the chart below:
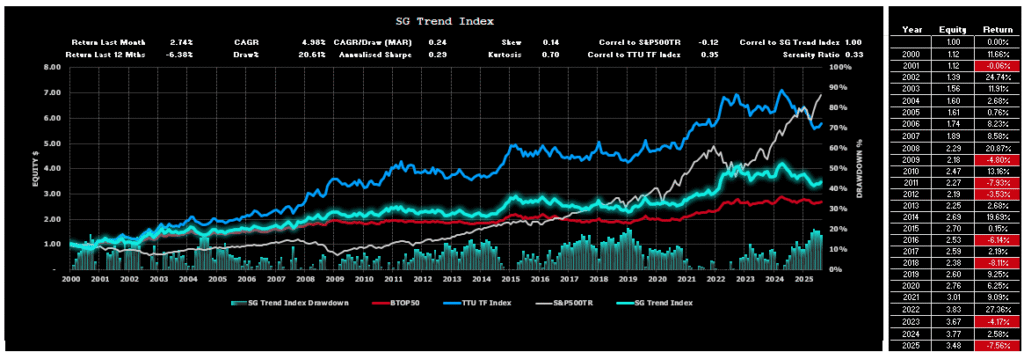
You will notice how the SG Trend Index is highly correlated with the BTOP50 Index and the TTU TF Index and uncorrelated with the S&P500TR Index.
Despite the high correlation between the various trend following Indexes, the long-term performance of these three Trend Following Indexes in terms of CAGR is different. The SG Trend Index plots between the BTOP50 Index and the TTU TF Index.
BTOP 50 Index
The BTOP50 Index seeks to replicate the overall composition of the managed futures industry with regards to trading style and overall market exposure. Unlike the SG Trend Index and the TTU TF Index, the BTOP50 is not strictly a trend following Index and is more broadly representative of the entire managed futures segment of which a dominant style is trend following. We like to think of the BTOP 50 as a ‘quasi trend following Index’ as opposed to a pure trend following Index.
Like the SG Trend Index, the BTOP50 Index is designed to track the performance of the largest Programs by AUM, however the Programs included may not be all Trend Following Programs.
Criteria for inclusion in the Index as determined by BarclayHedge is as follows:
• Must be a Program represented in the Barclay CTA Universe;
• In each Calendar year, the Programs selected must in aggregate be no less than 50% of the investable assets of the Barclay CTA Universe;
• The Programs must be open for investment;
• The Manager must be willing to provide Barclay Hedge with daily return performance;
• The Program must have at least two years of trading activity; and
• The Program’s advisor must have at least three years of operating history.
The index currently is:
• Equally weighted;
• Rebalanced annually on 1st January; and
• Reconstituted annually on 1st January based on eligibility criteria.
Despite the ’50’ tag in the BTOP 50 description, for 2025 there are 20 constituents in the Index.
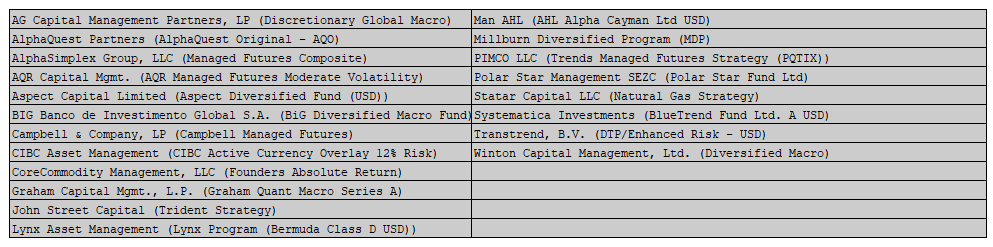
The BTOP50 Index, a broader measure of managed futures programs, advanced +1.29 percent in August. Despite the uptick, the index remains down −2.94 percent YTD and −0.53 percent over the trailing 12 months. With a long-term CAGR of 3.90 percent and a maximum drawdown of 15.94 percent, the BTOP50 continues to deliver smoother but more muted returns compared to pure trend composites.
Its broader inclusion of non-trend strategies cushions short-term volatility but inevitably dilutes upside capture. August reinforced this dynamic, as the BTOP50 held up relatively well against deeper drawdowns elsewhere, but at the cost of lower absolute returns across the full period.
The performance of the BTOP 50 Index since 1st January 2000 to the end of last month is seen in the chart below:

The BTOP 50 Index is highly correlated with the trend following Indexes of the SG Trend Index and the TTU TF Index, however its long-term performance is the lowest of the 3 Trend Following Indexes. While there is a significant representation of Trend Following Programs within the Index, the non-trend following Programs contribute to this diluted long-term performance.
TTU TF Index
The TTU TF Index has been developed by Top Traders Unplugged to provide a performance measure of the trend following programs with a long-term track record.
At TTU, we recognize the importance of a robust trading approach to these uncertain markets and feel that AUM is not a good robustness measure when it comes to assessing performance of the Trend Following industry. It is our strong opinion that the ultimate selection measure to apply in constituting a Trend Following Index is not AUM or a proxy risk metric such as the Sharpe, Sortino, MAR ratio, Ulcer Index or Serenity ratio. The superior metric to assess long-term performance is the long-term validated track record itself.
We have therefore developed a different method for constructing our TTU TF Index.
The criteria for inclusion into the TTU TF Index are as follows:
• Monthly performance results need to be captured in the Nilsson Hedge CTA database;
• Must be geographically diversified across asset classes;
• Must be fully systematic in nature using quantitative rules for entry and exit;
• Must possess at least a 15-year unbroken track record to the current reporting month;
• Must adopt trend following as their dominant investment strategy;
• Are currently active programs; and
• Must report performance monthly (net of fees).
The Index:
• Is Equally weighted;
• Is Rebalanced monthly;
• Is Reconstituted monthly;
• Has an inception date of 1st January 2000
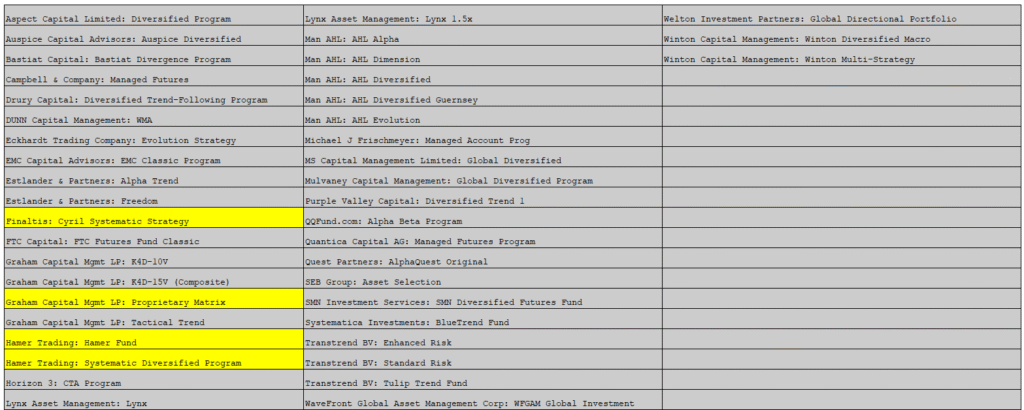
As of August 31, 2025, the TTU Trend Following Index comprises 43 active programs, each with a long-term, verified track record. The monthly return is calculated as the average performance of all programs that have submitted results for the period. For August, 39 of the 43 programs reported performance data by the cut-off date.
The performance of the TTU TF Index since 1st January 2000 to the end of last month is as follows:
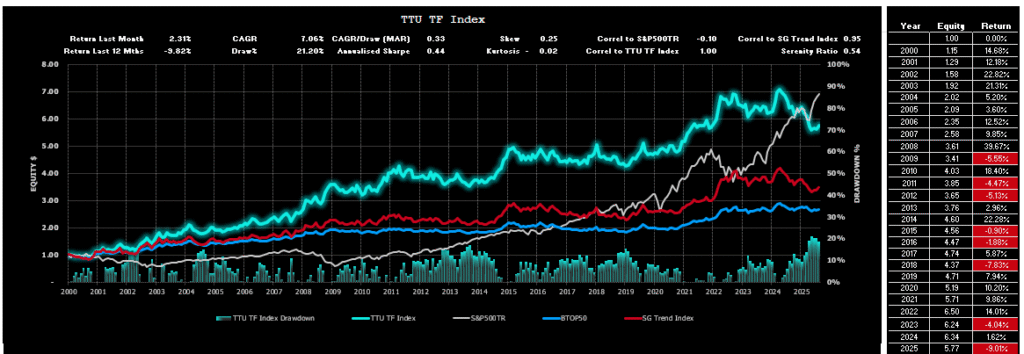
Now, you might be intrigued by the performance result of the TTU TF Index. While it is highly correlated with the BTOP 50 Index and the SG Trend Index, we can see that the long-term performance of the TTU TF Index clearly outstrips alternative Index measures.
The dominant contributor of this outperformance is the requirement for any participating Program in the Index to have a long-term track record. You see, using AUM as a criterion for inclusion is not necessarily a useful selection criterion. While AUM reflects ‘market appeal’, it does not imply that this ‘market appeal’ is strongly correlated with long-term performance.
Our process of Index construction gives us insight into how any diversified ensemble of trend-following Programs with a long-term track record approaches an optimal portfolio as we increase the number of Programs in the Index. Simply by diversifying into a large ensemble of Trend Following Programs with a long-term track record, we magically improve the Index result. CAGR is increased, and our drawdowns are reduced.
Of course, we already know this ‘diversification’ principle of Trend Following. As we increase our diversification efforts, we achieve improvements in both the maximum drawdown and the CAGR generated by the ensemble. This is why we seek to strive for maximum market and system diversification within our individual programs. The TTU TF Index takes diversification one step further by spreading across multiple TF Programs to deliver a superior risk-adjusted result.
TTU TF Index Performance
The TTU TF Index, composed exclusively of long-tenured trend-following programs, advanced +2.31 percent in August. Year-to-date, the index is down −9.01 percent and shows a −9.82 percent decline over the trailing 12 months. Despite the ongoing pressure, the TTU TF Index continues to be the strongest performer over the long run, with a CAGR of 7.06 percent since 2000 and a maximum drawdown of 21.20 percent.
Its methodology, selecting programs based on long-term track record rather than AUM, continues to demonstrate superior long-term results, even through extended drawdowns. The August rebound highlights how durable this composite is when selective opportunities emerge.
The TTU TF Index remains highly correlated with the SG Trend Index (0.95) and BTOP50 Index (0.93) but consistently delivers stronger long-term performance due to its focus on programs with proven durability. This reinforces the benefits of allocating based on process integrity and resilience, not just size.
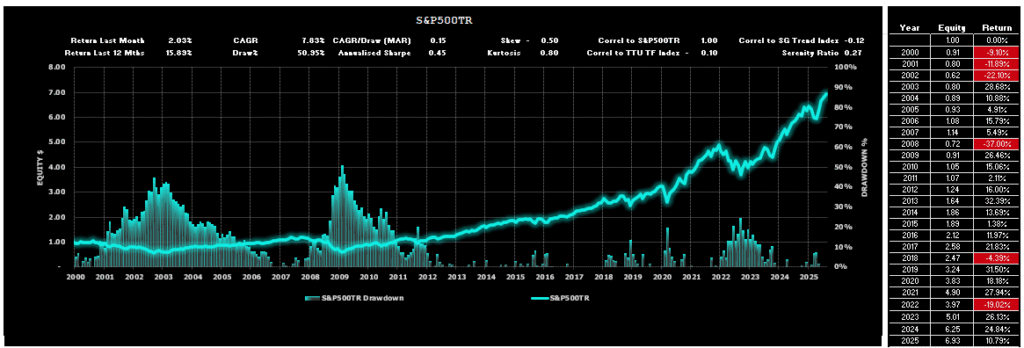
In comparison, the S&P500TR Index posted another positive month in August, rising +2.03 percent. The index has now gained +15.89 percent over the trailing 12 months, extending a powerful equity bull run. Since 2000, the S&P500TR has delivered a 7.83 percent CAGR, but with a maximum drawdown of 50.95 percent. This contrast underscores the enduring role of trend-following strategies as portfolio diversifiers, especially when equity risk premia compress.
TTU Trend Barometer
The TTU Trend Barometer closed August at 30, signalling a firmly unfavourable trending environment. This marks a further weakening from July’s 36 reading and reflects the lack of sustained directional strength across global markets.
The Barometer, which measures the persistence of price trends across 44 global futures markets, showed opportunity remained narrow and selective. While soft commodities and a few precious metals offered trending signals, these were offset by reversals in energy and uneven behaviour in other commodity sectors. Short- and medium-term signals remained fragmented, underscoring the difficulty of generating broad-based gains.
It is important to note that the Barometer captures month-end conditions and may not fully reflect intra-month dynamics. August’s reading highlights how persistent weakness in trend breadth continues to weigh on systematic strategies, with selective winners unable to compensate for the broader lack of trend participation.
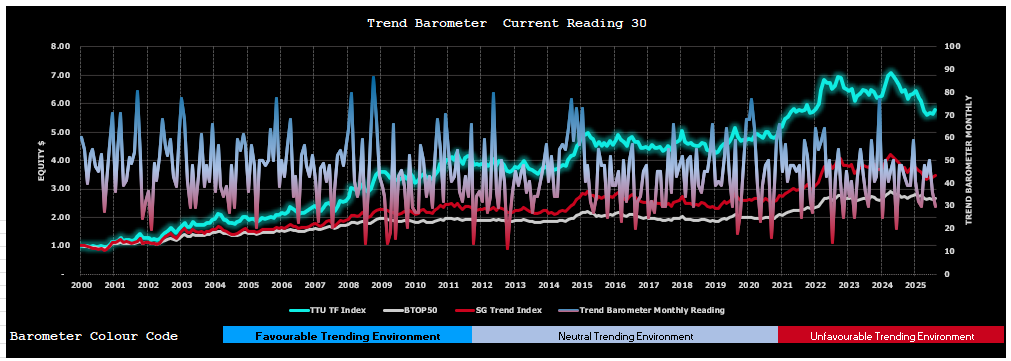
The Trend Barometer is a proprietary tool we use at TTU to assess the trend strength of a diversified portfolio consisting of 44 markets across all sectors. We firstly subdivide the trend strength of each market of a hypothetical diverse portfolio into five ranges from strong up, medium up, neutral, medium down and strong down. We then aggregate these results into a single portfolio number which we use to describe the overall trend strength across a hypothetical Program portfolio.
We then arbitrarily divide this percentage range into 3 where a value of 0-30 is considered a very unfavorable market regime for trend following Programs, a range between 30 to 55 is a somewhat neutral environment for Trend Following Programs (but not an environment where you could expect consistent performance) and values more than 55 are considered to be a favorable regime towards Trend Following Programs, where they should see good performance.
Aside from the occasional dispersed readings when compared to overall trend following performance, this method is surprisingly powerful in describing CTA monthly performance and can be used to connect market trading environments to resultant Manager performance.
The Macro Environment
For a blow-by-blow macro wrap for the month, we recommend you listen to our weekly systematic investor series by clicking on the links below. It is also worthwhile listening to our past catalogue as it provides you with an understanding of how these markets can shape the emotions of a Trader and why it is therefore essential that Trend Followers adopt systematic rules-based processes to keep these emotions in check.
You can find all of our weekly conversations by clicking this link.
Top 10 Lists
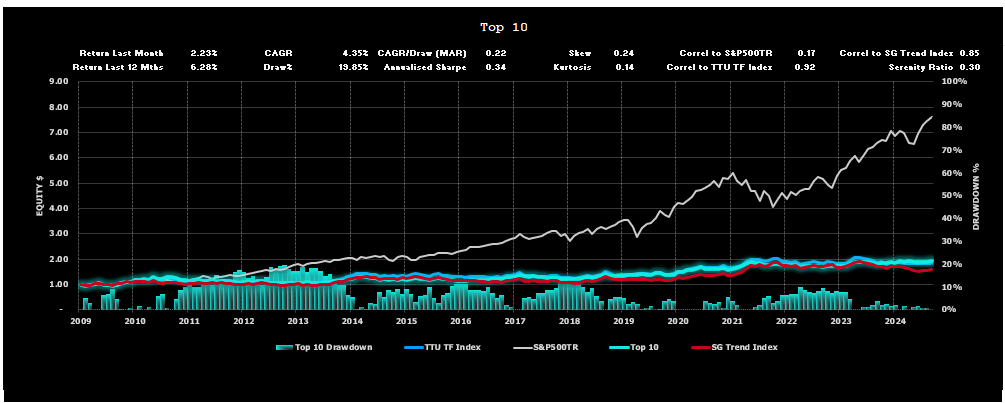
We have prepared the following Top 10 lists (excluding non-reporting Programs) for various performance categories based on monthly performance returns for a 15-year period, commencing January 1, 2010, to the current month.
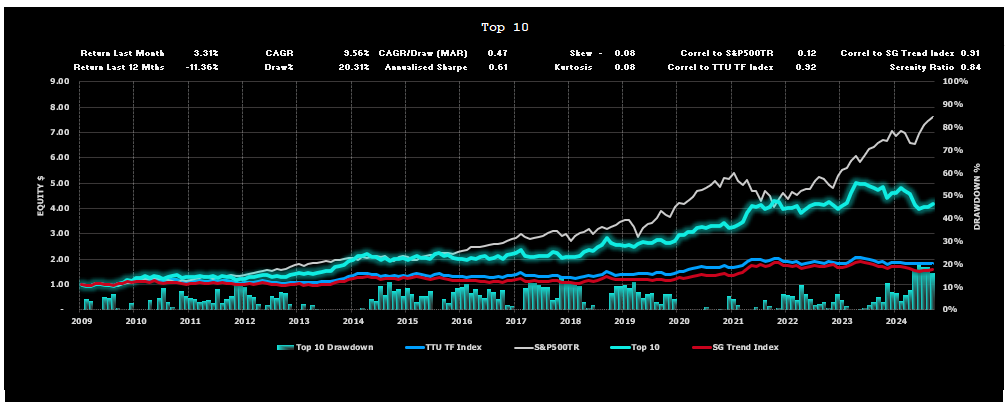
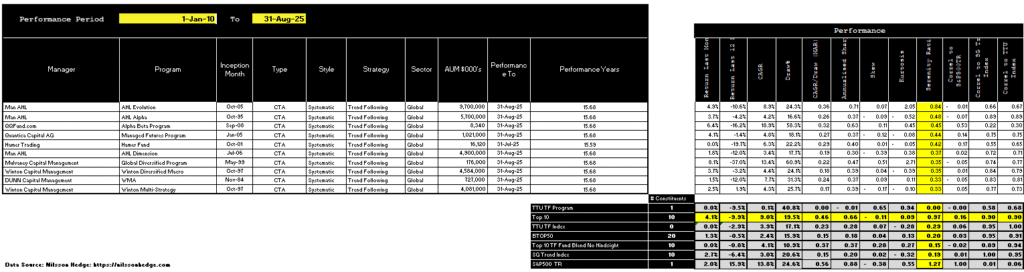
Top 10 Listing – by Compound Annual Growth Rate
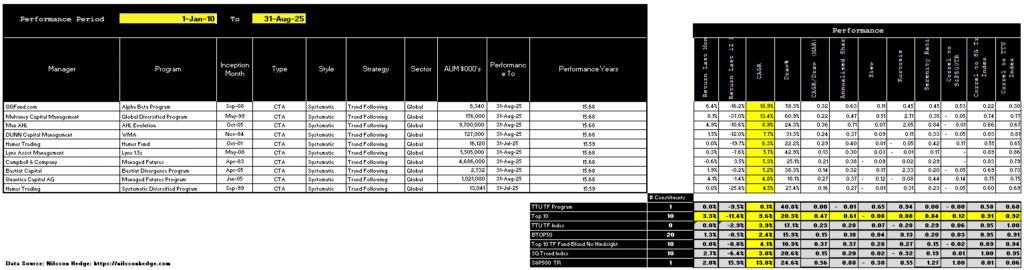
Top 10 Listing – by Risk Adjusted Return (Serenity Ratio)
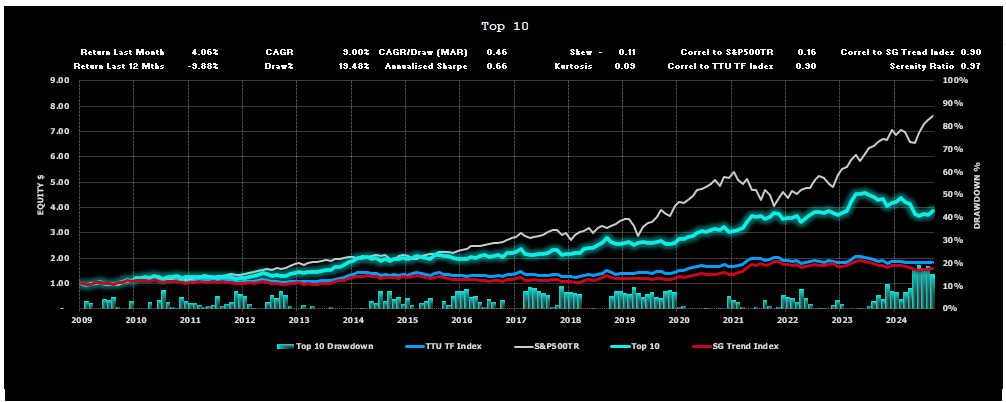
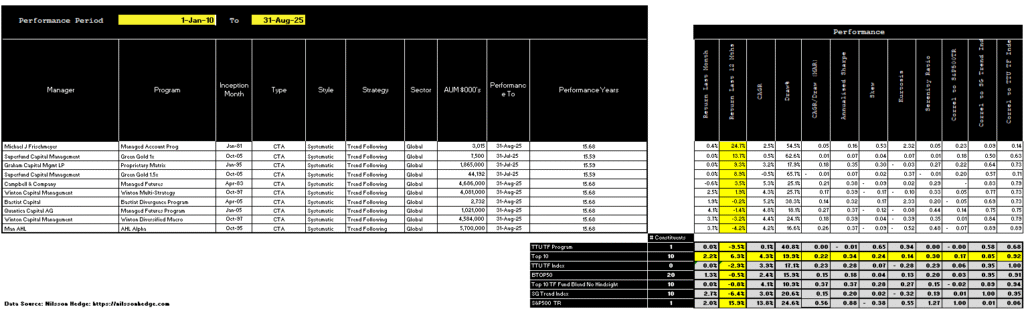
Top 10 Listing – by Last 12 months Performance
Performance Results for the TTU Top 5 by Serenity Ratio
In a research project we undertook at TTU, we examined three different allocation methods that could be deployed by an investor seeking to optimally allocate investment funds towards 5 of the top-ranked Globally Diversified Systematic Trend Following Programs with a long-term track record.
These three methods adopted 3 different forms of performance metric, namely:
- Top 5 Performers by Compound Annual Growth Rate (CAGR) using a rolling lookback of 15 years.
- Top 5 Performers by MAR ratio (CAGR/Max Draw%) using a rolling lookback of 15 years.
- Top 5 Performers by Serenity Ratio using a rolling lookback of 15 years.
The findings of our project can be obtained by clicking on this link.
Our research determined that the optimal selection method was the Serenity Ratio method.
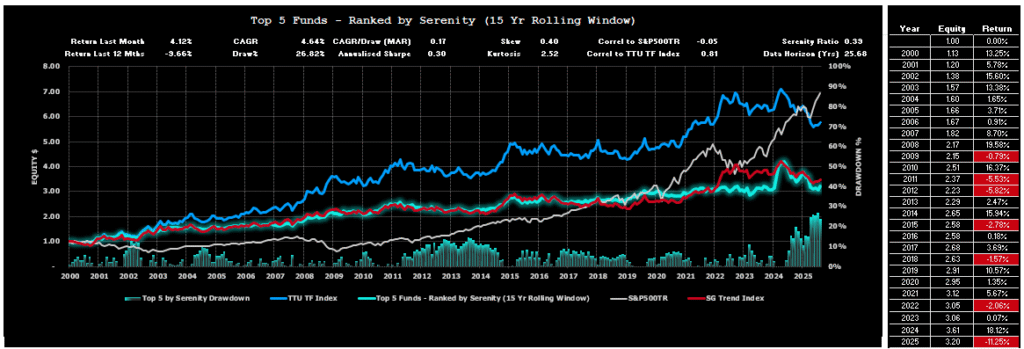
The Serenity Top 5 Selection Method gained +4.12% in August 2025, trimming its year-to-date decline to −11.25%. The rebound reflected stronger contributions from select programs, even as breadth across the wider trend-following universe remained fragile.
Following the annual reconstitution earlier this year, Mulvaney Capital’s Global Diversified Program remains a key source of variability within the Serenity portfolio. Its aggressive profile adds convexity over the long run but can magnify short-term swings. August’s strong result illustrated that dynamic on the upside, providing a meaningful boost to the composite.
The Serenity Ratio continues to validate its use as a robust filter for identifying managers with consistent, risk-adjusted performance. By emphasizing lower drawdowns and long-term durability, it highlights funds resilient across market regimes. Yet, as August showed, while the filter strengthens portfolio stability, it cannot entirely shield investors from the volatility inherent in trend-following strategies.
Over the full reporting period, the Serenity portfolio has achieved a CAGR of 4.64% with a maximum drawdown of 26.82%, while maintaining a near-zero correlation to the S&P 500 Total Return Index (−0.05). This reinforces its diversifying role, even during extended periods of uneven returns.
The 2025 Serenity selection is as follows and will be maintained for the investment period between 1st February 2025 to 31st January 2026:
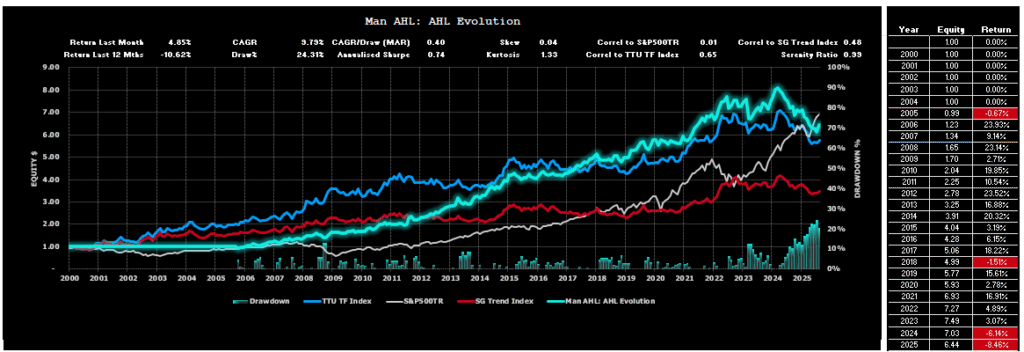
- Man AHL: AHL Evolution;
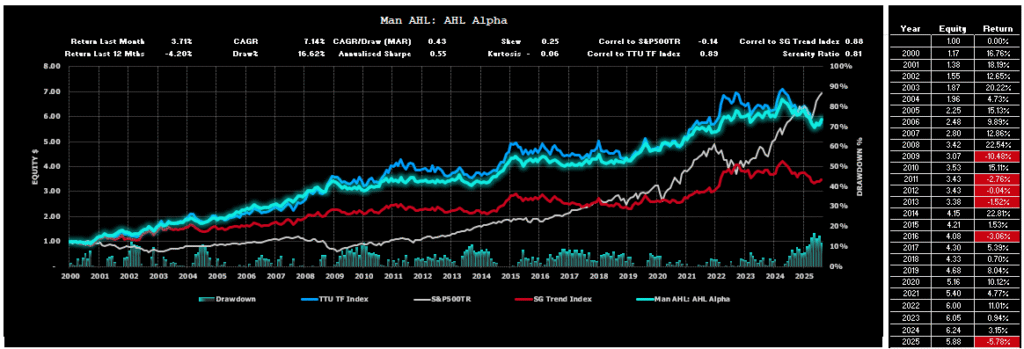
- Man AHL: AHL Alpha;
- Mulvaney Capital Management: Global Diversified Program;
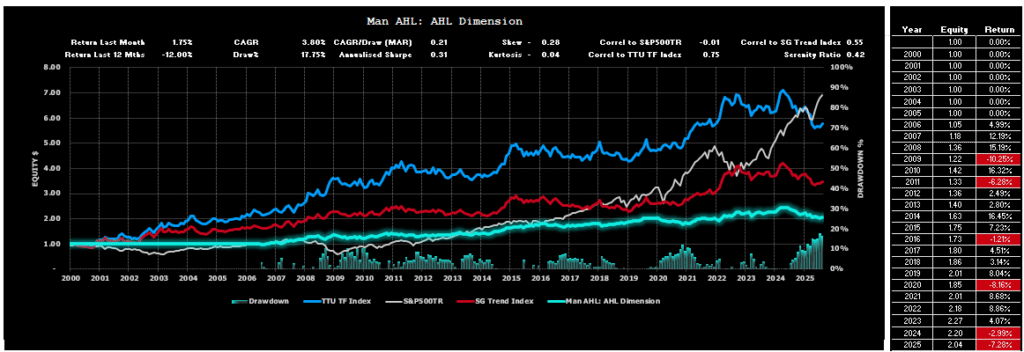
- Man AHL: AHL Dimension; and
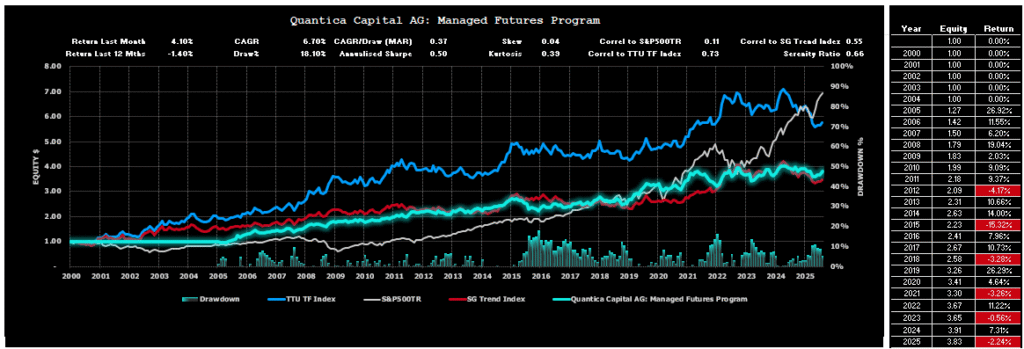
- Quantica Capital AG: Managed Futures Program.
Individual Performance Results for the 5 Programs used for the Serenity allocation to the reporting month using the 2025 listing are as follows:

Performance Results for the Alternative 60/40 portfolio using the TTU Top 5 by Serenity Ratio
In our “How to Invest with the Best” blog post, we also highlighted the significant improved risk-adjusted performance results that could be achieved by replacing the 40% allocation to Bonds in the traditional 60/40 portfolio with an allocation of 40% towards the TTU Top 5 by Serenity ratio.
The evaluation compared the performance of a traditional 60% Equity/40% Bond portfolio against a 60% Equity/40% Serenity portfolio to highlight the uncorrelated historical nature of this Alternative 60/40 portfolio and demonstrate the benefits that a sizeable allocation towards the Serenity portfolio would bring to an investor if equity and bond markets go back to their historic relationship and become more positively correlated in the future. There is no guarantee that correlations remain static over time and it is possible that bond markets and equity markets may lose their uncorrelated relationship that has existed in the last 20 years or so. It is far less likely that the TF managers within the Serenity Grouping will ever be strongly positively correlated to the Equities market, over the long run, given the extensive global diversification and ability to go long and short, that is present within the constituents of the Serenity Grouping.
Chart 21 below showcases the comparative performance results for the period 1 January 2000 to the end of last month:
- A 100% investment in the S&P500TR portfolio;
- A 100% investment in the VBMFX which is a proxy for the bond market;
- A 100% investment in the VBIAX which is a suitable proxy for the classic 60% Equity/40% Bond portfolio;
- A 100% investment in a 60% S&P500TR 40% Serenity portfolio; and
- A 100% investment in the Serenity Portfolio.
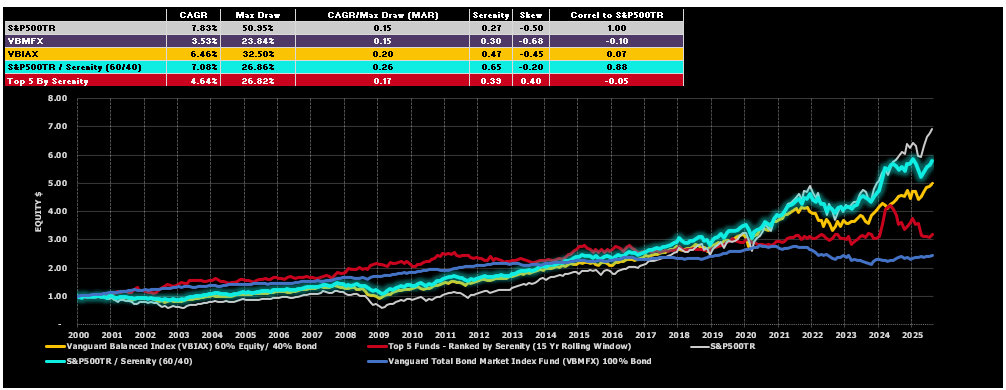
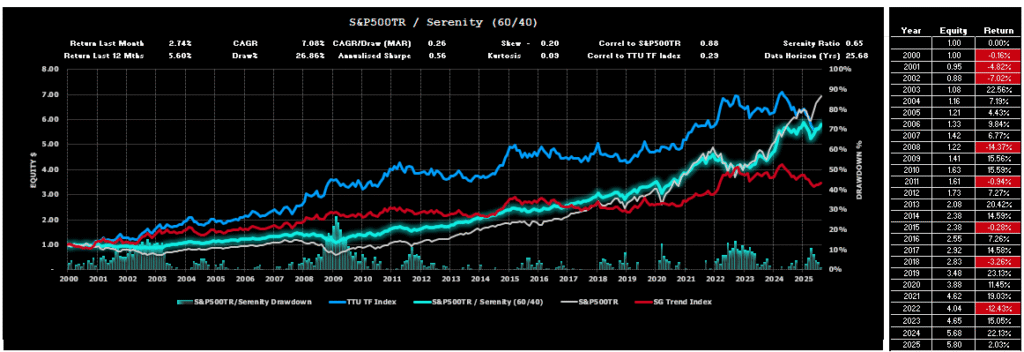
The comparison of alternative portfolio allocations above highlights the strong historic risk adjusted returns that have been enjoyed by 60% S&P500TR / 40% Serenity Composite Portfolio.
A more detailed assessment of this powerful 60/40 investment option is reflected below.
Important Disclaimers
This document is directly solely to Accredited Investors, Qualified Eligible Participants, Qualified Clients and Qualified Purchasers. No investment decision should be made until prospective investors have read the detailed information in the fund offering documents of any manager mentioned in this document. This document is furnished on a confidential basis only for the use of the recipient and only for discussion purposes and is subject to amendment This document is neither advice nor a recommendation to enter into any transaction. This document is not an offer to buy or sell, nor a solicitation of an offer to buy or sell, any security or other financial instrument. This presentation is based on information obtained from sources that TopTradersUnplugged (“TTU”) (“considers to be reliable however, TTU makes no representation as to, and accepts no responsibility or liability for, the accuracy or completeness of the information. TTU has not independently verified third party manager or benchmark information, does not represent it as accurate, true or complete, makes no warranty, express or implied regarding it and shall not be liable for any losses, damages, costs or expenses relating to its adequacy, accuracy, truth, completeness or use.
All projections, valuations, and statistical analyses are provided to assist the recipient in the evaluation of the matters described herein. Such projections, valuations and analyses may be based on subjective assessments and assumptions and may use one among many alternative methodologies that produce different results accordingly, such projections, valuations and statistical analyses should not be viewed as facts and should not be relied upon as an accurate prediction of future events. There is no guarantee that any targeted performance will be achieved Commodity trading involves substantial risk of loss and may not be suitable for everyone
TTU is not and does not purport to be an advisor as to legal, taxation, accounting, financial or regulatory matters in any jurisdiction. The recipient should independently evaluate and judge the matters referred to herein. TTU does not provide advice or recommendations regarding an investor’s decision to allocate to funds or accounts managed by any manager (“or to maintain or sell investments in funds or accounts managed by any manager, and no fiduciary relationship under ERISA is created by the investor investing in funds or accounts managed by any manager, or through any communication between TTU and the investor
In reviewing this document, it should be understood that the past performance results of any asset class, or any investment or trading program set forth herein, are not necessarily indicative of any future results that may be achieved in connection with any transaction. Any persons subscribing for an investment must be able to bear the risks involved and must meet the suitability requirements relating to such investment. Some or all alternative investment programs discussed herein may not be suitable for certain investors This document is directed only to persons having professional experience in matters relating to investments. Any investment or investment activity to which this document relates is available only to such investment professionals. Persons who do not have professional experience in matters relating to investments should not rely upon this document.
This document and its contents are proprietary information of TTU and may not be reproduced or otherwise disseminated in whole or in part without TTU’s prior written consent.
This document contains simulated or hypothetical performance results that have certain inherent limitations AND SHOULD BE VIEWED FOR ILLUSTRATIVE PURPOSES. Unlike the results shown in an actual performance record, these results do not represent actual trading. HYPOTHETICAL PERFORMANCE RESULTS HAVE MANY INHERENT LIMITATIONS, SOME OF WHICH ARE DESCRIBED BELOW. NO REPRESENTATION IS BEING MADE THAT ANY ACCOUNT WILL OR IS LIKELY TO ACHIEVE PROFITS OR LOSSES SIMILAR TO THOSE SHOWN IN FACT, THERE ARE FREQUENTLY SHARP DIFFERENCES BETWEEN HYPOTHETICAL PERFORMANCE RESULTS AND THE ACTUAL RESULTS SUBSEQUENTLY ACHIEVED BY ANY PARTICULAR INVESTMENT ACCOUNT.
ONE OF THE LIMITATIONS OF HYPOTHETICAL PERFORMANCE RESULTS IS THAT THEY ARE GENERALLY PREPARED WITH THE BENEFIT OF HINDSIGHT IN ADDITION, HYPOTHETICAL TRADING DOES NOT INVOLVE FINANCIAL RISK, AND NO HYPOTHETICAL TRADING RECORD CAN COMPLETELY ACCOUNT FOR THE IMPACT OF FINANCIAL RISK IN ACTUAL TRADING FOR EXAMPLE, THE ABILITY TO WITHSTAND LOSSES OR TO ADHERE TO A PARTICULAR TRADING PROGRAM OR OTHER ASSET.
There are numerous other factors related to the markets in general or to the implementation of any specific trading program which cannot be fully accounted for in the preparation of hypothetical performance results and all of which can adversely affect actual trading results. No representation is being made that any investment will or is likely to achieve profits or losses similar to those being shown.
Most Comprehensive Guide to the Best Investment Books of All Time

Most Comprehensive Guide to the Best Investment Books of All Time
Get the most comprehensive guide to over 600 of the BEST investment books, with insights, and learn from some of the wisest and most accomplished investors in the world. A collection of MUST READ books carefully selected for you. Get it now absolutely FREE!
Get Your FREE Guide HERE!