


Trend Following Performance Report - February, 2026
Resilience Through Rotation
February tested trend followers with some of the most violent sector rotation of the year, and systematic programs passed the test convincingly. All three major benchmarks posted gains for a second consecutive month, the TTU Trend Barometer recovered from a mid-month dip into neutral territory to close firmly in the favourable zone, and the trailing twelve-month figures accelerated meaningfully. Meanwhile, the S&P 500 Total Return Index declined, reinforcing the structural diversification benefit that trend following provides when equity markets falter.
The TTU Trend Following Index led with a 4.61 percent advance, followed by the SG Trend Index at 3.90 percent and the BTOP50 at 3.48 percent. These results are all the more notable given the turbulence beneath the surface. The month began with sharp energy reversals and a Barometer decline from 68 to 55, followed by further deterioration to 43 by mid-month as trend breakdowns outpaced new trend formation. For a period, fund performance and underlying conditions diverged, with returns holding up better than the trend environment suggested.
That divergence resolved in the final two weeks through a powerful metals-led rally and the re-establishment of energy and bond trends. Silver surged over twelve percent in a single week, platinum and gold extended to multi-year highs, and the Barometer vaulted from 43 back to 61, reclaiming the favourable zone with conviction. By month-end, performance and conditions were once again aligned, the most constructive outcome for systematic strategies.
The benchmark results for February were as follows:
- TTU Trend Following Index: +4.61 percent for February (trailing 12 months +12.88 percent)
- SG Trend Index: +3.90 percent for February (trailing 12 months +14.91 percent)
- BTOP50 Index: +3.48 percent for February (trailing 12 months +10.74 percent)
- S&P 500 Total Return: -0.76 percent for February (trailing 12 months +17.00 percent)
The trailing twelve-month figures now tell a compelling story. The SG Trend Index stands at 14.91 percent, the TTU TF Index at 12.88 percent, and the BTOP50 at 10.74 percent. These represent a dramatic acceleration from where the indices entered 2026 and underscore the cumulative impact of two consecutive strong months replacing weaker periods from early 2025 in the rolling window.
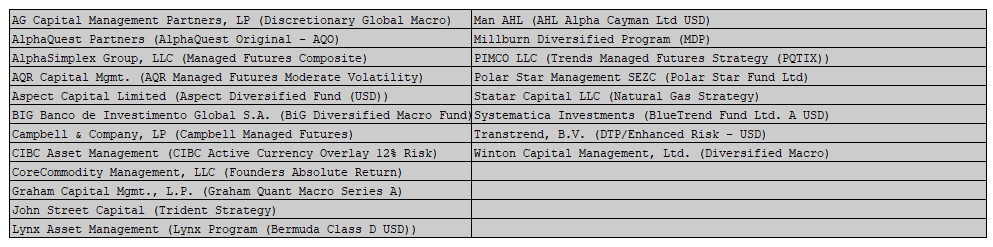
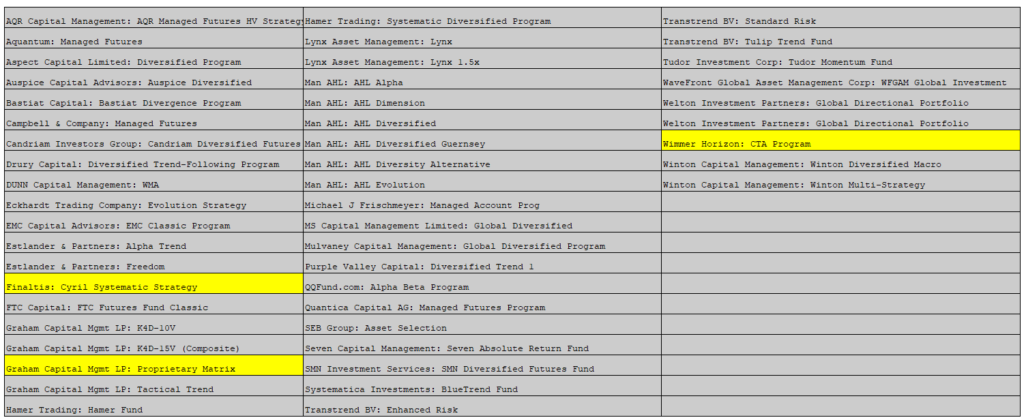
The expansion of the TTU TF Index to 49 active programs, up from 47 in January, continues to reflect the growing depth of the systematic trend-following universe. Two additional programs now meet the stringent inclusion criteria of a minimum 15-year unbroken track record, further broadening the composite's diversification at precisely the time when diversification is proving its worth.
February's message for trend followers is one of validation. The month demonstrated that diversified systematic programs can navigate violent sector rotation, capturing gains from emerging trends in metals, energy, grains, and bonds even as individual sectors experienced sharp reversals. The combination of strong absolute returns, a Barometer reading back in favourable territory, and the S&P 500 finishing in the red provides the clearest illustration of trend following's value proposition in 2026 to date.
February 2026 Trend Index Performance
Trend-following performance in February delivered a second consecutive month of strong gains, though the path was anything but smooth. All three major benchmarks posted advances exceeding three percent, with the TTU Trend Following Index leading at 4.61 percent, the SG Trend Index gaining 3.90 percent, and the BTOP50 advancing 3.48 percent. The S&P 500 Total Return Index declined 0.76 percent, providing a stark contrast that highlighted the diversification value of systematic trend exposure during a month of equity weakness.
The monthly figures, however, mask one of the most turbulent intra-month journeys of the year. February's first two weeks saw the TTU Trend Barometer collapse from 68 to 43, breaching the critical 55 threshold and dropping firmly into neutral territory. Energy positions that had contributed to January's strength reversed sharply, with natural gas giving back much of its historic rally. Soft commodities remained in disarray. US equities weakened as the VIX surged. By mid-month, the trend environment had given back the entirety of January's Barometer gains, and the divergence between positive fund performance and deteriorating underlying conditions raised legitimate questions about sustainability.
The answer came in the final two weeks through a powerful rotation into metals, the re-establishment of energy trends, and the continuation of a grains rally that ultimately extended across the full month. Silver surged over twelve percent in a single week, platinum posted back-to-back gains exceeding nine percent, and gold extended to fresh all-time highs above 5,296 dollars. Heating oil broke out with consecutive weekly gains of eight and seven percent. Bonds resumed their rally after a brief pause. Grains posted four consecutive positive weeks with broadening participation across the complex. The Barometer surged from 43 to 61, reclaiming the favourable zone with genuine momentum rather than tentative stabilisation.
This pattern of mid-month stress followed by a powerful recovery underscores a fundamental characteristic of diversified trend following: the breadth of exposure across uncorrelated markets provides the portfolio with multiple paths to recovery even when individual sectors experience sharp reversals. February's returns were not driven by a single theme but by the sequential contribution of different asset classes as the opportunity set rotated beneath the surface.
The TTU TF Index led the benchmarks for a second consecutive month, reflecting the advantage of its construction methodology during periods of elevated rotation. With the index now composed of 49 programs, up from 47 in January, and 46 of those reporting for February, the composite captured an even broader cross-section of systematic trend-following behaviour. The additional diversification proved its worth in a month where program-level dispersion was driven by the timing and magnitude of sector exposures rather than by consistent directional moves.
The fact that all three benchmarks delivered positive returns while the S&P 500 declined is perhaps February's most significant observation. In months where equity markets weaken and trend conditions remain constructive, the uncorrelated nature of systematic trend following is at its most visible. February 2026 provided exactly this combination, reinforcing the case for trend following as a structural portfolio diversifier rather than merely an alternative source of return.
SG Trend Index
The SG Trend Index is designed to track the 10 largest trend following CTAs of the Managed Futures space.
Criteria for inclusion in the Index, as determined by Société Générale, are as follows:
- Must trade primarily futures (including FX forwards);
- Must be broadly diversified across asset classes;
- Must be an industry recognized trend follower;
- Must exhibit significant correlation to trend following peers;
- Must be open to new investment; and
- Must report returns on a daily basis (net of fees).
The index currently is:
- Equally weighted;
- Calculated in base currency;
- Has an inception date of 1st January 2000;
- Rebalanced annually on 1st January; and
- Reconstituted annually on 1st January based on eligibility criteria.
There was a slight modification to the Index from January 2013 to the present. Previously the Programs needed to be a constituent of the SG CTA Index, and the 10 largest Managers was not a requirement.
For the 2026 year, following the annual rebalance of the Index, we say goodbye to the Systematica Investments (BlueTrend) Program and welcome back the PIMCO LLC (PIMCO Trends Managed Futures) Program. The listing of the 10 eligible programs in the Index for 2026 is as follows:
| MANAGER | PROGRAM |
|---|---|
| AlphaSimplex Group | ASG Managed Futures |
| AQR Capital Management | Managed Futures |
| Aspect Capital | Core Diversified |
| Graham Capital Management | Tactical Trend A |
| iSAM | Vector |
| Lynx Asset Management AB | Lynx Program Bermuda D |
| Man Group plc | Man AHL Alpha |
| PIMCO LLC | PIMCO Trends Managed Futures |
| Transtrend | DTP/Enhanced Risk - USD |
| Winton Capital Management | Winton Trend |
The SG Trend Index, which tracks the ten largest institutional trend-following CTAs, advanced 3.90 percent in February, extending the strong start to 2026 with a second consecutive month of meaningful gains. The advance brought the trailing twelve-month return to 14.91 percent, a remarkable acceleration that reflects the compounding benefit of two strong months replacing weaker periods from early 2025 in the rolling window.
The result is all the more notable given the path taken during the month. The largest institutional programs navigated violent sector rotation, with energy positions reversing sharply in early February before recovering, metals delivering explosive gains in the final two weeks, and bonds and grains providing steady directional contributions throughout. The ability of these large-scale diversified programs to capture gains across rotating sectors, while absorbing the drawdowns from individual reversals, is precisely what their scale and diversification are designed to deliver.
The long-term characteristics of the SG Trend Index remain intact. Since inception, it has delivered a historical CAGR of 5.63 percent with a maximum drawdown of 20.61 percent, reflecting both the durability and the inherent cyclicality of large-scale systematic programs. The improvement in CAGR from 5.49 percent at the close of January to 5.63 percent now reflects the positive contribution of the strong early-2026 performance to the long-term track record. These managers tend to benefit meaningfully when sustained trends reassert themselves, and the combination of metals strength, energy recovery, and grain persistence through February confirms that this dynamic is firmly in play.
Since its launch in 2000, the SG Trend Index has maintained its role as a core institutional benchmark for trend-following performance. It consistently sits between the higher-returning TTU Trend Following Index and the broader BTOP50 Index, capturing the central tendency of the industry's largest managers. Its high correlation of 0.95 with the TTU TF Index reinforces its usefulness as a barometer of collective institutional behaviour, even as its construction produces more moderated long-run returns relative to smaller or more aggressive trend-following composites.
The performance of the SG Trend Index since 1st January 2000 to the end of last month is seen in the chart below:
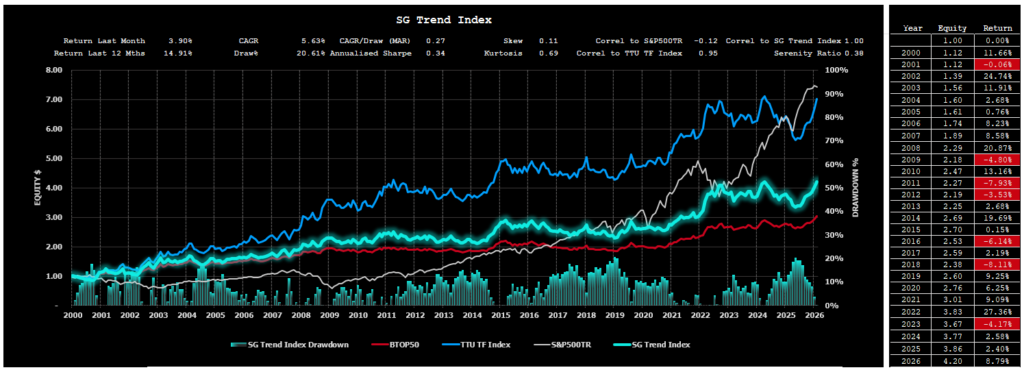
You will notice how the SG Trend Index is highly correlated with the BTOP50 Index and the TTU TF Index and uncorrelated with the S&P500TR Index.
Despite the high correlation between the various trend following Indexes, the long-term performance of these three Trend Following Indexes in terms of CAGR is different. The SG Trend Index plots between the BTOP50 Index and the TTU TF Index.
BTOP 50 Index
The BTOP50 Index seeks to replicate the overall composition of the managed futures industry with regards to trading style and overall market exposure. Unlike the SG Trend Index and the TTU TF Index, the BTOP50 is not strictly a trend-following index and is more broadly representative of the entire managed futures segment, of which a dominant style is trend following. We like to think of the BTOP 50 as a ‘quasi trend-following Index’ as opposed to a pure trend-following Index.
Like the SG Trend Index, the BTOP50 Index is designed to track the performance of the largest Programs by AUM, however the Programs included may not be all Trend Following Programs.
The criteria for inclusion in the Index as determined by BarclayHedge are as follows:
- Must be a Program represented in the Barclay CTA Universe;
- In each Calendar year, the Programs selected must in aggregate be no less than 50% of the investable assets of the Barclay CTA Universe;
- The Programs must be open for investment;
- The Manager must be willing to provide Barclay Hedge with daily return performance;
- The Program must have at least two years of trading activity; and
- The Program’s advisor must have at least three years of operating history.
The index currently is:
- Equally weighted;
- Rebalanced annually on 1st January
- Reconstituted annually on 1st January based on eligibility criteria.
Despite the '50' tag in the BTOP 50 description, the 2026 constituent listing has not yet been released by BarclayHedge at the time of this report. The 2025 listing of 20 constituents remains the most recent available reference.
The BTOP50 Index delivered a 3.48 percent gain in February, extending the strong start to 2026 with a second consecutive month of positive returns. Over the trailing twelve months, the index now stands at 10.74 percent, a substantial acceleration from the 6.82 percent recorded at the close of January and reflecting the powerful compounding effect of consecutive strong months replacing weaker periods from early 2025 in the rolling window.
After leading all three benchmarks in January with a 5.03 percent advance, the BTOP50 settled into third position in February behind the TTU TF Index and the SG Trend Index. This shift in relative positioning is consistent with the changing character of the month's opportunity set. January's gains were driven by broad directional moves that rewarded the BTOP50's wider net of managed futures strategies. February's returns were more dependent on the ability to navigate violent sector rotation and capture gains from rapidly shifting themes, a dynamic that tends to favour the more concentrated trend-following composites whose programs are specifically designed for directional persistence.
The long-term profile of the BTOP50 remains consistent with its design. Since inception, it has produced a historical CAGR of 4.34 percent with a maximum drawdown of 15.94 percent, reinforcing its reputation for stability and risk moderation. The improvement in CAGR from 4.28 percent at the close of January reflects the positive contribution of the strong early-2026 performance to the long-term track record.
February demonstrated both the strengths and the limitations of the BTOP50's broad construction. The index participated fully in the month's gains, capturing returns from the diverse set of trends that emerged across metals, energy, grains, and bonds. However, its inclusion of non-trend-following managed futures strategies moderated the upside relative to purer trend composites during a month when the most profitable opportunities came from strong directional moves in specific sectors. This is the structural trade-off inherent in the BTOP50's design: broader diversification provides stability but dilutes the convexity that pure trend-following composites deliver when directional conditions strengthen.
The index's high correlation of 0.96 with the SG Trend Index and 0.93 with the TTU TF Index confirms that its performance remains closely aligned with its trend-following peers, even as its broader mandate produces more moderated long-term returns. The negative correlation of -0.11 with the S&P 500 Total Return Index was once again evident in February, as the BTOP50 advanced while equities declined, reinforcing the diversification value of managed futures exposure within multi-asset portfolios.
The performance of the BTOP 50 Index since 1st January 2000 to the end of last month is seen in the chart below:
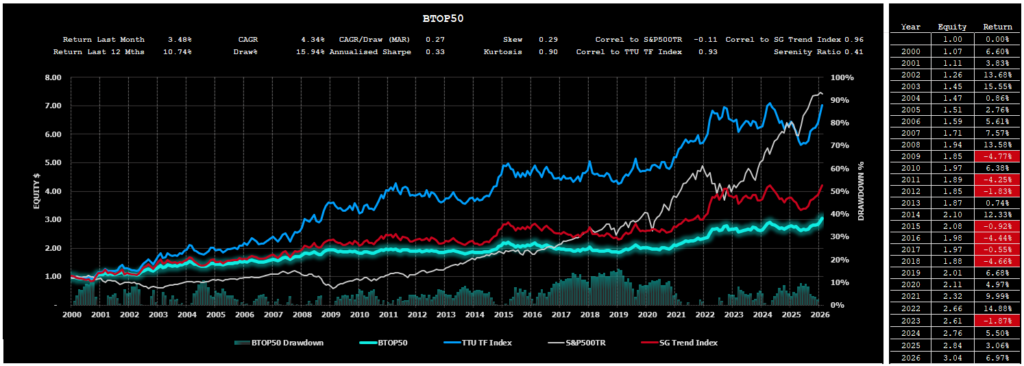
The BTOP 50 Index is highly correlated with the trend following Indexes of the SG Trend Index and the TTU TF Index, however its long-term performance is the lowest of the 3 Trend Following Indexes. While there is a significant representation of Trend Following Programs within the Index, the non-trend following Programs contribute to this diluted long-term performance.
TTU TF Index
The TTU TF Index has been developed by Top Traders Unplugged to provide a performance measure of the trend-following programs with a long-term track record.
At TTU, we recognize the importance of a robust trading approach to these uncertain markets and feel that AUM is not a good robustness measure when it comes to assessing performance of the trend-following industry. It is our strong opinion that the ultimate selection measure to apply in constituting a Trend Following Index is not AUM or a proxy risk metric such as the Sharpe, Sortino, MAR ratio, Ulcer Index or Serenity ratio. The superior metric to assess long-term performance is the long-term validated track record itself.
We have therefore developed a different method for constructing our TTU TF Index.
The criteria for inclusion into the TTU TF Index are as follows:
- Monthly performance results need to be captured in the Nilsson Hedge CTA database;
- Must be geographically diversified across asset classes;
- Must be fully systematic in nature using quantitative rules for entry and exit;
- Must possess at least a 15-year unbroken track record to the current reporting month;
- Must adopt trend following as their dominant investment strategy;
- Are currently active programs; and
- Must report performance monthly (net of fees).
The Index:
- Is Equally weighted;
- Is Rebalanced monthly;
- Is Reconstituted monthly;
- Has an inception date of 1st January 2000
As of February 28, 2026, the TTU Trend Following Index is composed of 49 active programs, each with a long-term, fully verified performance record. The continued expansion from 43 programs at the close of 2025 to 47 in January and now 49 in February reflects the growing depth of the systematic trend-following universe, with additional programs now meeting the stringent 15-year track record requirement. The monthly index return reflects the equal-weighted average performance of all programs reporting for the period.
For February, 46 of the 49 programs submitted performance data by the reporting cut-off. The index therefore captures a broad cross-section of systematic trend-following behaviour, while maintaining continuity and consistency in its long-term construction.
The performance of the TTU TF Index from 1st January 2000 to the end of last month is as follows:
Now you might be intrigued by the performance result of the TTU TF Index. While it is highly correlated with the BTOP 50 Index and the SG Trend Index, we can see that long term performance of the TTU TF Index clearly outstrips alternative Index measures.
The dominant contributor of this outperformance is the requirement for any participating Program in the Index to have a long-term track record. You see, using AUM as a criterion for inclusion is not necessarily a useful selection criterion. While AUM reflects 'market appeal', it does not imply that this 'market appeal' is strongly correlated with 'long term performance'.
Our process of Index construction gives us an insight into how any diversified ensemble of trend following Programs with a long-term track record approaches an optimal portfolio as we increase the number of Programs in the Index. Simply by diversifying into a large ensemble of Trend Following Programs with a long-term track record, we magically improve the Index result. CAGR is increased and our drawdowns are reduced.
Of course, we already know this 'diversification' principle of Trend Following. As we increase our diversification efforts, we obtain improvement both in terms of the maximum drawdown and in the CAGR generated by the ensemble. This is why we seek to strive for maximum market and system diversification within our individual programs. The TTU TF Index just takes this diversification one step further and diversifies across many different TF Programs to deliver a superior risk-adjusted result.
TTU TF Index Performance
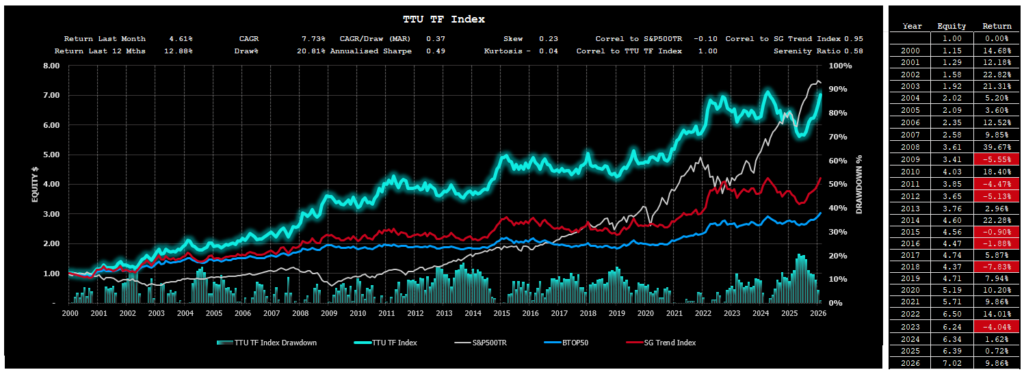
The TTU Trend Following Index, composed exclusively of long-tenured systematic trend programs, advanced 4.61 percent in February, leading all three benchmarks for a second consecutive month and extending the strongest start to a calendar year since the index's inception. Over the trailing twelve months, the index now stands at 12.88 percent, a dramatic acceleration from the 3.61 percent recorded just one month ago and reflecting the transformative impact of two consecutive months of strong performance replacing weaker periods from early 2025 in the rolling window.
February's result was earned through navigating one of the most challenging intra-month environments of recent memory. The month's first two weeks brought sharp energy reversals, a Barometer collapse to 43, and legitimate questions about the sustainability of January's momentum. The second half delivered a powerful metals-led rally, the re-establishment of energy trends, and a Barometer recovery to 61. Programs that maintained disciplined exposure through the mid-month turbulence were rewarded as conditions rotated and new trend opportunities emerged. This is precisely the environment where the TTU TF Index's construction methodology proves its worth, as the diversification across 49 long-tenured programs smooths the impact of sector-level reversals while capturing the central tendency of the broader trend-following opportunity.
The long-term profile of the TTU TF Index continues to strengthen. Since its inception in 2000, the index has delivered a CAGR of 7.73 percent with a maximum drawdown of 20.81 percent. The improvement in CAGR from 7.54 percent at the close of January to 7.73 percent now reflects the meaningful contribution of the strong early-2026 performance to the long-term track record. These characteristics continue to reflect the strength of the construction methodology, which prioritises the durability of verified track records over scale, popularity, or short-term risk statistics.
The TTU TF Index continues to exhibit strong alignment with institutional benchmarks, maintaining a correlation of 0.95 with the SG Trend Index and 0.93 with the BTOP50 Index. Yet despite these close relationships, it has consistently delivered superior long-term risk-adjusted performance. The expansion to 49 programs further reinforces the diversification advantage that underpins this outperformance. With six additional programs joining the composite since year-end, the index captures an even broader cross-section of systematic trend-following behaviour, enhancing its ability to smooth idiosyncratic variation while preserving the long-term performance edge that track-record-based selection delivers.
For comparison, the S&P 500 Total Return Index declined 0.76 percent in February and now stands at 17.00 percent over the trailing twelve months. Since 2000, the S&P 500 TR has produced a CAGR of 7.96 percent, but with a substantially larger maximum drawdown of 50.95 percent. February provided a particularly clear illustration of the structural diversification benefit, as the TTU TF Index advanced 4.61 percent while equities declined. The low correlation of -0.10 between the two indices confirms that the sources of return remain fundamentally different, and months like February demonstrate that this negative correlation is not merely a statistical artefact but a genuine portfolio benefit when it matters most.

TTU Trend Barometer
The TTU Trend Barometer closed February at 61, retreating modestly from January's reading of 68 but remaining firmly in favourable territory well above the critical 55 threshold. The month-end figure, however, tells only a fraction of the story. February's Barometer journey was the most eventful of the year, and understanding the path is essential to interpreting the destination.
The Barometer, which measures the persistence of price trends across 44 global futures markets, began the month at 68 before declining sharply through the first two weeks. Energy reversals, soft commodity disarray, weakening US equities, and a sharp meats reversal drove the reading down to 55 in the first week and then to 43 by mid-month, breaching the critical threshold and dropping firmly into the neutral zone where trend-following historically faces headwinds. For a period, the positive divergence between fund performance and underlying conditions raised legitimate concerns about sustainability.
The recovery that followed was decisive. In the third week, the Barometer stabilised at 45 as metals began to strengthen and energy trends re-established. In the final week, the reading surged 16 points from 45 to 61 as silver exploded higher, platinum and gold extended powerfully, heating oil broke out, bonds resumed their rally, and grains posted a fourth consecutive positive week. The 10-day rate of change shifted to "Rising Moderately," confirming that the improvement carried genuine momentum rather than representing a tentative bounce.
The month's Barometer trajectory, from 68 to 43 and back to 61, carries several important messages. First, the mid-month deterioration demonstrated that the favourable regime signalled in January was not immune to challenge. Violent sector rotation can compress trend breadth quickly, even when the broader direction of travel remains constructive. Second, the recovery demonstrated that new trends are forming across multiple asset classes simultaneously. Metals, energy, bonds, and grains all contributed to the Barometer's recovery, suggesting the improvement is broad-based rather than dependent on a single sector. Third, the speed and conviction of the rebound from 43 to 61 in just two weeks suggests underlying trend conditions are more robust than the mid-month reading indicated.
At 61, the Barometer enters March in a constructive position. The reading sits comfortably within the favourable zone above 55, supported by strengthening trends in metals, energy, grains, and bonds. While the intra-month volatility serves as a reminder that conditions can shift rapidly, the balance of evidence at month-end points toward a trend environment that is broadening and maturing rather than deteriorating. For systematic programs, this represents the kind of backdrop where disciplined positioning and diversification are most likely to be rewarded.
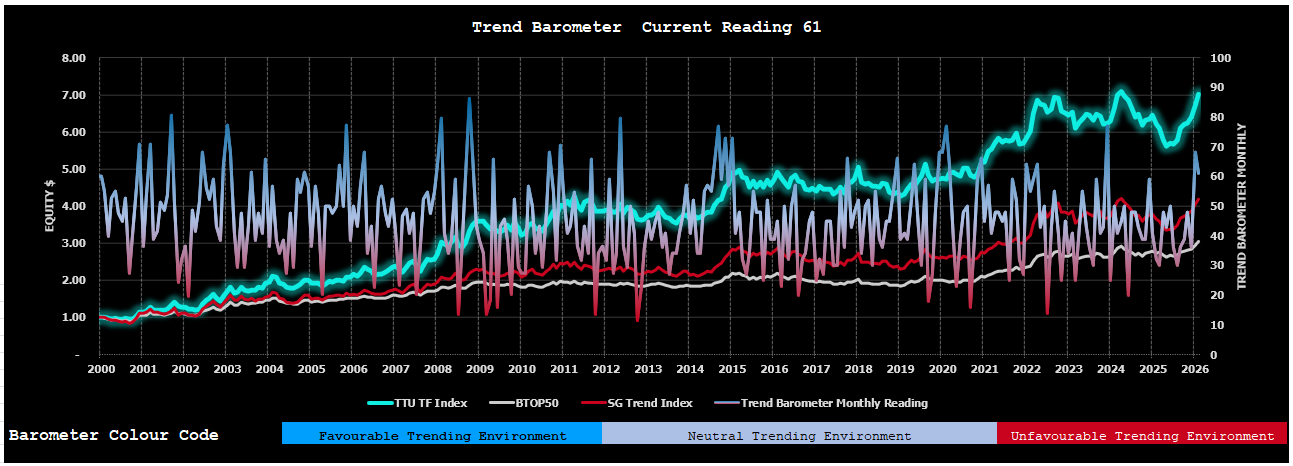
The Trend Barometer is a proprietary tool we use at TTU to assess the trend strength of a diversified portfolio consisting of 44 markets across all sectors. We firstly subdivide the trend strength of each market of a hypothetical diverse portfolio into five ranges from strong up, medium up, neutral, medium down and strong down. We then aggregate these results into a single portfolio number which we use to describe the overall trend strength across a hypothetical Program portfolio.
We then arbitrarily divide this percentage range into 3 where a value of 0-30 is considered a very unfavourable market regime for trend following programs, a range between 30 to 55 is a somewhat neutral environment for Trend Following Programs (but not an environment where you could expect consistent performance) and values more than 55 are considered to be a favourable regime for trend following programs, where they should see good performance.
Aside from the occasional dispersed readings when compared to overall trend following performance, this method is surprisingly powerful in describing CTA monthly performance and can be used to connect market trading environments to resultant manager performance.
The Macro Environment
For a blow-by-blow macro wrap for the month, we recommend you listen to our weekly systematic investor series by clicking on the links below. It is also worthwhile listening to our past catalogue, as it provides you with an understanding of how these markets can shape the emotions of a trader and why it is therefore essential that trend followers adopt systematic rules-based processes to keep these emotions in check.
You can find all of our weekly conversations by clicking this link.
Top 10 Lists
We have prepared the following Top 10 lists (excluding non-reporting programs) for various performance categories based on monthly performance returns for a 15-year period commencing 1st January 2011 to the current month.
Top 10 Listing – by Compound Annual Growth Rate

Top 10 Listing – by Risk Adjusted Return (Serenity Ratio)
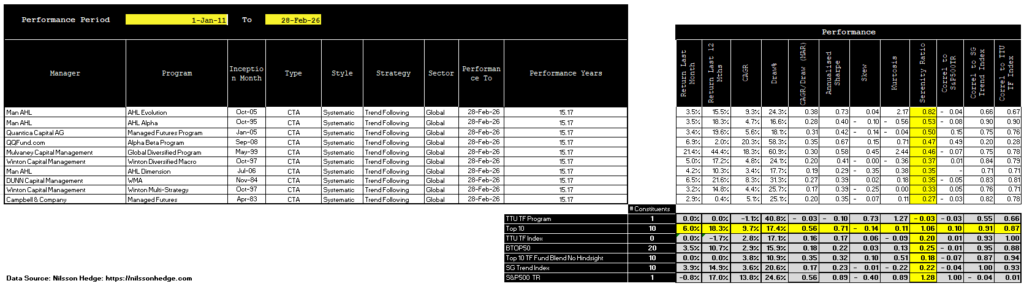

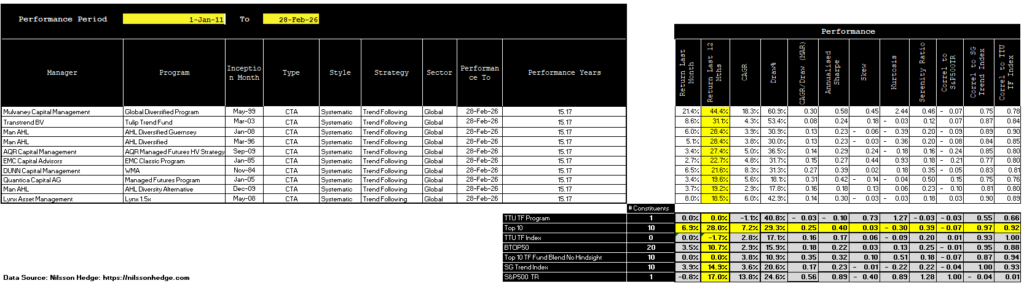
Top 10 Listing – by Last 12 months Performance
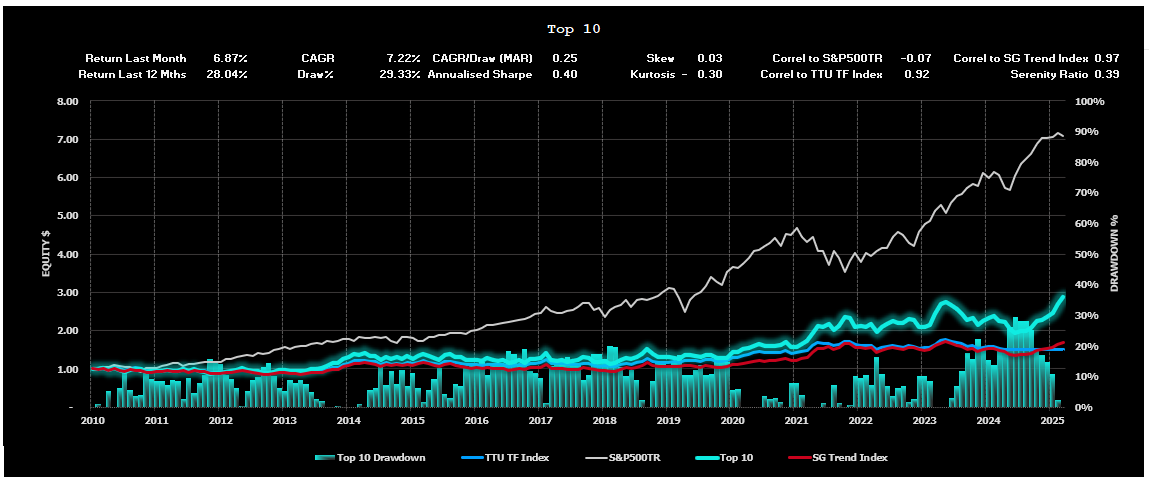
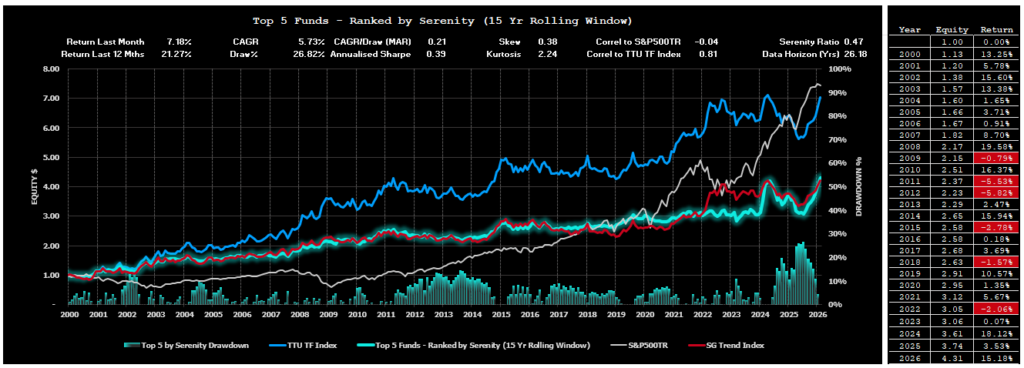
Performance Results for the TTU Top 5 by Serenity Ratio
In a research project we undertook at TTU, we examined three different allocation methods that could be deployed by an investor seeking to optimally allocate investment funds towards 5 of the top-ranked Globally Diversified Systematic Trend Following Programs with a long-term track record.
These three methods adopted 3 different forms of performance metric, namely:
- Top 5 performers by Compound Annual Growth Rate (CAGR) using a rolling lookback of 15 years.
- Top 5 performers by MAR ratio (CAGR/Max Draw%) using a rolling lookback of 15 years.
- Top 5 performers by Serenity Ratio using a rolling lookback of 15 years.
The findings of our project can be obtained by clicking on this link.
Our research determined that the optimal selection method was the Serenity Ratio method.
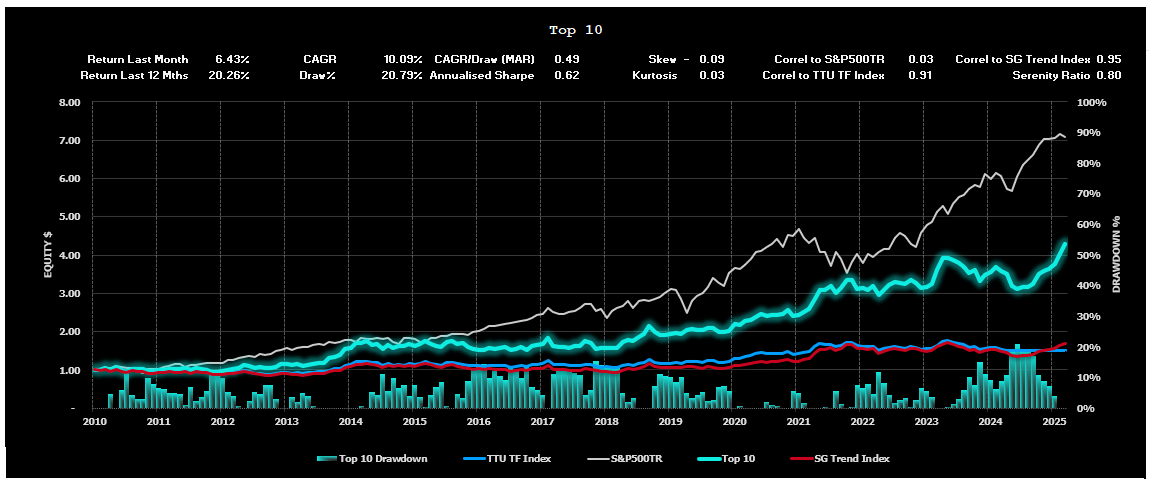
The Serenity Top 5 Selection Method delivered a 7.18 percent gain in February, its strongest monthly result of the year and a powerful continuation of the momentum established in January. The gain brought the trailing twelve-month return to 21.27 percent, a remarkable acceleration that underscores the compounding benefit of two consecutive months of exceptional performance. The year-to-date return of 15.18 percent through just two months represents one of the strongest starts to a calendar year in the composite's history.
February's result was particularly impressive given the turbulence beneath the surface. The Serenity-selected managers navigated violent sector rotation through the month, with sharp energy reversals and a Barometer collapse to 43 in the first two weeks giving way to an explosive metals-led rally and the re-establishment of energy and bond trends in the second half. The composite's ability to deliver a return of this magnitude through such challenging intra-month conditions validates the Serenity framework's emphasis on selecting programs with stable, process-driven approaches that can adapt to rapidly shifting opportunity sets without relying on aggressive risk expansion.
Following the annual reconstitution in February, the 2026 Serenity selection retains all five programs from the 2025 listing, though the ranking order has shifted. The continuity of the selection reflects the durability and consistency of these managers' risk-adjusted performance across a full 15-year evaluation window. Mulvaney Capital Management's Global Diversified Program continues to be the primary source of variability within the portfolio. Its high-convexity profile was once again on full display in February, amplifying portfolio outcomes as the metals complex surged and directional moves strengthened across multiple asset classes. In an environment where the Barometer recovered from 43 to 61 in just two weeks, Mulvaney's tendency to benefit from expanding trend persistence contributed meaningfully to the composite's exceptional result. This behaviour remains a defining feature of the Serenity composite, introducing controlled variability while preserving long-term asymmetry.
The Serenity Ratio continues to prove effective as a manager selection tool by prioritising durability, drawdown control, and long-term persistence over short-term performance metrics. Across the full reporting horizon, the Serenity composite has delivered a CAGR of 5.73 percent with a maximum drawdown of 26.82 percent, while maintaining a low correlation of -0.04 to the S&P 500 Total Return Index. These characteristics reinforce its role as a structural diversifier within multi-asset portfolios. February's combination of a 7.18 percent gain alongside a 0.76 percent equity decline provided one of the clearest demonstrations of this diversification benefit, confirming that the sources of return within the Serenity composite remain fundamentally distinct from those driving traditional markets.
The 2026 Serenity selection is as follows and will be maintained for the investment period between 1st February 2026 to 31st January 2027:
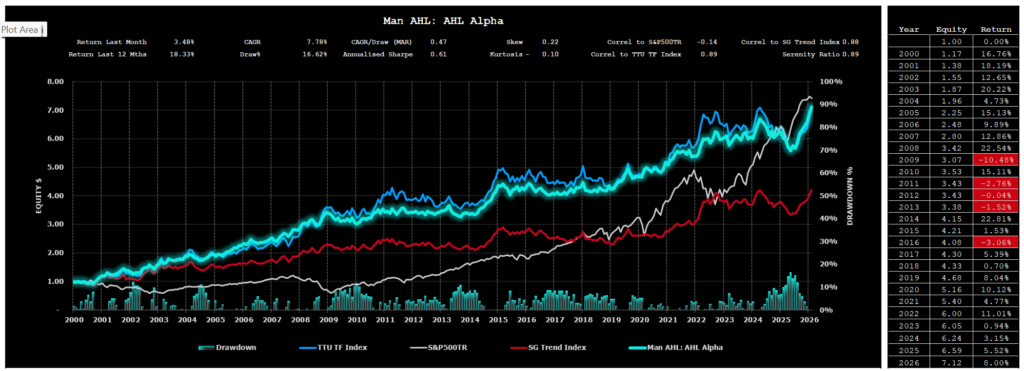
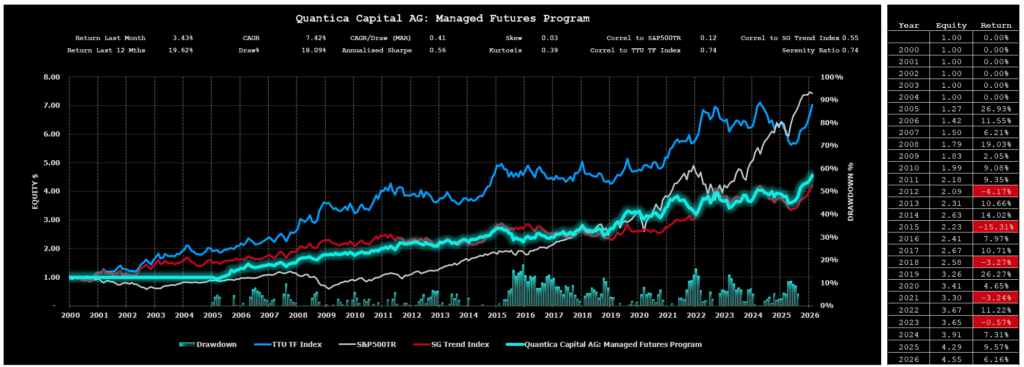
- Man AHL: AHL Evolution;
- Man AHL: AHL Alpha;
- Quantica Capital AG: Managed Futures Program;
- Mulvaney Capital Management: Global Diversified Program; and
- Man AHL: AHL Dimension.
Individual Performance Results for the 5 Programs used for the Serenity allocation to the reporting month using the 2026 listing are as follows:


Performance Results for the Alternative 60/40 portfolio using the TTU Top 5 by Serenity Ratio
In our “How to Invest with the Best”blog post, we also highlighted the significant improved risk-adjusted performance results that could be achieved by replacing the 40% allocation to Bonds in the traditional 60/40 portfolio with an allocation of 40% towards the TTU Top 5 by Serenity ratio.
The evaluation compared the performance of a traditional 60% Equity/40% Bond portfolio against a 60% Equity/40% Serenity portfolio to highlight the uncorrelated historical nature of this Alternative 60/40 portfolio and demonstrate the benefits that a sizeable allocation towards the Serenity portfolio would bring to an investor if equity and bond markets go back to their historic relationship and become more positively correlated in the future. There is no guarantee that correlations remain static over time and it is possible that bond markets and equity markets may lose their uncorrelated relationship that has existed in the last 20 years or so. It is far less likely that the TF managers within the Serenity Grouping will ever be strongly positively correlated to the Equities market, over the long run, given the extensive global diversification and ability to go long and short, that is present within the constituents of the Serenity Grouping.
Chart 21 below showcases the comparative performance results for the period 1 January 2000 to the end of last month:
- A 100% investment in the S&P500TR portfolio;
- A 100% investment in the VBMFX which is a proxy for the bond market;
- A 100% investment in the VBIAX which is a suitable proxy for the classic 60% Equity/40% Bond portfolio;
- A 100% investment in a 60% S&P500TR 40% Serenity portfolio; and
- A 100% investment in the Serenity Portfolio.
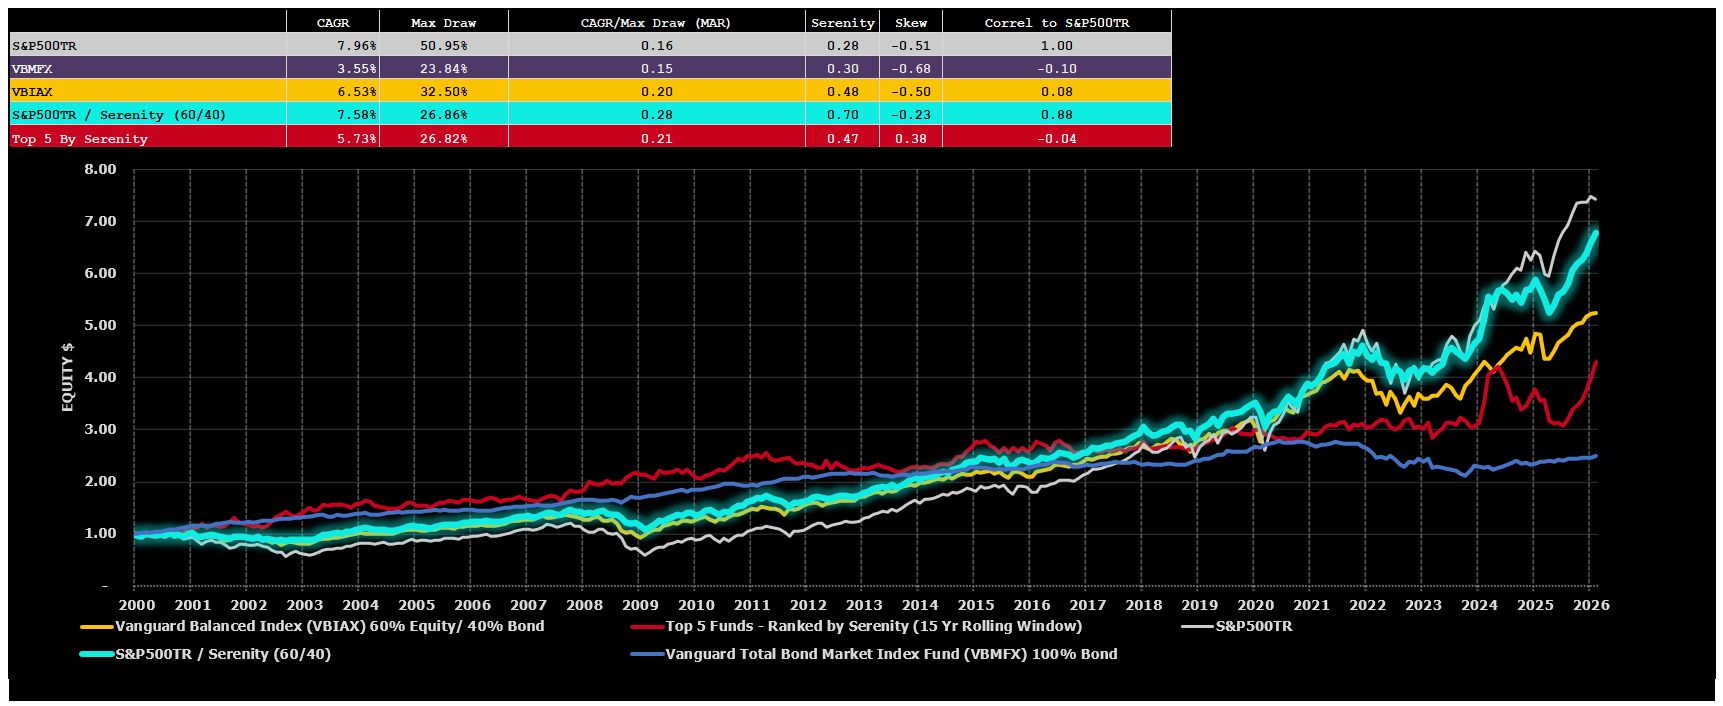
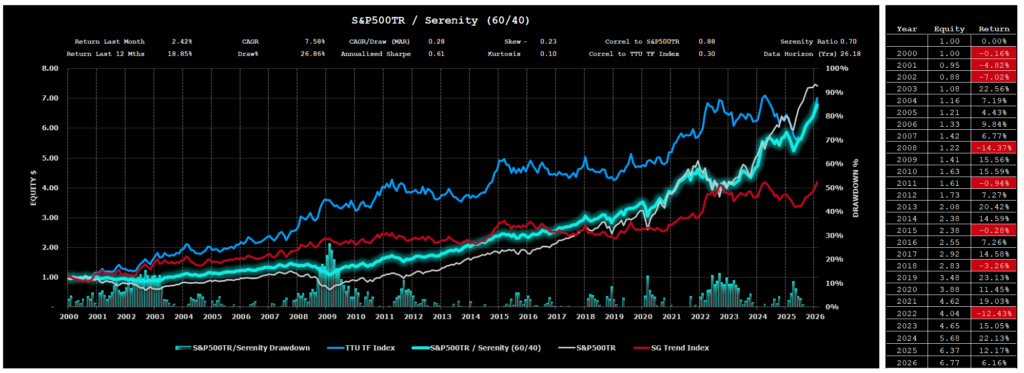
The comparison of alternative portfolio allocations above highlights the strong historic risk adjusted returns that have been enjoyed by 60% S&P500TR / 40% Serenity Composite Portfolio.
A more detailed assessment of this powerful 60/40 investment option is reflected below.
Important Disclaimers
This document is directly solely to Accredited Investors, Qualified Eligible Participants, Qualified Clients and Qualified Purchasers. No investment decision should be made until prospective investors have read the detailed information in the fund offering documents of any manager mentioned in this document. This document is furnished on a confidential basis only for the use of the recipient and only for discussion purposes and is subject to amendment This document is neither advice nor a recommendation to enter into any transaction. This document is not an offer to buy or sell, nor a solicitation of an offer to buy or sell, any security or other financial instrument. This presentation is based on information obtained from sources that TopTradersUnplugged (“TTU”) (“considers to be reliable however, TTU makes no representation as to, and accepts no responsibility or liability for, the accuracy or completeness of the information. TTU has not independently verified third party manager or benchmark information, does not represent it as accurate, true or complete, makes no warranty, express or implied regarding it and shall not be liable for any losses, damages, costs or expenses relating to its adequacy, accuracy, truth, completeness or use.
All projections, valuations, and statistical analyses are provided to assist the recipient in the evaluation of the matters described herein. Such projections, valuations and analyses may be based on subjective assessments and assumptions and may use one among many alternative methodologies that produce different results accordingly, such projections, valuations and statistical analyses should not be viewed as facts and should not be relied upon as an accurate prediction of future events. There is no guarantee that any targeted performance will be achieved Commodity trading involves substantial risk of loss and may not be suitable for everyone
TTU is not and does not purport to be an advisor as to legal, taxation, accounting, financial or regulatory matters in any jurisdiction. The recipient should independently evaluate and judge the matters referred to herein. TTU does not provide advice or recommendations regarding an investor’s decision to allocate to funds or accounts managed by any manager (“or to maintain or sell investments in funds or accounts managed by any manager, and no fiduciary relationship under ERISA is created by the investor investing in funds or accounts managed by any manager, or through any communication between TTU and the investor
In reviewing this document, it should be understood that the past performance results of any asset class, or any investment or trading program set forth herein, are not necessarily indicative of any future results that may be achieved in connection with any transaction. Any persons subscribing for an investment must be able to bear the risks involved and must meet the suitability requirements relating to such investment. Some or all alternative investment programs discussed herein may not be suitable for certain investors This document is directed only to persons having professional experience in matters relating to investments. Any investment or investment activity to which this document relates is available only to such investment professionals. Persons who do not have professional experience in matters relating to investments should not rely upon this document.
This document and its contents are proprietary information of TTU and may not be reproduced or otherwise disseminated in whole or in part without TTU’s prior written consent.
This document contains simulated or hypothetical performance results that have certain inherent limitations AND SHOULD BE VIEWED FOR ILLUSTRATIVE PURPOSES. Unlike the results shown in an actual performance record, these results do not represent actual trading. HYPOTHETICAL PERFORMANCE RESULTS HAVE MANY INHERENT LIMITATIONS, SOME OF WHICH ARE DESCRIBED BELOW. NO REPRESENTATION IS BEING MADE THAT ANY ACCOUNT WILL OR IS LIKELY TO ACHIEVE PROFITS OR LOSSES SIMILAR TO THOSE SHOWN IN FACT, THERE ARE FREQUENTLY SHARP DIFFERENCES BETWEEN HYPOTHETICAL PERFORMANCE RESULTS AND THE ACTUAL RESULTS SUBSEQUENTLY ACHIEVED BY ANY PARTICULAR INVESTMENT ACCOUNT.
ONE OF THE LIMITATIONS OF HYPOTHETICAL PERFORMANCE RESULTS IS THAT THEY ARE GENERALLY PREPARED WITH THE BENEFIT OF HINDSIGHT IN ADDITION, HYPOTHETICAL TRADING DOES NOT INVOLVE FINANCIAL RISK, AND NO HYPOTHETICAL TRADING RECORD CAN COMPLETELY ACCOUNT FOR THE IMPACT OF FINANCIAL RISK IN ACTUAL TRADING FOR EXAMPLE, THE ABILITY TO WITHSTAND LOSSES OR TO ADHERE TO A PARTICULAR TRADING PROGRAM OR OTHER ASSET.
There are numerous other factors related to the markets in general or to the implementation of any specific trading program which cannot be fully accounted for in the preparation of hypothetical performance results and all of which can adversely affect actual trading results. No representation is being made that any investment will or is likely to achieve profits or losses similar to those being shown.
Most Comprehensive Guide to the Best Investment Books of All Time

Most Comprehensive Guide to the Best Investment Books of All Time
Get the most comprehensive guide to over 600 of the BEST investment books, with insights, and learn from some of the wisest and most accomplished investors in the world. A collection of MUST READ books carefully selected for you. Get it now absolutely FREE!
Get Your FREE Guide HERE!