


Trend Following Performance Report - January, 2025

January 2026: The Tide Turns
January delivered the kind of month trend followers have been waiting for. All three major benchmarks posted gains exceeding four percent, the TTU Trend Barometer surged into favourable territory, and the breadth of opportunity expanded meaningfully for the first time in over a year. After a 2025 defined by selective participation and patient positioning, January offered the first compelling evidence that a new trend regime may be taking shape.
The BTOP50 Index led with a 5.03 percent advance, followed closely by the SG Trend Index at 4.71 percent and the TTU Trend Following Index at 4.54 percent. Each of these results represents the strongest single-month performance from the respective benchmarks in recent memory, and the fact that the broader BTOP50 led the field suggests that participation extended well beyond pure trend-following strategies into the wider managed futures space. The S&P 500 Total Return Index also advanced, rising 1.45 percent, though its contribution to trend-following gains was secondary to the directional moves unfolding across commodity, currency, and fixed income markets.
The most significant development, however, was the TTU Trend Barometer's surge from 36 to 68. This reading places the Barometer firmly in the favourable zone for the first time since conditions began deteriorating in mid-2025. Unlike December, where strong returns coincided with a falling Barometer and narrowing breadth, January's gains were underpinned by a genuine broadening of trend persistence across global futures markets. Returns and conditions moved in the same direction, a combination that has historically preceded periods of sustained trend-following outperformance.
The benchmark results for January were as follows:
- TTU Trend Following Index: +4.54 percent for January (trailing 12 months +3.61 percent)
- SG Trend Index: +4.71 percent for January (trailing 12 months +7.06 percent)
- BTOP50 Index: +5.03 percent for January (trailing 12 months +6.82 percent)
- S&P 500 Total Return: +1.45 percent for January (trailing 12 months +16.36 percent)
The trailing twelve-month figures tell their own story. The SG Trend Index now stands at 7.06 percent, the BTOP50 at 6.82 percent, and the TTU TF Index at 3.61 percent, each representing a meaningful acceleration from where they closed 2025. While one month does not make a regime, January's combination of strong absolute returns, broadening trend breadth, and improving trailing performance marks a notable departure from the transitional conditions that characterised the prior year.
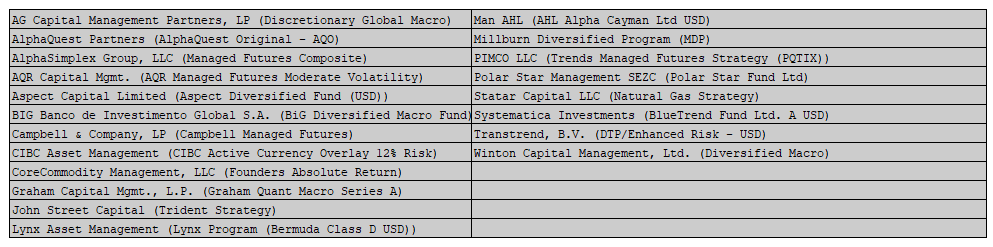
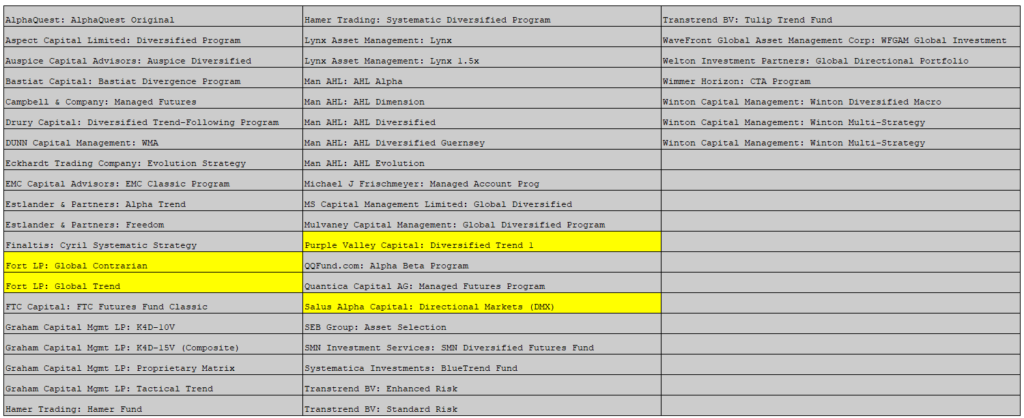
The expansion of the TTU TF Index to 47 active programs, up from 43 at year-end, further reflects the growing depth of the systematic trend-following universe. Four additional programs now meet the stringent inclusion criteria of a minimum 15-year unbroken track record, adding further diversification to an already robust composite.
For trend followers, January 2026 provided what 2025 largely withheld: confirmation that patience and process can be rewarded when conditions shift. Whether this marks the beginning of a sustained favourable regime or an isolated burst of opportunity remains to be seen, but the signals are more encouraging than they have been in some time.
January 2026 Trend Index Performance
Trend-following performance in January marked a decisive shift in both magnitude and character. All three major benchmarks posted gains exceeding four percent, with the BTOP50 Index leading at 5.03 percent, followed by the SG Trend Index at 4.71 percent and the TTU Trend Following Index at 4.54 percent. These were not merely strong returns in isolation; they arrived alongside a surge in the TTU Trend Barometer from 36 to 68, confirming that January's gains were supported by a genuine broadening of trend persistence across global markets.
This alignment between returns and underlying conditions represents a meaningful departure from the pattern that defined much of 2025. Throughout last year, and particularly in December, strong index-level performance often coincided with a narrowing opportunity set, as returns were concentrated in a handful of established positions rather than driven by expanding trend breadth. January reversed that dynamic. The Barometer's move into favourable territory above 55 signals that directional coherence strengthened across sectors, providing fresh entry points alongside the continuation of existing trends.
The fact that the BTOP50 led the field is itself significant. As the broadest of the three benchmarks, encompassing managed futures strategies beyond pure trend following, the BTOP50's outperformance suggests that January's directional moves were sufficiently powerful to benefit a wide range of systematic approaches. When the BTOP50 leads, it typically reflects an environment where trend participation has extended beyond the core trend-following community into the broader managed futures space.
Equity markets contributed positively, with the S&P 500 advancing 1.45 percent, though trend-following gains were driven primarily by moves across commodity, currency, and fixed income markets where directional shifts were more pronounced and more persistent. The improvement in fixed income trend conditions was particularly notable after a prolonged period of oscillation that had frustrated systematic positioning throughout much of 2025.
Dispersion across programs, while still present, narrowed relative to the selective conditions of the prior year. In an environment where trend breadth is expanding, more programs are able to participate in the opportunity set, reducing the gap between leaders and laggards. This is consistent with a regime shift toward broader trend alignment, where process and diversification are rewarded more uniformly than in environments where returns depend on concentrated bets in a narrow set of markets.
The TTU Trend Following Index demonstrated the stabilising effect of diversification across long-tenured systematic programs. With the index now composed of 47 programs, up from 43 at year-end, and 43 of those reporting for January, the breadth of the composite has expanded further. This additional diversification reinforces the index's ability to capture the central tendency of disciplined trend-following behaviour while smoothing the idiosyncratic variation that inevitably exists across individual programs.
SG Trend Index
The SG Trend Index is designed to track the 10 largest trend following CTAs of the Managed Futures space.
Criteria for inclusion in the Index, as determined by Société Générale, are as follows:
- Must trade primarily futures (including FX forwards);
- Must be broadly diversified across asset classes;
- Must be an industry recognized trend follower;
- Must exhibit significant correlation to trend following peers;
- Must be open to new investment; and
- Must report returns on a daily basis (net of fees).
The index currently is:
- Equally weighted;
- Calculated in base currency;
- Has an inception date of 1st January 2000;
- Rebalanced annually on 1st January; and
- Reconstituted annually on 1st January based on eligibility criteria.
There was a slight modification to the Index from January 2013 to the present. Previously the Programs needed to be a constituent of the SG CTA Index, and the 10 largest Managers was not a requirement.
For the 2026 year, following the annual rebalance of the Index, we say goodbye to the Systematica Investments (BlueTrend) Program and welcome back the PIMCO LLC (PIMCO Trends Managed Futures) Program. The listing of the 10 eligible programs in the Index for 2026 is as follows:
| MANAGER | PROGRAM |
|---|---|
| AlphaSimplex Group | ASG Managed Futures |
| AQR Capital Management | Managed Futures |
| Aspect Capital | Core Diversified |
| Graham Capital Management | Tactical Trend A |
| iSAM | Vector |
| Lynx Asset Management AB | Lynx Program Bermuda D |
| Man Group plc | Man AHL Alpha |
| PIMCO LLC | PIMCO Trends Managed Futures |
| Transtrend | DTP/Enhanced Risk - USD |
| Winton Capital Management | Winton Trend |
The SG Trend Index, which tracks the ten largest institutional trend-following CTAs, advanced 4.71 percent in January, its strongest monthly result in some time and a powerful start to the new year. The gain brought the trailing twelve-month return to 7.06 percent, a notable acceleration from the 2.40 percent recorded at the close of 2025 and reflecting the compounding benefit of January’s broad-based rally replacing weaker months from early 2025 in the rolling window.
The long-term characteristics of the SG Trend Index remain intact. Since inception, it has delivered a historical CAGR of 5.49 percent with a maximum drawdown of 20.61 percent, reflecting both the durability and the inherent cyclicality of large-scale systematic programs. These managers tend to benefit meaningfully when sustained trends reassert themselves, and January’s results suggest that precisely this dynamic may now be unfolding. The surge in the TTU Trend Barometer to 68, well into favourable territory, indicates that the directional coherence these large programs rely upon is broadening across markets.
Since its launch in 2000, the SG Trend Index has maintained its role as a core institutional benchmark for trend-following performance. It consistently sits between the higher-returning TTU Trend Following Index and the broader BTOP50 Index, capturing the central tendency of the industry’s largest managers. Its high correlation of 0.95 with the TTU TF Index reinforces its usefulness as a barometer of collective institutional behaviour, even as its construction produces more moderated long-run returns relative to smaller or more aggressive trend-following composites.
The performance of the SG Trend Index since 1st January 2000 to the end of last month is seen in the chart below:

You will notice how the SG Trend Index is highly correlated with the BTOP50 Index and the TTU TF Index and uncorrelated with the S&P500TR Index.
Despite the high correlation between the various trend following Indexes, the long-term performance of these three Trend Following Indexes in terms of CAGR is different. The SG Trend Index plots between the BTOP50 Index and the TTU TF Index.
BTOP 50 Index
The BTOP50 Index seeks to replicate the overall composition of the managed futures industry with regards to trading style and overall market exposure. Unlike the SG Trend Index and the TTU TF Index, the BTOP50 is not strictly a trend-following index and is more broadly representative of the entire managed futures segment, of which a dominant style is trend following. We like to think of the BTOP 50 as a ‘quasi trend-following Index’ as opposed to a pure trend-following Index.
Like the SG Trend Index, the BTOP50 Index is designed to track the performance of the largest Programs by AUM, however the Programs included may not be all Trend Following Programs.
The criteria for inclusion in the Index as determined by BarclayHedge are as follows:
- Must be a Program represented in the Barclay CTA Universe;
- In each Calendar year, the Programs selected must in aggregate be no less than 50% of the investable assets of the Barclay CTA Universe;
- The Programs must be open for investment;
- The Manager must be willing to provide Barclay Hedge with daily return performance;
- The Program must have at least two years of trading activity; and
- The Program’s advisor must have at least three years of operating history.
The index currently is:
- Equally weighted;
- Rebalanced annually on 1st January
- Reconstituted annually on 1st January based on eligibility criteria.
Despite the '50' tag in the BTOP 50 description, the 2026 constituent listing has not yet been released by BarclayHedge at the time of this report. The 2025 listing of 20 constituents remains the most recent available reference.
The BTOP50 Index delivered a 5.03 percent gain in January, leading all three benchmarks and posting its strongest monthly result in some time. Over the trailing twelve months, the index now stands at 6.82 percent, a substantial acceleration from the 2.81 percent recorded at the close of 2025.
The fact that the BTOP50 led the field in January is noteworthy. As the broadest of the three benchmarks, encompassing a range of managed futures strategies beyond pure trend following, its outperformance signals that January's directional moves were powerful enough to benefit the wider managed futures universe, not just dedicated trend followers. When the BTOP50 outpaces the more trend-concentrated composites, it typically reflects an environment where directional conviction is building across multiple systematic approaches simultaneously.
The long-term profile of the BTOP50 remains consistent with its design. Since inception, it has produced a historical CAGR of 4.28 percent with a maximum drawdown of 15.94 percent, reinforcing its reputation for stability and risk moderation. This reflects the index's broad construction, which includes a wide mix of managed futures strategies beyond pure trend following.
January highlighted the upside of the BTOP50's diversified construction. In contrast to the selective conditions that characterised much of 2025, where narrower trend-focused composites tended to capture more of the available opportunity, the broadening of trend persistence across markets allowed the BTOP50's wider net to work in its favour. The surge in the TTU Trend Barometer from 36 to 68 confirms that directional coherence expanded well beyond a narrow set of markets, creating an environment where breadth of exposure became an advantage rather than a drag.
As a benchmark, the BTOP50 remains a useful reference for managed futures exposure at large. Its strong January result reinforces the observation that when trend conditions genuinely broaden, the benefits extend across the full spectrum of systematic strategies. The index's high correlation of 0.96 with the SG Trend Index and 0.93 with the TTU TF Index confirms that its performance remains closely aligned with its trend-following peers, even as its broader mandate moderates long-term returns relative to purer trend composites.
The performance of the BTOP 50 Index since 1st January 2000 to the end of last month is seen in the chart below:

The BTOP 50 Index is highly correlated with the trend following Indexes of the SG Trend Index and the TTU TF Index, however its long-term performance is the lowest of the 3 Trend Following Indexes. While there is a significant representation of Trend Following Programs within the Index, the non-trend following Programs contribute to this diluted long-term performance.
TTU TF Index
The TTU TF Index has been developed by Top Traders Unplugged to provide a performance measure of the trend-following programs with a long-term track record.
At TTU, we recognize the importance of a robust trading approach to these uncertain markets and feel that AUM is not a good robustness measure when it comes to assessing performance of the trend-following industry. It is our strong opinion that the ultimate selection measure to apply in constituting a Trend Following Index is not AUM or a proxy risk metric such as the Sharpe, Sortino, MAR ratio, Ulcer Index or Serenity ratio. The superior metric to assess long-term performance is the long-term validated track record itself.
We have therefore developed a different method for constructing our TTU TF Index.
The criteria for inclusion into the TTU TF Index are as follows:
- Monthly performance results need to be captured in the Nilsson Hedge CTA database;
- Must be geographically diversified across asset classes;
- Must be fully systematic in nature using quantitative rules for entry and exit;
- Must possess at least a 15-year unbroken track record to the current reporting month;
- Must adopt trend following as their dominant investment strategy;
- Are currently active programs; and
- Must report performance monthly (net of fees).
The Index:
- Is Equally weighted;
- Is Rebalanced monthly;
- Is Reconstituted monthly;
- Has an inception date of 1st January 2000
As of January 31, 2026, the TTU Trend Following Index is composed of 47 active programs, each with a long-term, fully verified performance record. The expansion from 43 programs at year-end reflects four additional programs now meeting the stringent 15-year track record requirement, further broadening the composite's diversification. The monthly index return reflects the equal-weighted average performance of all programs reporting for the period.
For January, 43 of the 47 programs submitted performance data by the reporting cut-off. The index therefore captures a broad cross-section of systematic trend-following behaviour, while maintaining continuity and consistency in its long-term construction.
The performance of the TTU TF Index since 1st January 2000 to the end of last month is as follows:
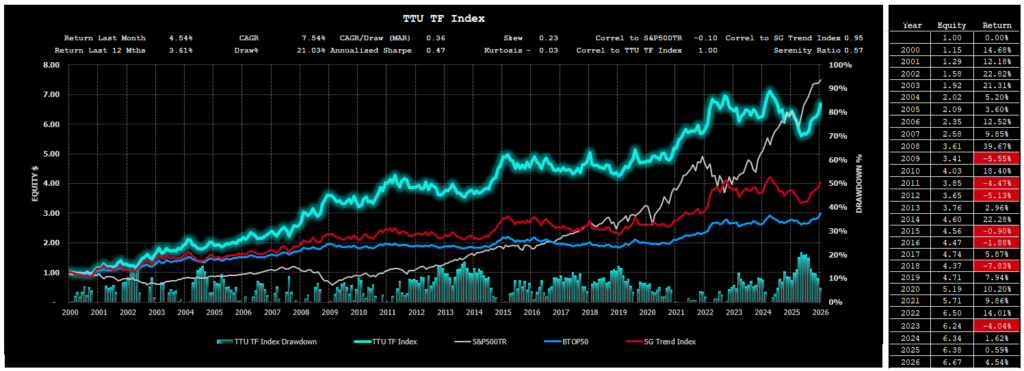
Now, you might be intrigued by the performance result of the TTU TF Index. While it is highly correlated with the BTOP 50 Index and the SG Trend Index, we can see that long term performance of the TTU TF Index clearly outstrips alternative index measures.
The dominant contributor of this outperformance is the requirement for any participating Program in the Index to have a long-term track record. You see, using AUM as a criterion for inclusion is not necessarily a useful selection criterion. While AUM reflects 'market appeal', it does not imply that this 'market appeal' is strongly correlated with 'long-term performance'.
Our process of index construction gives us an insight into how any diversified ensemble of trend-following programs with a long-term track record approaches an optimal portfolio as we increase the number of programs in the index. Simply by diversifying into a large ensemble of trend-following programs with a long-term track record, we magically improve the index result. CAGR is increased, and our drawdowns are reduced.
Of course, we already know this 'diversification' principle of trend following. As we increase our diversification efforts, we obtain improvement both in terms of the maximum drawdown and in the CAGR generated by the ensemble. This is why we seek to strive for maximum market and system diversification within our individual programs. The TTU TF Index just takes this diversification one step further and diversifies across many different TF Programs to deliver a superior risk-adjusted result.
TTU TF Index Performance
The TTU Trend Following Index, composed exclusively of long-tenured systematic trend programs, advanced 4.54 percent in January, delivering a commanding start to 2026 and building emphatically on December's momentum. Over the trailing twelve months, the index now stands at 3.61 percent, a significant improvement from the 1.78 percent recorded at the close of 2025 and reflecting the compounding benefit of January's strong result replacing a weaker month from early 2025 in the rolling window.
The long-term profile of the TTU TF Index remains intact and compelling. Since its inception in 2000, the index has delivered a CAGR of 7.54 percent with a maximum drawdown of 21.03 percent. These characteristics reflect the strength of its construction methodology, which prioritises the durability of verified track records over scale, popularity, or short-term risk statistics. By design, the index favours process integrity, persistence, and robustness, allowing it to endure extended drawdown phases while remaining positioned to benefit when sustained directional trends re-emerge. January's result demonstrates precisely this dynamic in action, as the surge in the TTU Trend Barometer to 68 confirmed that the broadening trend environment is now rewarding the patient positioning that characterised much of 2025.
The TTU TF Index continues to exhibit strong alignment with institutional benchmarks, maintaining a correlation of 0.95 with the SG Trend Index and 0.93 with the BTOP50 Index. Yet despite these close relationships, it has consistently delivered superior long-term risk-adjusted performance. This outcome highlights the advantage of focusing on managers with proven longevity and disciplined execution rather than those whose inclusion is driven primarily by assets under management or prevailing market appeal.
The expansion to 47 programs further reinforces the diversification advantage that underpins the index's construction. With four additional programs now meeting the 15-year track record threshold, the composite captures an even wider cross-section of systematic trend-following behaviour. This deeper diversification enhances the index's ability to smooth idiosyncratic variation while preserving the central tendency of long-term trend-following performance.
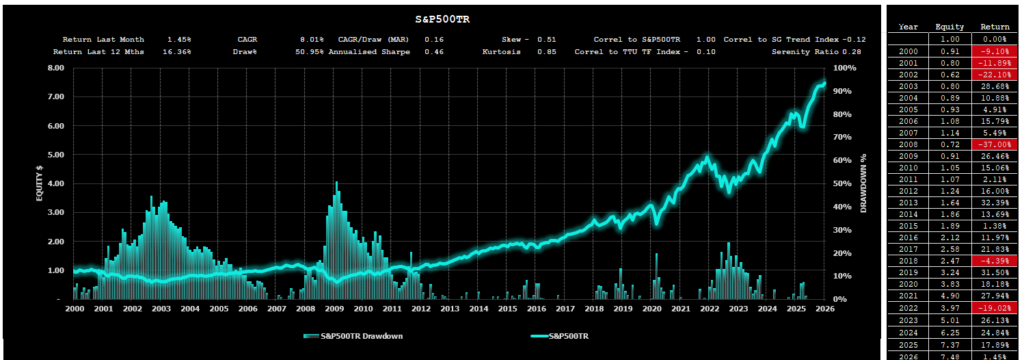
For comparison, the S&P 500 Total Return Index rose 1.45 percent in January and now stands at 16.36 percent over the trailing twelve months. Since 2000, the S&P 500 TR has produced a CAGR of 8.01 percent, but with a substantially larger maximum drawdown of 50.95 percent. This contrast continues to reinforce the role of trend following as a structural diversifier, particularly during periods when equity markets deliver strong headline returns alongside elevated valuation risk and asymmetric downside exposure. Notably, in months like January, where both asset classes advanced, the low correlation of -0.10 between the TTU TF Index and the S&P 500 TR confirms that the sources of return remain fundamentally different, preserving the diversification benefit even when both happen to perform well simultaneously.
TTU Trend Barometer
The TTU Trend Barometer closed January at 68, surging from December's reading of 36 and marking the most significant monthly shift in the Barometer in some time. The move carried the reading decisively into favourable territory, crossing the 55 threshold that historically signals an environment where trend-following programs should see good performance. After spending much of 2025 oscillating between unfavourable and neutral conditions, the Barometer's leap to 68 represents the clearest signal yet that a meaningful change in the trend landscape may be underway.
The Barometer, which measures the persistence of price trends across 44 global futures markets, reflected a broad-based strengthening of directional coherence across sectors. Unlike December, where strong index-level returns were driven by payoffs from established positions amid a narrowing opportunity set, January's gains were accompanied by expanding trend breadth. New directional moves emerged alongside the continuation of existing trends, providing the kind of alignment between returns and underlying conditions that was notably absent throughout much of the prior year.
The magnitude of the shift, nearly doubling from 36 to 68 in a single month, is itself significant. Moves of this scale typically reflect a coordinated repricing across multiple asset classes rather than isolated strength in a handful of markets. For systematic programs that rely on directional persistence to build and maintain positions, this broadening provides both validation of current exposures and fresh opportunities for new entries.
As always, the Barometer reflects end-of-month conditions and does not capture all intra-month volatility. Even so, January's reading is the most encouraging signal for trend followers in recent memory. A Barometer at 68 does not guarantee sustained performance, but it does indicate that the underlying market environment has shifted in favour of the strategies that these programs are designed to exploit. Whether this marks the beginning of a durable favourable regime or a temporary expansion in trend breadth will become clearer in the months ahead, but for now the direction of travel is distinctly positive.
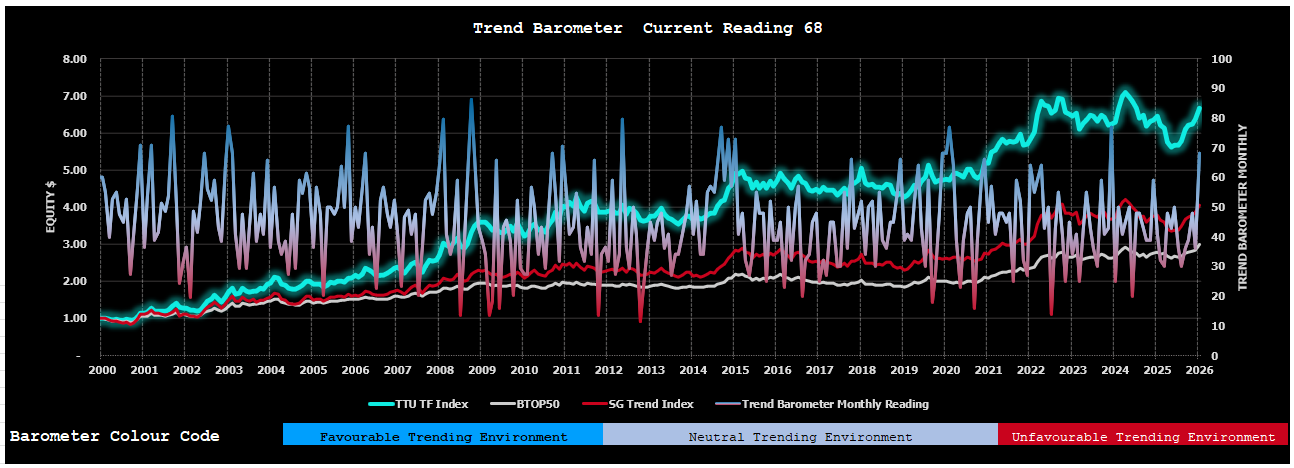
The Trend Barometer is a proprietary tool we use at TTU to assess the trend strength of a diversified portfolio consisting of 44 markets across all sectors. We firstly subdivide the trend strength of each market of a hypothetical diverse portfolio into five ranges from strong up, medium up, neutral, medium down and strong down. We then aggregate these results into a single portfolio number which we use to describe the overall trend strength across a hypothetical Program portfolio.
We then arbitrarily divide this percentage range into 3 where a value of 0-30 is considered a very unfavourable market regime for trend following Programs, a range between 30 to 55 is a somewhat neutral environment for Trend Following Programs (but not an environment where you could expect consistent performance) and values more than 55 are considered to be a favourable regime towards Trend Following Programs, where they should see good performance.
Aside from the occasional dispersed readings when compared to overall trend following performance, this method is surprisingly powerful in describing CTA monthly performance and can be used to connect market trading environments to resultant Manager performance.
The Macro Environment
For a blow-by-blow macro wrap for the month, we recommend you listen to our weekly systematic investor series by clicking on the links below. It is also worthwhile listening to our past catalogue, as it provides you with an understanding of how these markets can shape the emotions of a trader and why it is therefore essential that trend followers adopt systematic rules-based processes to keep these emotions in check.
You can find all of our weekly conversations by clicking this link.
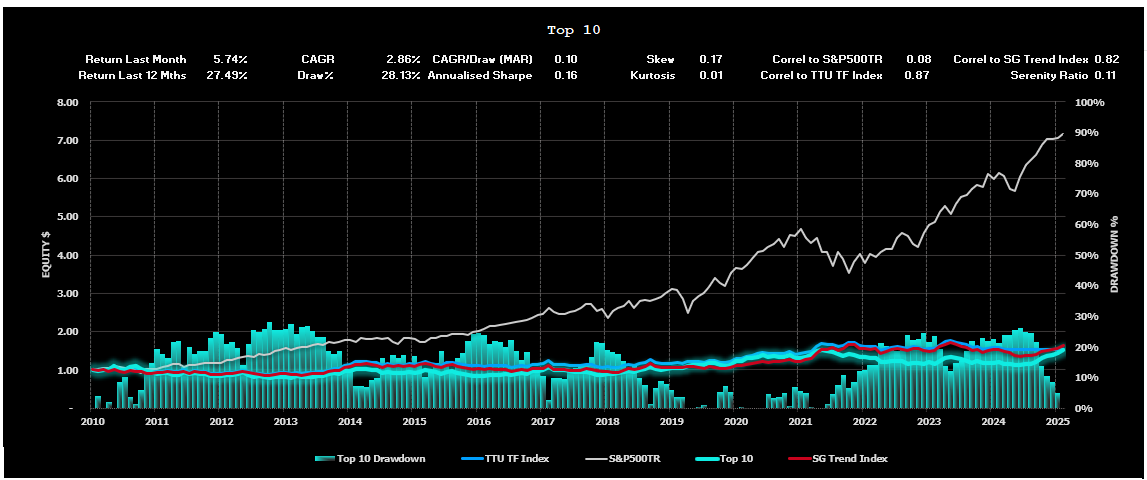
Top 10 Lists
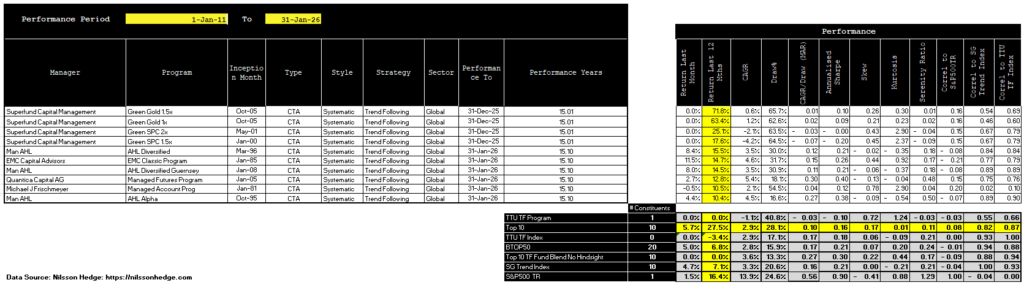
We have prepared the following Top 10 lists (excluding non-reporting programs) for various performance categories based on monthly performance returns for a 15-year period, commencing January 1, 2010, to the current month.
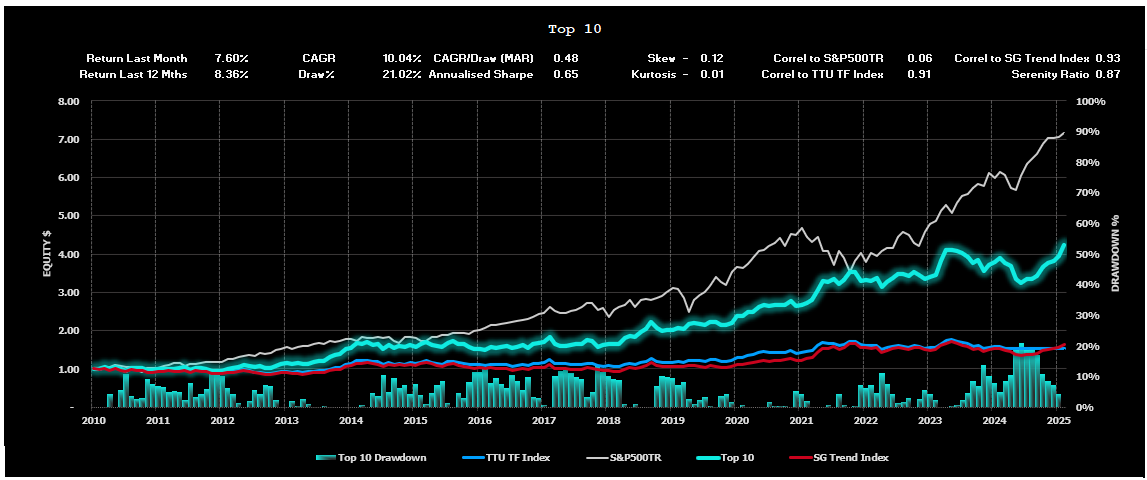
Top 10 Listing – by Compound Annual Growth Rate

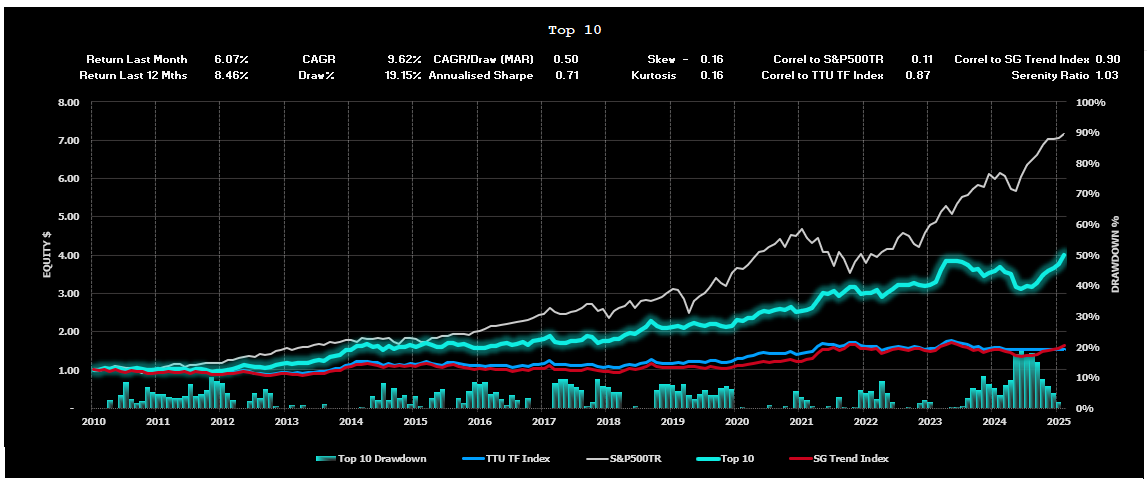
Top 10 Listing – by Risk Adjusted Return (Serenity Ratio)
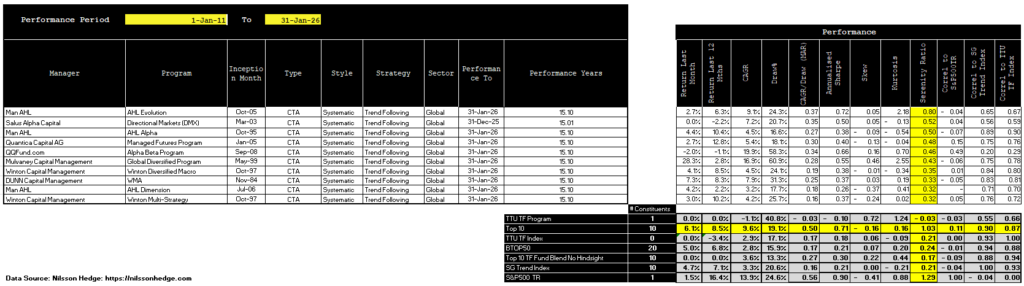
Top 10 Listing – by Last 12 months Performance
Performance Results for the TTU Top 5 by Serenity Ratio
In a research project we undertook at TTU, we examined three different allocation methods that could be deployed by an investor seeking to optimally allocate investment funds towards 5 of the top-ranked Globally Diversified Systematic Trend Following Programs with a long-term track record.
These three methods adopted 3 different forms of performance metric, namely:
- Top 5 performers by Compound Annual Growth Rate (CAGR) using a rolling lookback of 15 years.
- Top 5 performers by MAR ratio (CAGR/Max Draw%) using a rolling lookback of 15 years.
- Top 5 performers by Serenity Ratio using a rolling lookback of 15 years.
The findings of our project can be obtained by clicking on this link.
Our research determined that the optimal selection method was the Serenity Ratio method.
The Serenity Top 5 Selection Method delivered a 7.46 percent gain in January, its strongest monthly result in some time and a powerful start to 2026. The gain brought the trailing twelve-month return to 6.89 percent, nearly doubling from the 3.52 percent recorded at the close of 2025 and marking a decisive acceleration in the composite's recovery trajectory.
January's result demonstrated the Serenity framework's ability to capitalise when trend conditions genuinely broaden. With the TTU Trend Barometer surging to 68, the environment shifted from one of selective participation to one of expanding opportunity, and the Serenity-selected managers were well positioned to benefit. The strength and breadth of the month's gains reinforced the value of prioritising process-driven programs with stable, long-term approaches, as these managers were able to engage across a wider opportunity set as directional coherence strengthened across markets.
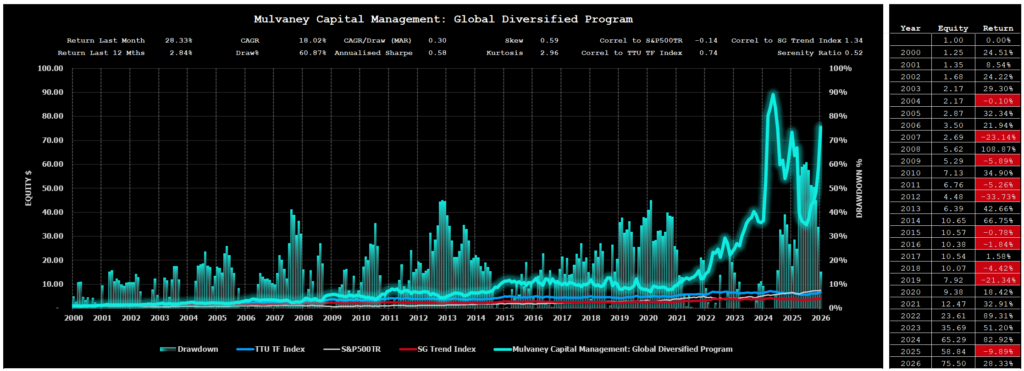
Following the annual reconstitution earlier this year, Mulvaney Capital Management's Global Diversified Program continues to be the primary source of variability within the portfolio. Its high-convexity profile once again amplified portfolio outcomes, contributing meaningfully during January as directional moves strengthened across multiple asset classes. In an environment where the Barometer moved decisively into favourable territory, Mulvaney's tendency to benefit from expanding trend persistence was on full display. This behaviour remains a defining feature of the Serenity composite, introducing controlled variability while preserving long-term asymmetry.
The Serenity Ratio continues to prove effective as a manager selection tool by prioritising durability, drawdown control, and long-term persistence over short-term performance metrics. Across the full reporting horizon, the Serenity composite has delivered a CAGR of 5.47 percent with a maximum drawdown of 26.82 percent, while maintaining a low correlation of -0.04 to the S&P 500 Total Return Index. These characteristics reinforce its role as a structural diversifier within multi-asset portfolios, particularly during periods when traditional asset class behaviour becomes uneven or unstable. January's strong result, achieved alongside positive equity returns, further illustrates that the sources of return within the Serenity composite remain fundamentally distinct from those driving traditional markets.

The 2025 Serenity selection is as follows and will be maintained for the investment period between 1st February 2025 to 31st January 2026:
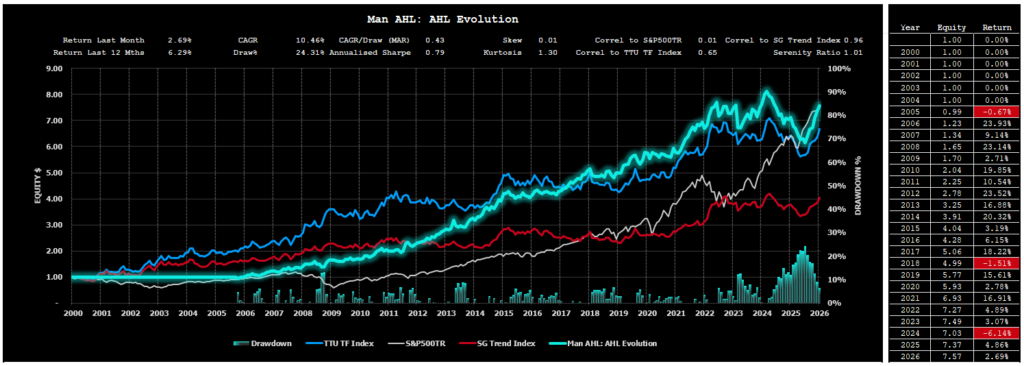
- Man AHL: AHL Evolution;
- Man AHL: AHL Alpha;
- Mulvaney Capital Management: Global Diversified Program;
- Man AHL: AHL Dimension; and
- Quantica Capital AG: Managed Futures Program.
Individual Performance Results for the 5 Programs used for the Serenity allocation to the reporting month using the 2025 listing are as follows:


Performance Results for the Alternative 60/40 portfolio using the TTU Top 5 by Serenity Ratio
In our “How to Invest with the Best”blog post, we also highlighted the significant improved risk-adjusted performance results that could be achieved by replacing the 40% allocation to Bonds in the traditional 60/40 portfolio with an allocation of 40% towards the TTU Top 5 by Serenity ratio.
The evaluation compared the performance of a traditional 60% Equity/40% Bond portfolio against a 60% Equity/40% Serenity portfolio to highlight the uncorrelated historical nature of this Alternative 60/40 portfolio and demonstrate the benefits that a sizeable allocation towards the Serenity portfolio would bring to an investor if equity and bond markets go back to their historic relationship and become more positively correlated in the future. There is no guarantee that correlations remain static over time and it is possible that bond markets and equity markets may lose their uncorrelated relationship that has existed in the last 20 years or so. It is far less likely that the TF managers within the Serenity Grouping will ever be strongly positively correlated to the Equities market, over the long run, given the extensive global diversification and ability to go long and short, that is present within the constituents of the Serenity Grouping.
Chart 15 below showcases the comparative performance results for the period 1 January 2000 to the end of last month:
- A 100% investment in the S&P500TR portfolio;
- A 100% investment in the VBMFX which is a proxy for the bond market;
- A 100% investment in the VBIAX which is a suitable proxy for the classic 60% Equity/40% Bond portfolio;
- A 100% investment in a 60% S&P500TR 40% Serenity portfolio; and
- A 100% investment in the Serenity Portfolio.
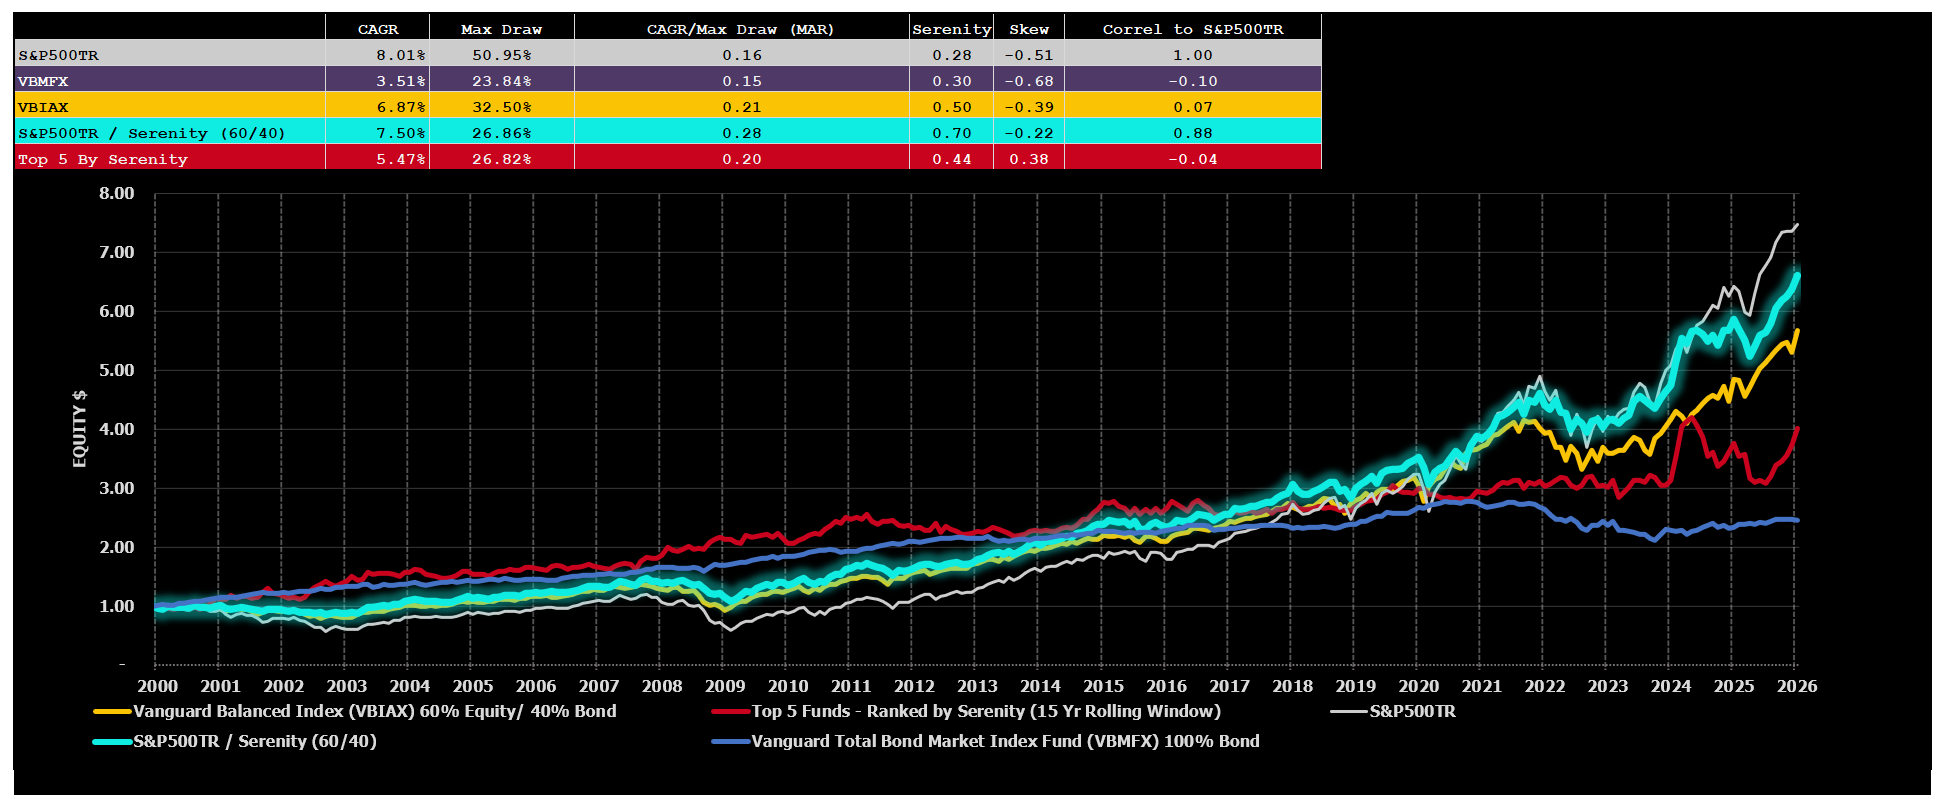
The comparison of alternative portfolio allocations above highlights the strong historic risk adjusted returns that have been enjoyed by 60% S&P500TR / 40% Serenity Composite Portfolio.
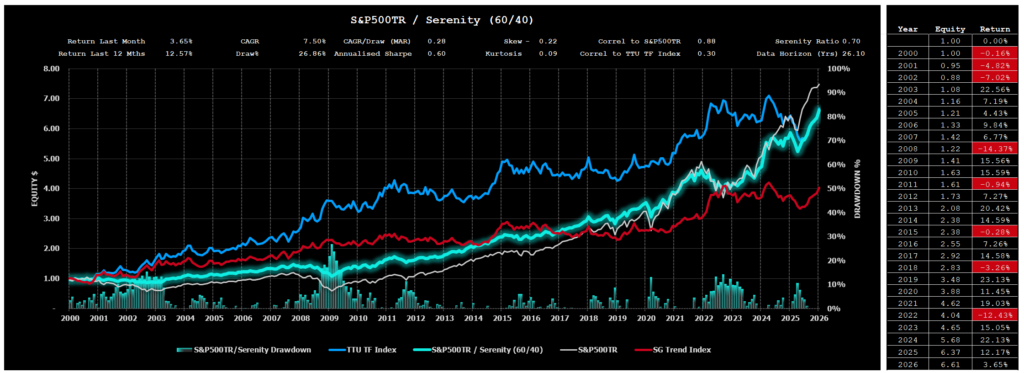
A more detailed assessment of this powerful 60/40 investment option is reflected below.
Important Disclaimers
This document is directly solely to Accredited Investors, Qualified Eligible Participants, Qualified Clients and Qualified Purchasers. No investment decision should be made until prospective investors have read the detailed information in the fund offering documents of any manager mentioned in this document. This document is furnished on a confidential basis only for the use of the recipient and only for discussion purposes and is subject to amendment This document is neither advice nor a recommendation to enter into any transaction. This document is not an offer to buy or sell, nor a solicitation of an offer to buy or sell, any security or other financial instrument. This presentation is based on information obtained from sources that TopTradersUnplugged (“TTU”) (“considers to be reliable however, TTU makes no representation as to, and accepts no responsibility or liability for, the accuracy or completeness of the information. TTU has not independently verified third party manager or benchmark information, does not represent it as accurate, true or complete, makes no warranty, express or implied regarding it and shall not be liable for any losses, damages, costs or expenses relating to its adequacy, accuracy, truth, completeness or use.
All projections, valuations, and statistical analyses are provided to assist the recipient in the evaluation of the matters described herein. Such projections, valuations and analyses may be based on subjective assessments and assumptions and may use one among many alternative methodologies that produce different results accordingly, such projections, valuations and statistical analyses should not be viewed as facts and should not be relied upon as an accurate prediction of future events. There is no guarantee that any targeted performance will be achieved Commodity trading involves substantial risk of loss and may not be suitable for everyone
TTU is not and does not purport to be an advisor as to legal, taxation, accounting, financial or regulatory matters in any jurisdiction. The recipient should independently evaluate and judge the matters referred to herein. TTU does not provide advice or recommendations regarding an investor’s decision to allocate to funds or accounts managed by any manager (“or to maintain or sell investments in funds or accounts managed by any manager, and no fiduciary relationship under ERISA is created by the investor investing in funds or accounts managed by any manager, or through any communication between TTU and the investor
In reviewing this document, it should be understood that the past performance results of any asset class, or any investment or trading program set forth herein, are not necessarily indicative of any future results that may be achieved in connection with any transaction. Any persons subscribing for an investment must be able to bear the risks involved and must meet the suitability requirements relating to such investment. Some or all alternative investment programs discussed herein may not be suitable for certain investors This document is directed only to persons having professional experience in matters relating to investments. Any investment or investment activity to which this document relates is available only to such investment professionals. Persons who do not have professional experience in matters relating to investments should not rely upon this document.
This document and its contents are proprietary information of TTU and may not be reproduced or otherwise disseminated in whole or in part without TTU’s prior written consent.
This document contains simulated or hypothetical performance results that have certain inherent limitations AND SHOULD BE VIEWED FOR ILLUSTRATIVE PURPOSES. Unlike the results shown in an actual performance record, these results do not represent actual trading. HYPOTHETICAL PERFORMANCE RESULTS HAVE MANY INHERENT LIMITATIONS, SOME OF WHICH ARE DESCRIBED BELOW. NO REPRESENTATION IS BEING MADE THAT ANY ACCOUNT WILL OR IS LIKELY TO ACHIEVE PROFITS OR LOSSES SIMILAR TO THOSE SHOWN IN FACT, THERE ARE FREQUENTLY SHARP DIFFERENCES BETWEEN HYPOTHETICAL PERFORMANCE RESULTS AND THE ACTUAL RESULTS SUBSEQUENTLY ACHIEVED BY ANY PARTICULAR INVESTMENT ACCOUNT.
ONE OF THE LIMITATIONS OF HYPOTHETICAL PERFORMANCE RESULTS IS THAT THEY ARE GENERALLY PREPARED WITH THE BENEFIT OF HINDSIGHT IN ADDITION, HYPOTHETICAL TRADING DOES NOT INVOLVE FINANCIAL RISK, AND NO HYPOTHETICAL TRADING RECORD CAN COMPLETELY ACCOUNT FOR THE IMPACT OF FINANCIAL RISK IN ACTUAL TRADING FOR EXAMPLE, THE ABILITY TO WITHSTAND LOSSES OR TO ADHERE TO A PARTICULAR TRADING PROGRAM OR OTHER ASSET.
There are numerous other factors related to the markets in general or to the implementation of any specific trading program which cannot be fully accounted for in the preparation of hypothetical performance results and all of which can adversely affect actual trading results. No representation is being made that any investment will or is likely to achieve profits or losses similar to those being shown.
Most Comprehensive Guide to the Best Investment Books of All Time

Most Comprehensive Guide to the Best Investment Books of All Time
Get the most comprehensive guide to over 600 of the BEST investment books, with insights, and learn from some of the wisest and most accomplished investors in the world. A collection of MUST READ books carefully selected for you. Get it now absolutely FREE!
Get Your FREE Guide HERE!