Sell in May…and follow the Trend…
A perfect set-up for the month of May…stocks at their most recent highs, moderate growth, a dovish FED, volatility back to its lows and confidence in the tariff war ending soon…was quickly crushed by new tweets and rhetoric that caught the bulls on the wrong foot.
The month of May left equity investors bruised while bond investors enjoyed and unforgiving rally during another flight to “safety” environment and reminded us all of the old saying “Sell in May…and go away”.
But it was not only in the equity and bond markets that investors saw big moves and changes in trend.
Energy traders were left with a vicious reversal in the Energy Complex that continued to intensify into month-end, leaving Crude Oil down 16.5% for the month and other products also recording double digit percentage drops.
And for those managers who trade the Grain complex, a big turnaround mid-month due to record planting delays for corn and soybeans, with wet conditions also denting winter wheat conditions put a sudden end to the down-trends of 2019.
Global Marco is back with a vengeance…which could lead to big trends ahead.
Market moves this month:

Trend Barometer statistic this month

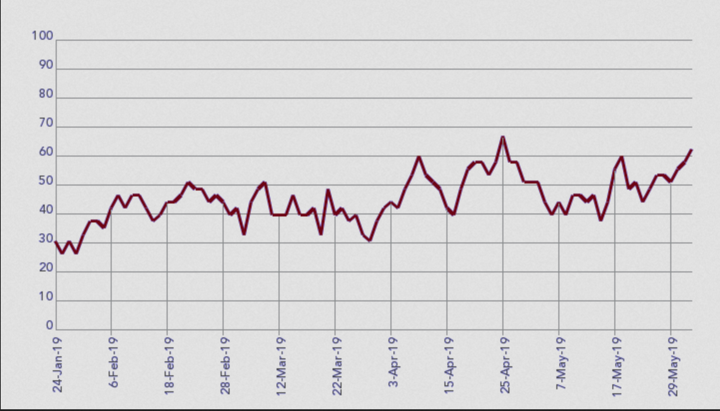
The Trend Barometer finished a month at a bullish level of 64, which normally would suggest a positive month for most CTAs and Trend Followers in particular. But that is not what early indications are suggesting.
The reason for this, is that a lot of the trends recorded at month-end by the Trend Barometer, are in those markets mentioned above that saw big reversals during the month. It usually takes medium and long-term trend followers a few weeks to adjust positions, in particular if the reversals take place in markets that have been in a trend for some time, like Energy and Grains.
BUT not all trend followers lost money in May and the return dispersion like we witnessed last month, reminds us that not trend followers are the same.
The next chart below shows a snapshot of a 44-market portfolio with markets listed in “groups” of market sectors:
The number of markets recorded in a trending state at the end of the month was 21…up from 17 , but once we include those ending right at the neutral reading (indicated by the “grey” shade right at the 30% level) we get up to 28, which puts the Trend Barometer in “positive” territory. Please note that for the individual markets a reading of 30 is considered neutral as opposed to the Trend Barometer itself, where this level is 45.
In the RED camp (down trends) this months, we find a few stock markets and part of the energy complex, base metals and select other Commodities with Live Cattle recording the strongest down-trend…whilst short- and long-term bonds, were carrying the GREEN flag (up trends) joined by Australian stocks and Corn at the end of the month.

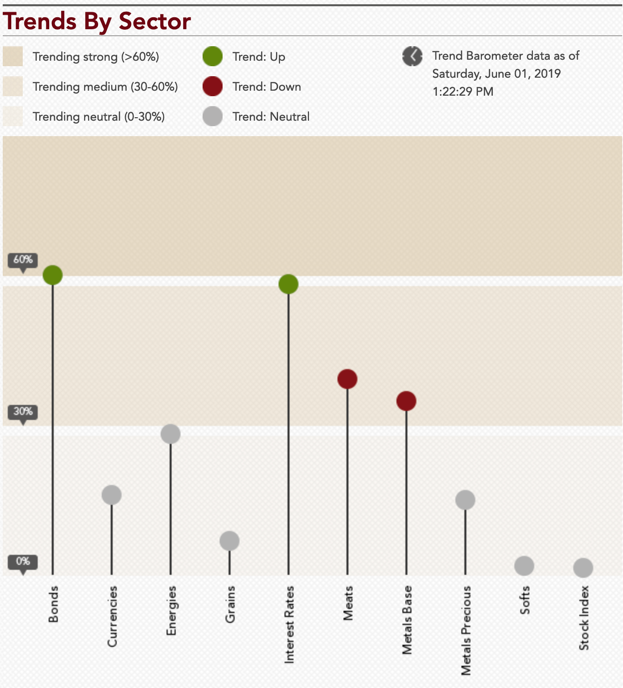
In the chart below, I have grouped the markets into 10 sectors. Since last month, the number of sectors exhibiting an overall trending state doubled from 2 to 4 out of 10 sectors… , with one ending at a neutral level. It's been a while since we have seen almost half the sectors ending in or at a trending state…so perhaps more strong moves are to come.
Not surprising it was short-term and long-term Bonds (up trending) and Meats and Base Metals (down trending) that were the sectors showing consistent trends at the end of the month, in line with the individual market trends. The Energy sector finished at a neutral level which makes sense as it reversed during the month.

From the lows in January to close to the highs of the year at the end of May, the Trend Barometer has shown less choppiness or noise so far this year, which confirms the solid gains so far for most of the industry.
Let me finish by quoting from a recent article I saw in Institutional Investor;
The results showed that the before-fee performance of managed futures offered the best protection of a range of alternatives. “Managed futures offered more diversification bang for the buck than we were able to identify from any other area,” he said. “Managed futures had outperformed stocks and bonds, had no correlation to either one over the past 18 years, and tended to do best when equity markets do the worst.”
And if you want to check in on the state of trend following, join me each weekend on The Systematic Investor Series, where we give you a raw and honest account of what it's like to be a rules based investor and share with you which trends are happening right now.

PAST PERFORMANCE IS NOT INDICATIVE OF FUTURE RESULTS
I hope you found the information useful as part of your own evaluation of the trend following part of your investment portfolio. I will continue to do my best to keep you up-to-date with regards to the environment for diversified trend following strategies and would love to discuss any of this information with you. Just reach out to me.
P.S. if you want to follow the Trend Barometer on a daily basis, please click here and if you want to see the list of Market Symbols explanations, please click here.


