

“Glimmers of Strength, Fragile Breadth”
This Week in Trend – 05 September 2025
Welcome back to This Week in Trend, your weekly pulse check on global futures and the state of systematic trend following.
The TTU Trend Barometer held flat at 30 percent, unchanged from last week, leaving conditions firmly in very weak territory. Glimmers of strength appeared in metals, crypto, and bonds, while soft commodities, grains, and energy continued to drag. Breadth remains fragile—progress comes in sparks, not in waves.
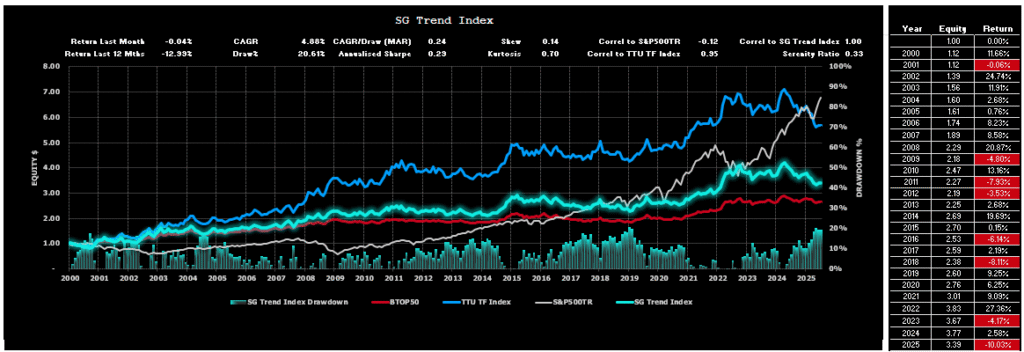
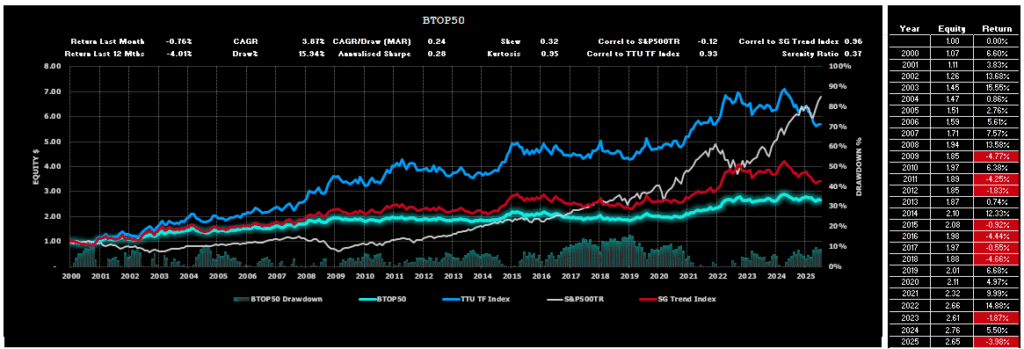
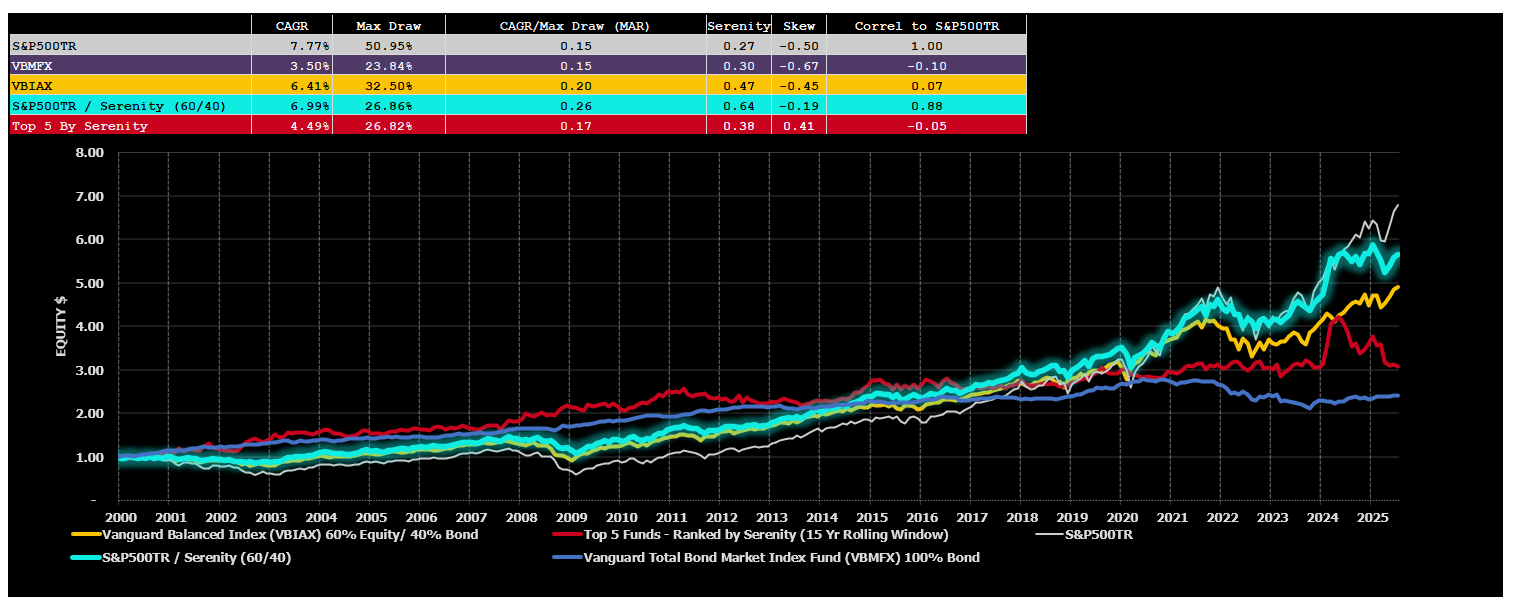
SG Trend Index Performance
- Month-to-date (as of Sep 5): +0.60%
- Year-to-date: -7.00%
(Previous week: +2.89% MTD | -7.43% YTD)
The SG Trend Index began September in positive territory, up +0.60% after August’s strong finish. YTD losses eased slightly from -7.43% to -7.00%, showing tentative signs of repair. Metals and bonds provided early support, while softs and energy continued to weigh on portfolios.
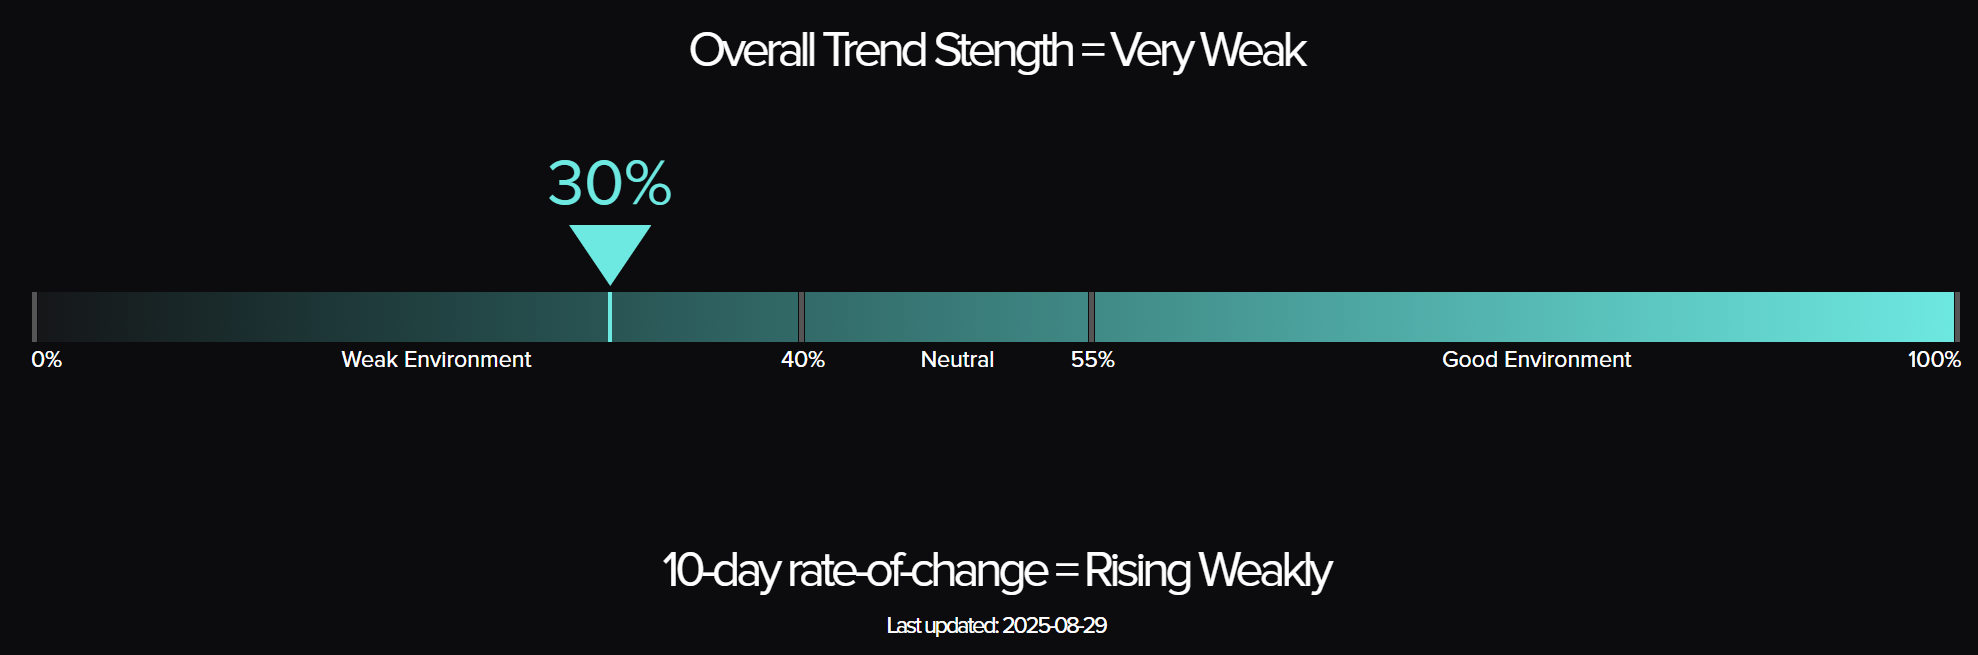
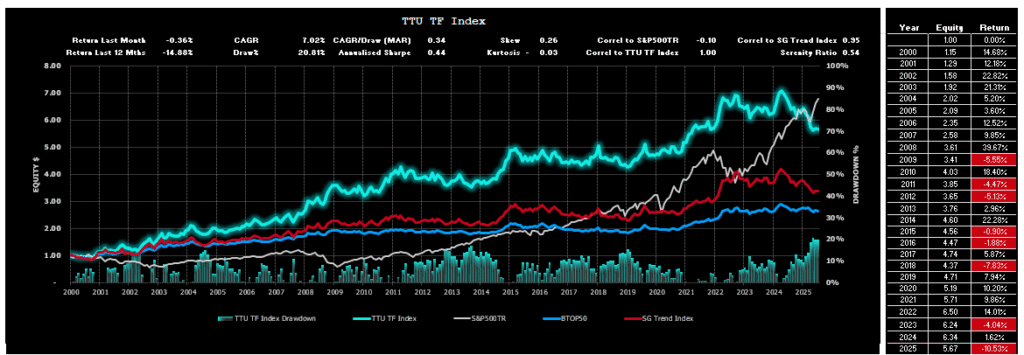
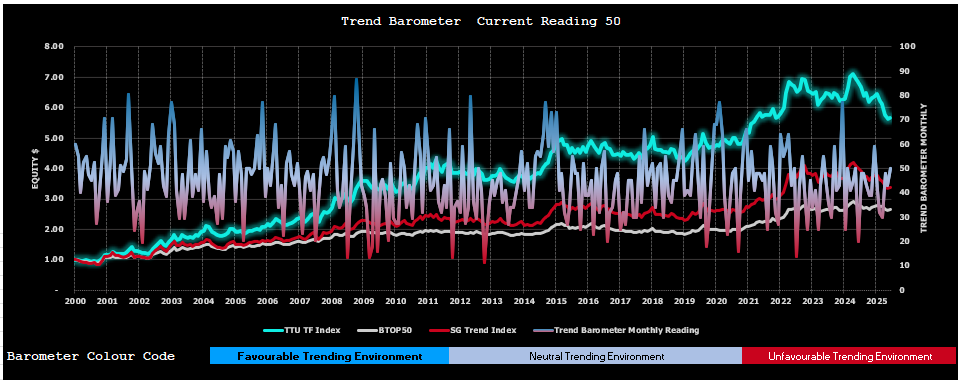
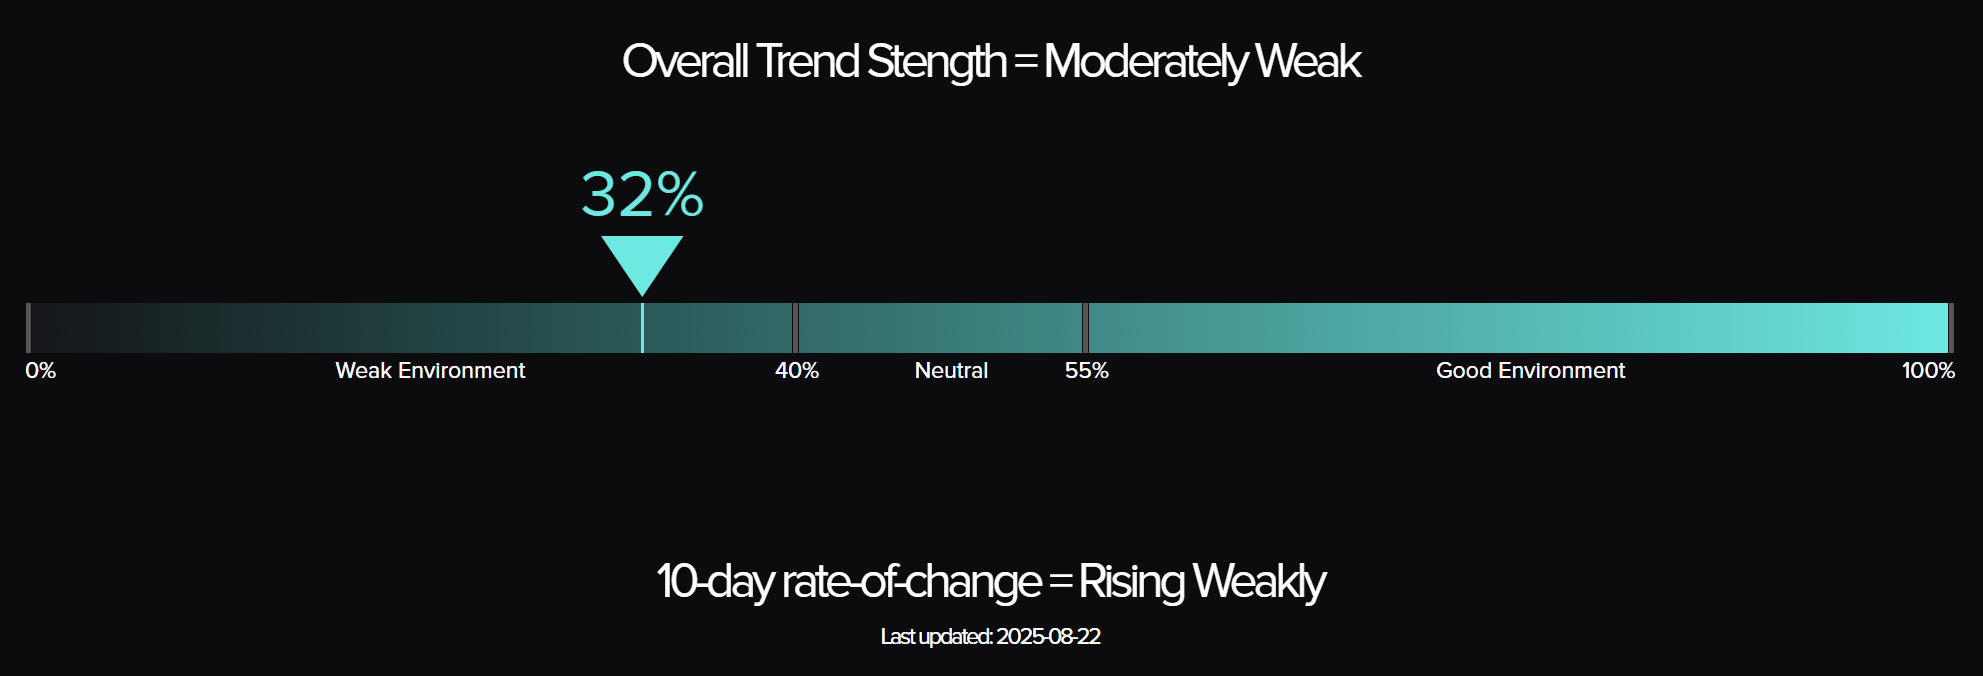
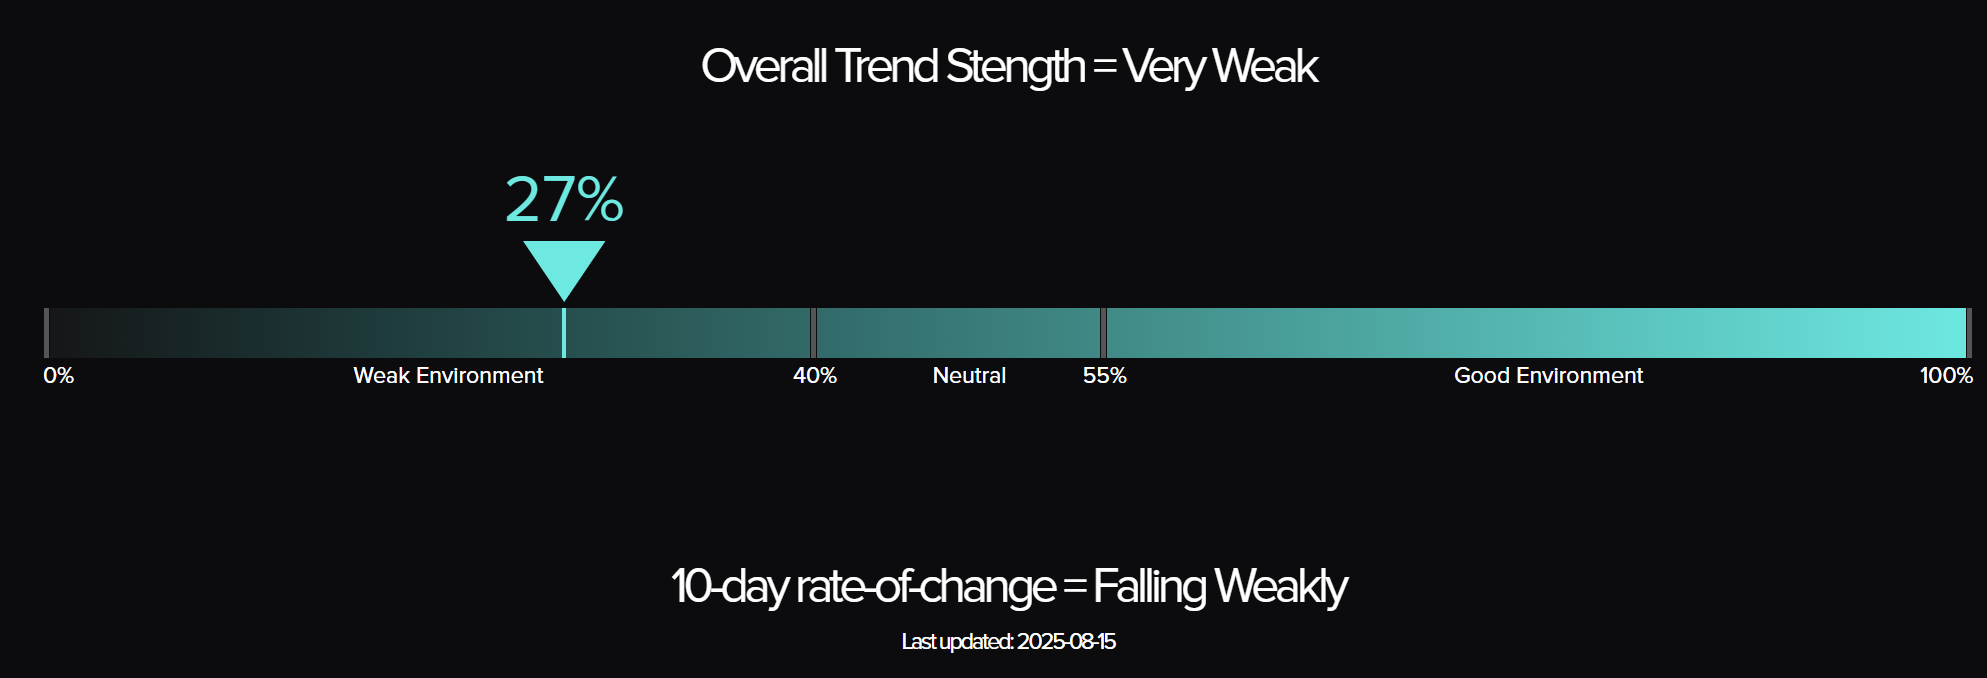
TTU Trend Barometer
- Current reading: 30 percent – Very Weak
- Previous reading: 30 percent
- 10-day rate of change: Rising weakly
Breadth failed to improve, stuck at 30 percent, with fewer than a third of markets showing trend strength.
“At thirty, the floor remains fragile – glimmers appear, but breadth refuses to improve.”
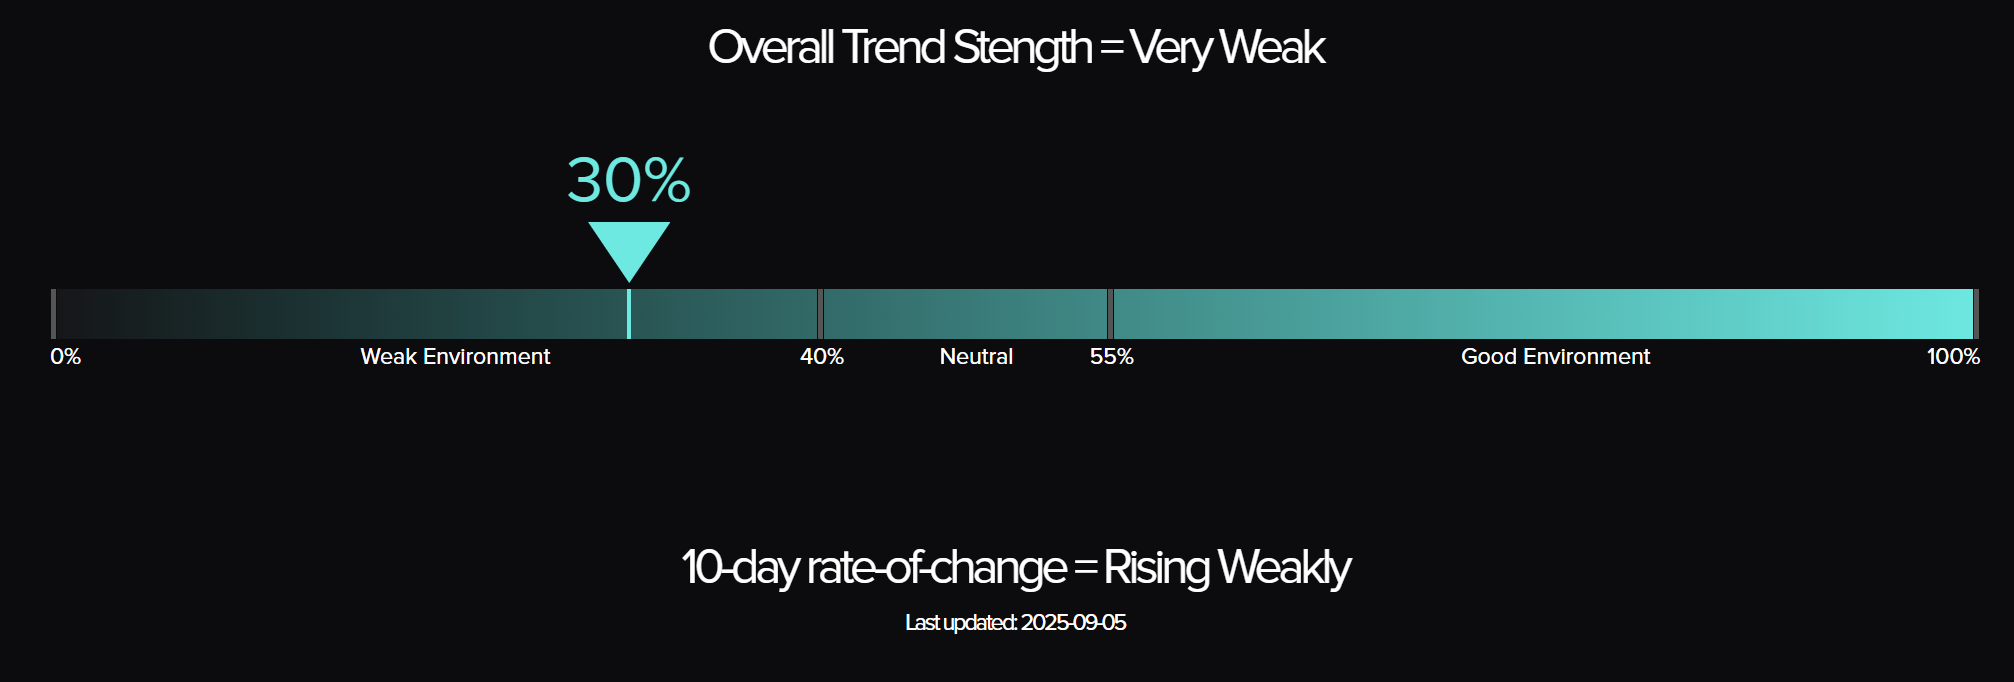
The Top Traders Unplugged (TTU) Trend Barometer is a proprietary tool that measures the percentage of markets with medium to strong trends. Similar to a thermometer, where 0 degrees Celsius equates to freezing, a TTU Trend Barometer reading below 40% indicates a “cold” environment for trend-following, while readings above 55% signal a “hotter,” more favourable trend environment.
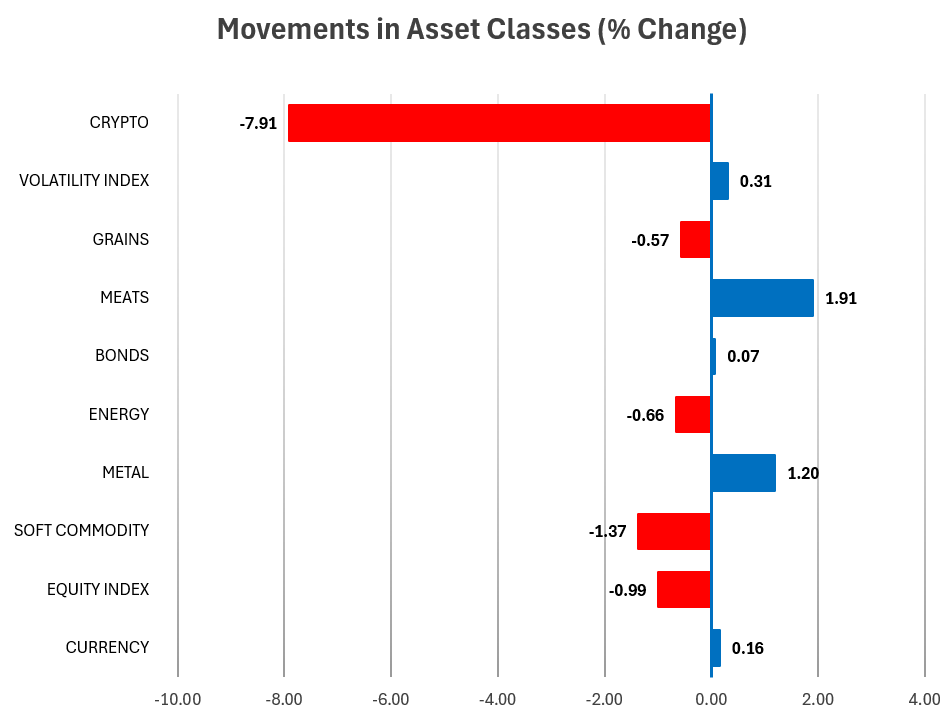
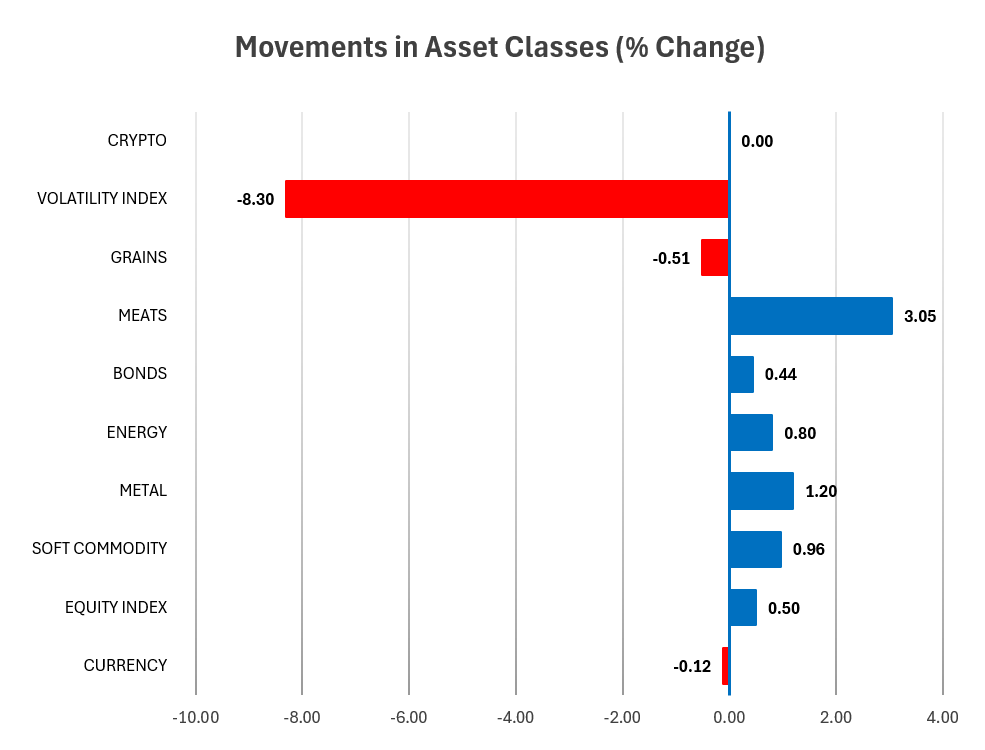
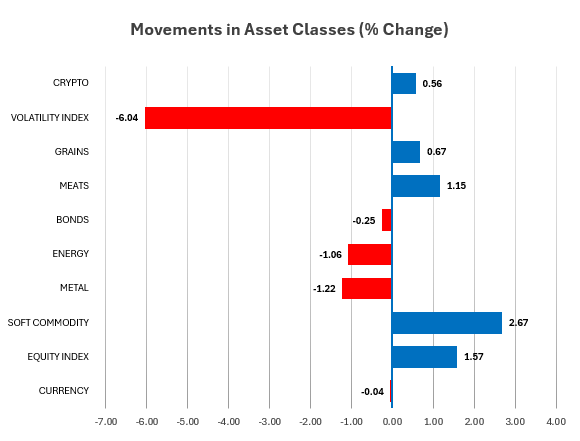
Weekly Asset Class Snapshot
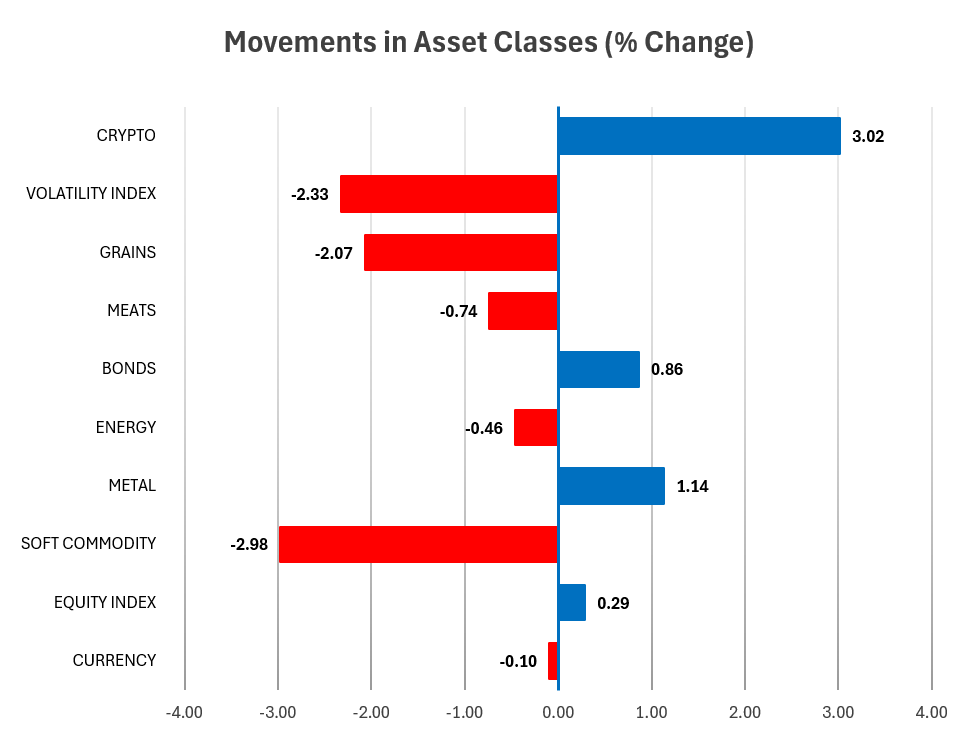
Source: Finwiz.com
Asset Class Breakdown – Uneven Glimmers
- Crypto: +3.02% – Bitcoin rebound led the week.
- Metals: +1.14% – Gold and silver extended rallies, copper slipped.
- Bonds: +0.86% – Long bonds surged, providing diversification.
- Equities: +0.29% – Mixed global picture, Nikkei and Russell firmer.
- Currencies: -0.10% – Rangebound majors, no conviction.
- Energy: -0.46% – Crude and products weaker, nat gas steady.
- Meats: -0.74% – Hogs gained, cattle softened.
- Grains: -2.07% – Soybeans, wheat, and canola pressured lower.
- Volatility Index: -2.33% – VIX fell, easing hedging demand.
- Soft Commodities: -2.98% – Sugar, coffee, and cocoa collapsed.
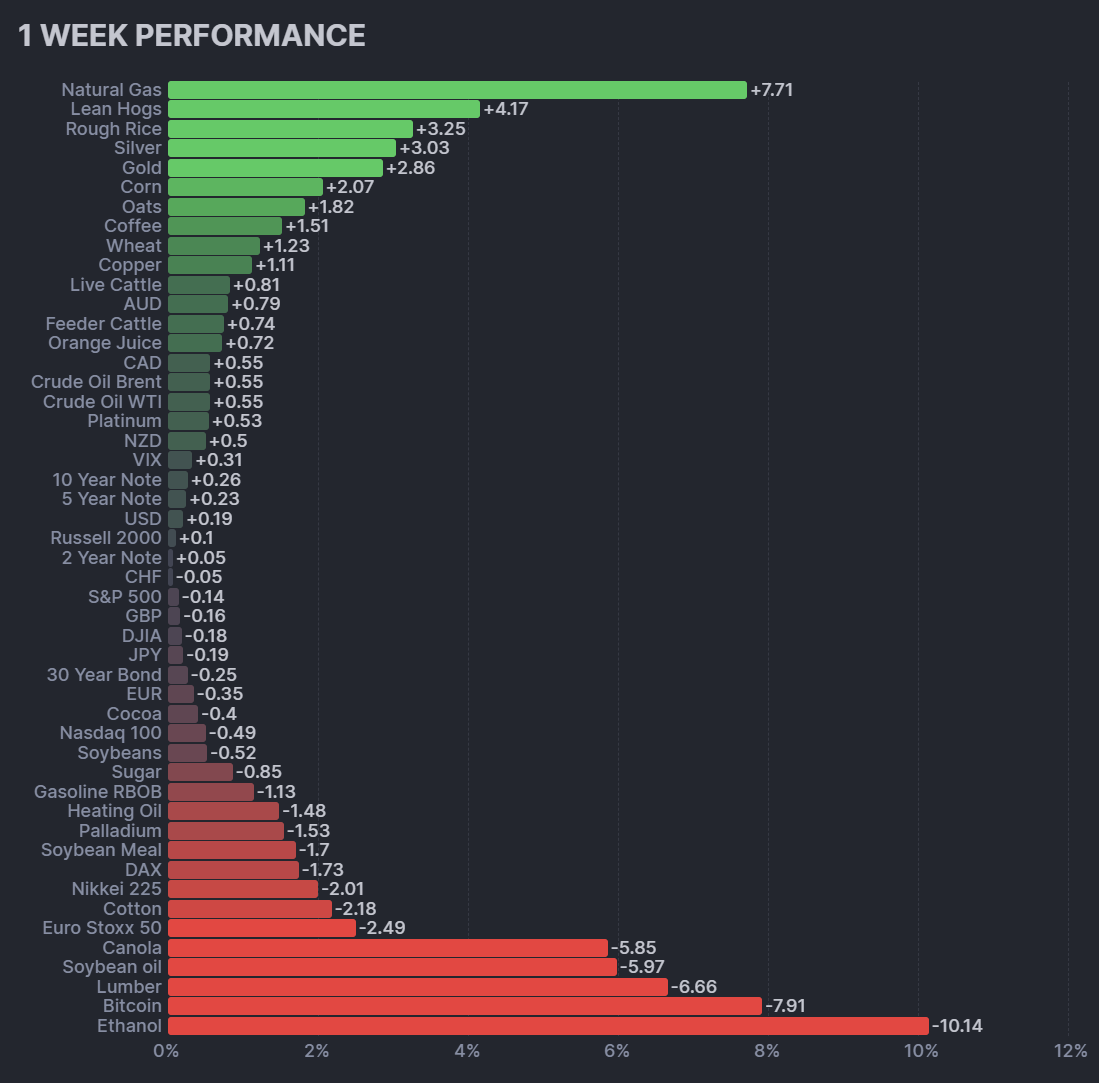
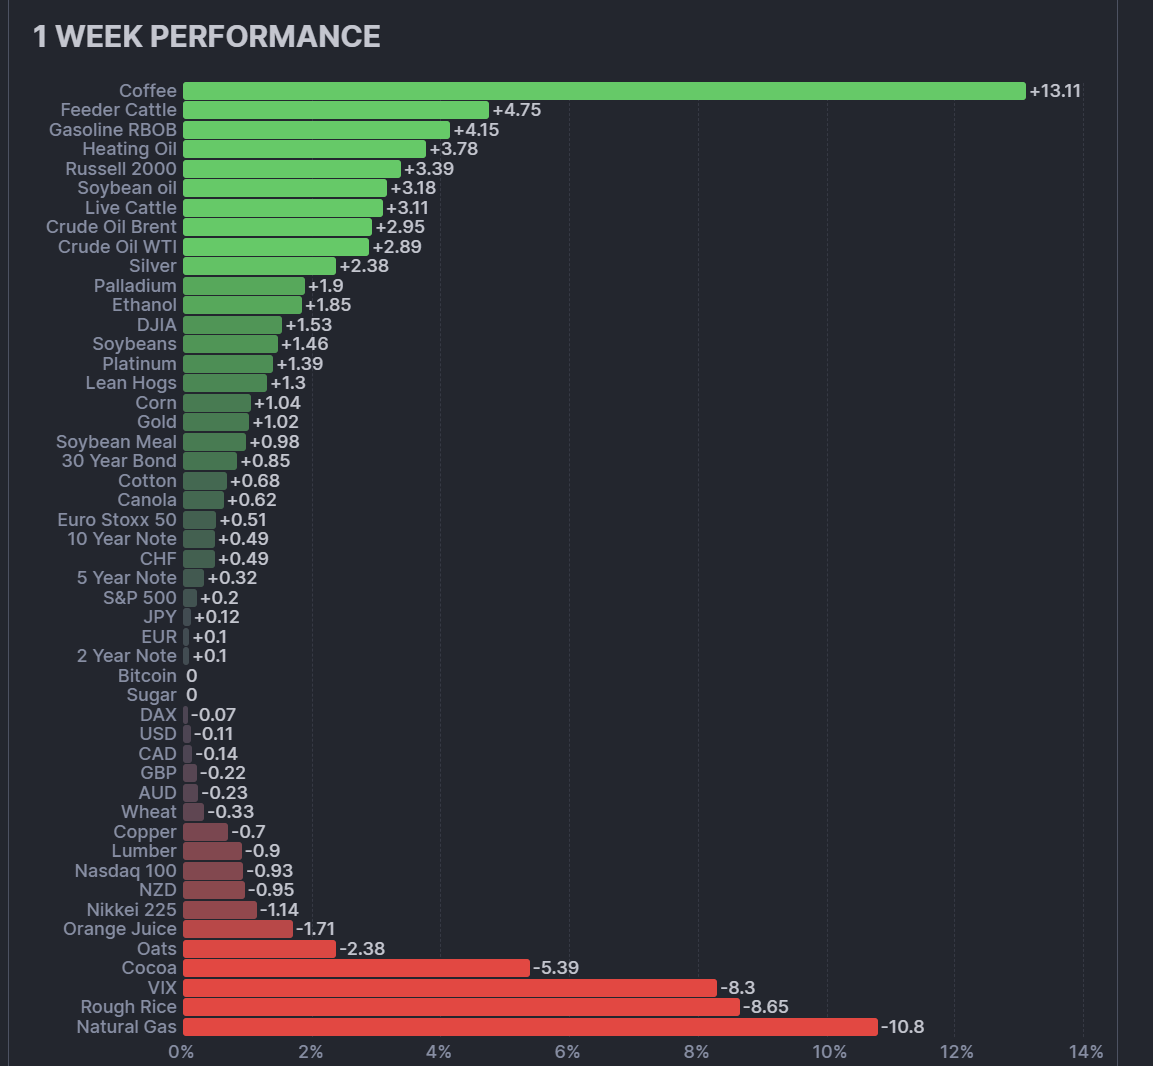
Performance Highlights – This Week’s Market Leaders & Laggards
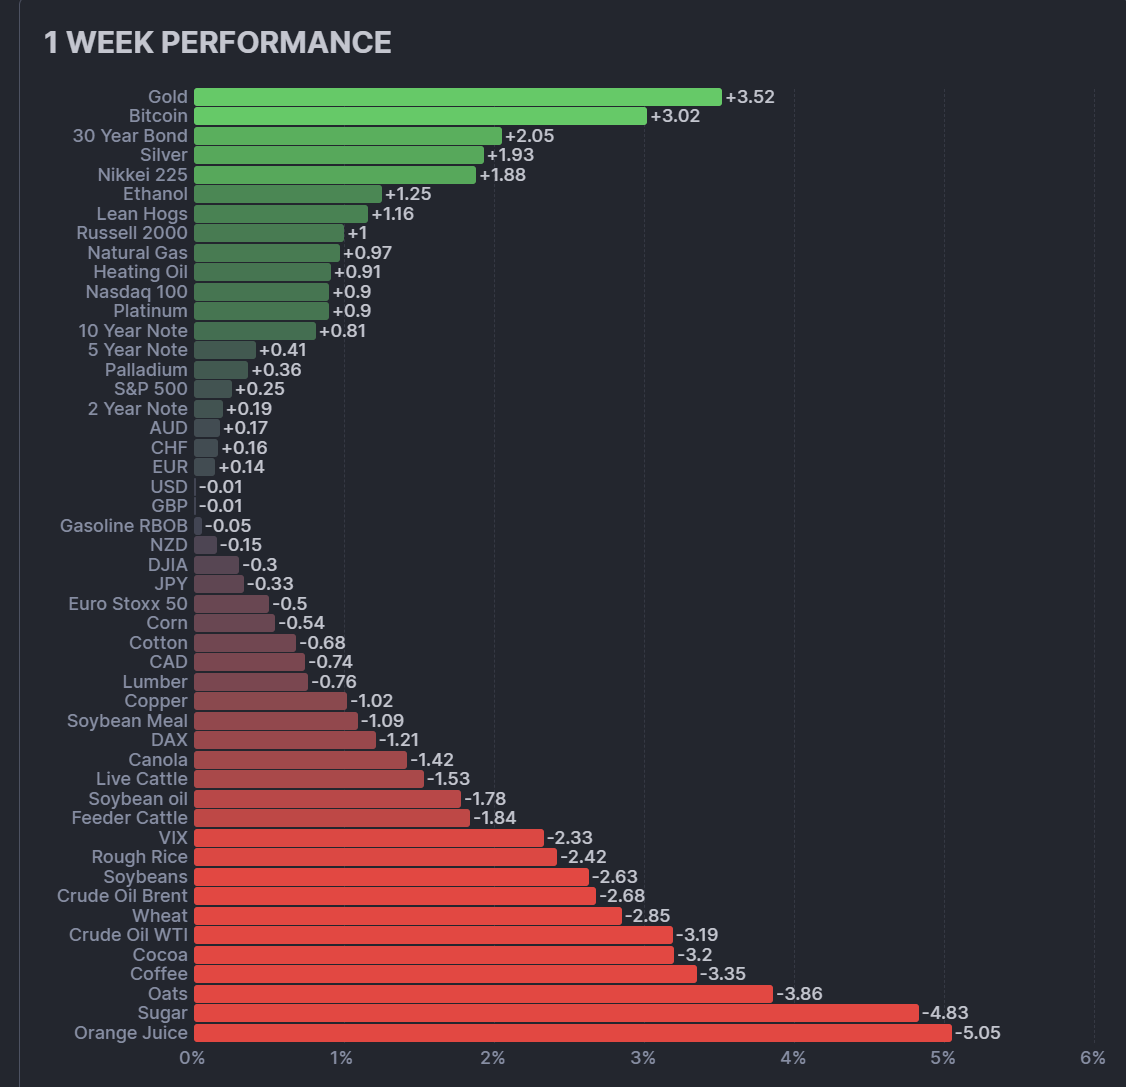
Top Market Movers
Top Gainers
- Gold: +3.52% – Precious metals strength broadened.
- Bitcoin: +3.02% – Crypto bounced strongly.
- 30-Year Bond: +2.05% – Long duration surged.
- Silver: +1.93% – Reinforced metals leadership.
- Nikkei 225: +1.88% – Outperformed global peers.
Top Losers
- Orange Juice: -5.05% – Steep reversal.
- Sugar: -4.83% – Continued collapse in softs.
- Coffee: -3.35% – Declines spread across the complex.
- Cocoa: -3.20% – Sustained downside pressure.
- WTI Crude: -3.19% – Energy weakness persisted.
Portfolio View – Positioning and Impact
- Metals: Gold and silver longs provided strong ballast; copper was softer.
- Crypto: Bitcoin bounce contributed rare positive outlier exposure.
- Bonds: Long duration gains reinforced diversification benefits.
- Equities: Mixed—Nikkei and Russell higher, DAX and Euro Stoxx lagged.
- Energy: Crude and products weakened; nat gas steady.
- Softs: Heavy drag from sugar, coffee, cocoa, and lumber.
- Grains: Soybeans, wheat, and canola extended losses.
- Meats: Hogs supported, cattle weaker.
- Currencies: Flat, little directional conviction.
- Volatility: VIX decline dampened breakout conditions.
Final Reflections – Glimmers of Strength, Fragile Breadth
This week offered hints of improvement: metals, Bitcoin, and bonds provided upside sparks, while equities showed selective resilience. Yet the broader landscape remained fractured, with softs, grains, and energy dragging portfolios back.
The TTU Barometer holding at 30 percent underscores how weak breadth remains. For trend followers, the message is clear: outliers still appear, but they must be captured in a framework designed for fragility. Robust portfolios endure not through broad participation, but by letting rare winners shine against a backdrop of cracks.
List of Resources used in the Week in Review
Important Disclaimers
This document is directly solely to Accredited Investors, Qualified Eligible Participants, Qualified Clients and Qualified Purchasers. No investment decision should be made until prospective investors have read the detailed information in the fund offering documents of any manager mentioned in this document. This document is furnished on a confidential basis only for the use of the recipient and only for discussion purposes and is subject to amendment This document is neither advice nor a recommendation to enter into any transaction. This document is not an offer to buy or sell, nor a solicitation of an offer to buy or sell, any security or other financial instrument. This presentation is based on information obtained from sources that TopTradersUnplugged (“TTU”) (“considers to be reliable however, TTU makes no representation as to, and accepts no responsibility or liability for, the accuracy or completeness of the information. TTU has not independently verified third party manager or benchmark information, does not represent it as accurate, true or complete, makes no warranty, express or implied regarding it and shall not be liable for any losses, damages, costs or expenses relating to its adequacy, accuracy, truth, completeness or use.
All projections, valuations, and statistical analyses are provided to assist the recipient in the evaluation of the matters described herein. Such projections, valuations and analyses may be based on subjective assessments and assumptions and may use one among many alternative methodologies that produce different results accordingly, such projections, valuations and statistical analyses should not be viewed as facts and should not be relied upon as an accurate prediction of future events. There is no guarantee that any targeted performance will be achieved Commodity trading involves substantial risk of loss and may not be suitable for everyone
TTU is not and does not purport to be an advisor as to legal, taxation, accounting, financial or regulatory matters in any jurisdiction. The recipient should independently evaluate and judge the matters referred to herein. TTU does not provide advice or recommendations regarding an investor’s decision to allocate to funds or accounts managed by any manager (“or to maintain or sell investments in funds or accounts managed by any manager, and no fiduciary relationship under ERISA is created by the investor investing in funds or accounts managed by any manager, or through any communication between TTU and the investor
In reviewing this document, it should be understood that the past performance results of any asset class, or any investment or trading program set forth herein, are not necessarily indicative of any future results that may be achieved in connection with any transaction. Any persons subscribing for an investment must be able to bear the risks involved and must meet the suitability requirements relating to such investment. Some or all alternative investment programs discussed herein may not be suitable for certain investors This document is directed only to persons having professional experience in matters relating to investments. Any investment or investment activity to which this document relates is available only to such investment professionals. Persons who do not have professional experience in matters relating to investments should not rely upon this document.
This document and its contents are proprietary information of TTU and may not be reproduced or otherwise disseminated in whole or in part without TTU’s prior written consent.
This document contains simulated or hypothetical performance results that have certain inherent limitations AND SHOULD BE VIEWED FOR ILLUSTRATIVE PURPOSES. Unlike the results shown in an actual performance record, these results do not represent actual trading. HYPOTHETICAL PERFORMANCE RESULTS HAVE MANY INHERENT LIMITATIONS, SOME OF WHICH ARE DESCRIBED BELOW. NO REPRESENTATION IS BEING MADE THAT ANY ACCOUNT WILL OR IS LIKELY TO ACHIEVE PROFITS OR LOSSES SIMILAR TO THOSE SHOWN IN FACT, THERE ARE FREQUENTLY SHARP DIFFERENCES BETWEEN HYPOTHETICAL PERFORMANCE RESULTS AND THE ACTUAL RESULTS SUBSEQUENTLY ACHIEVED BY ANY PARTICULAR INVESTMENT ACCOUNT.
ONE OF THE LIMITATIONS OF HYPOTHETICAL PERFORMANCE RESULTS IS THAT THEY ARE GENERALLY PREPARED WITH THE BENEFIT OF HINDSIGHT IN ADDITION, HYPOTHETICAL TRADING DOES NOT INVOLVE FINANCIAL RISK, AND NO HYPOTHETICAL TRADING RECORD CAN COMPLETELY ACCOUNT FOR THE IMPACT OF FINANCIAL RISK IN ACTUAL TRADING FOR EXAMPLE, THE ABILITY TO WITHSTAND LOSSES OR TO ADHERE TO A PARTICULAR TRADING PROGRAM OR OTHER ASSET.
There are numerous other factors related to the markets in general or to the implementation of any specific trading program which cannot be fully accounted for in the preparation of hypothetical performance results and all of which can adversely affect actual trading results. No representation is being made that any investment will or is likely to achieve profits or losses similar to those being shown.