

“When the fog thins, it’s not clarity—it’s just a shift in the shadows.”
This Week In Trend
Welcome to This Week in Trend, your lens into the evolving rhythms of global futures markets and the adaptive world of trend-following.
After a turbulent May filled with softs reversals and volatility spikes, the final week offered no clear reprieve—just subtler shifts. Energy and metals gave back gains, while equities clawed higher. But beneath the surface, signals remain muted, with few markets offering sustained conviction.
The landscape is still cold. But it's no longer chaotic. Just… indecisive.
“Signals Weaken—But the Shakeout Slows”
After last week’s turbulence, trend systems this week experienced less pain—but little progress.
Energy and metals faded sharply, snapping recent breakouts. Grains and softs continued their drift lower, while equities showed modest strength. Volatility collapsed, dragging the VIX down nearly 9% and capping the week’s most notable move.
Not a rally. Not a crash. Just a cooling—and while trend models remain constrained, they could breathe a little easier.
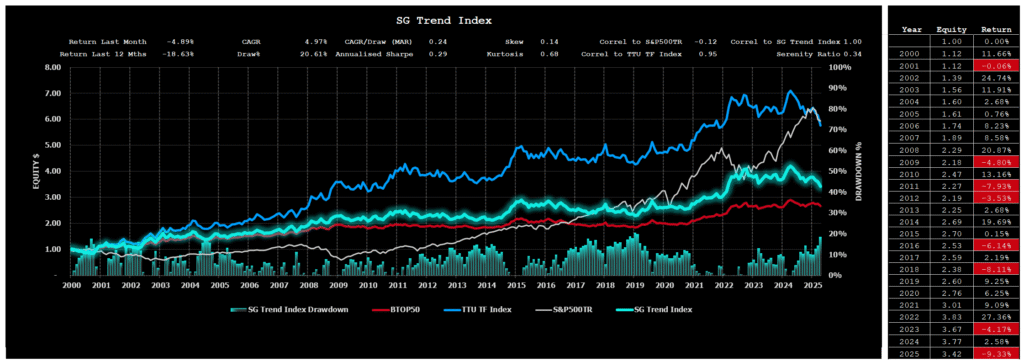
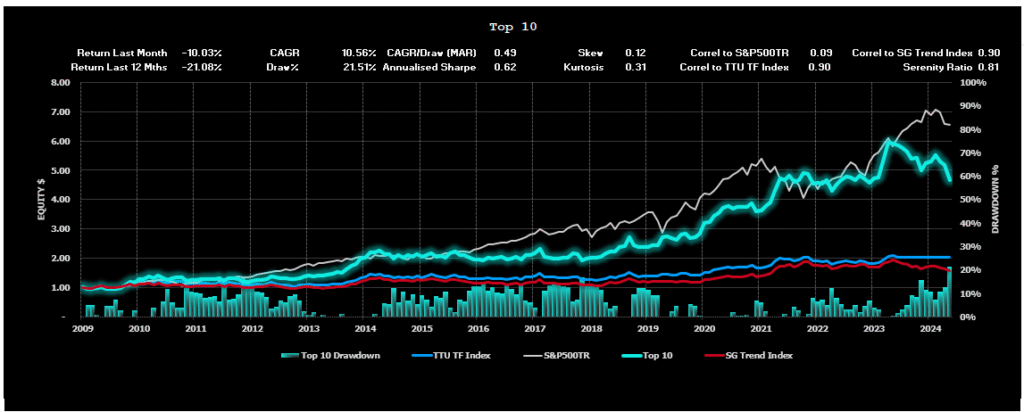
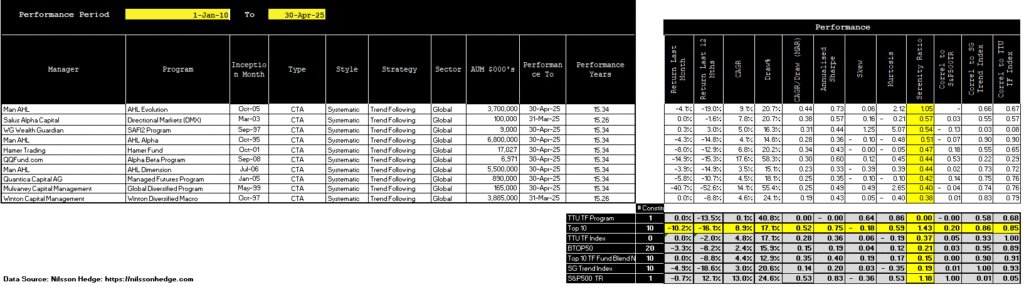
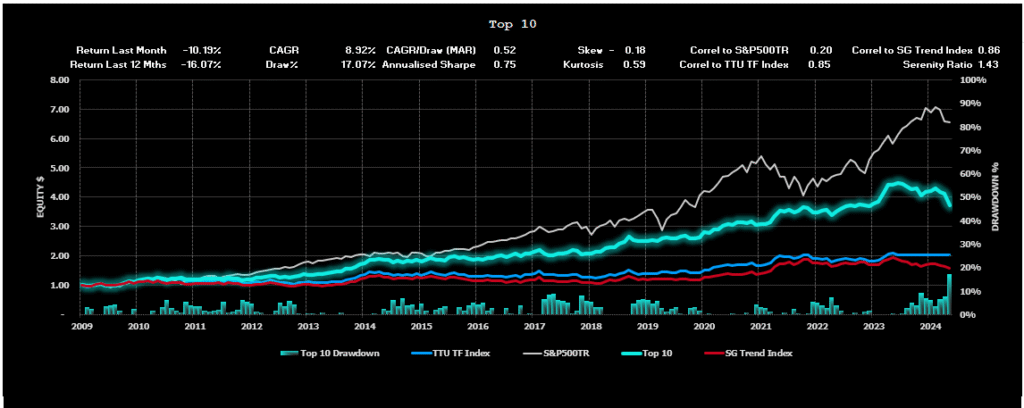
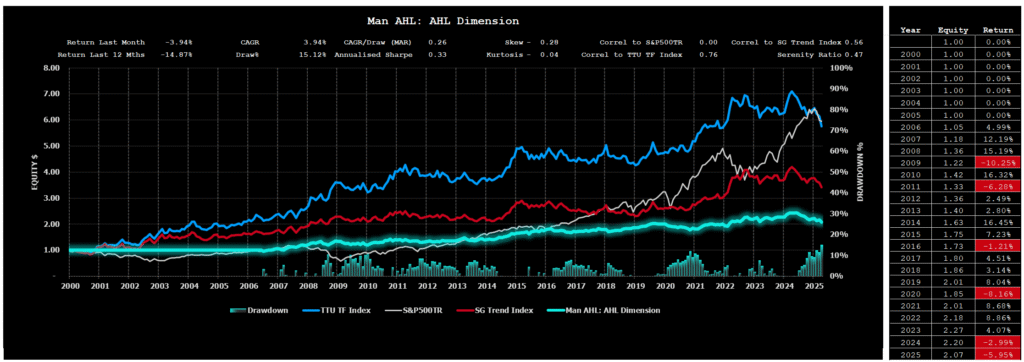
SG Trend Index Performance
- MTD (as of May 29): -2.06%
- YTD: -11.19%
- (Last week MTD: -2.56% | YTD: -11.65%)
The SG Trend Index ticked slightly higher, easing its drawdown from last week’s deeper low. But it remains firmly in the red, weighed down by recent sector reversals. Systematic trend followers are still facing headwinds, though the violence of recent weeks has moderated.
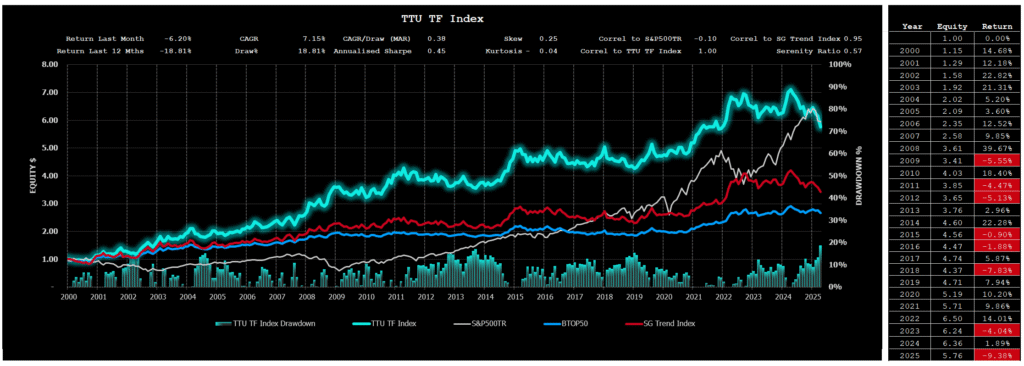
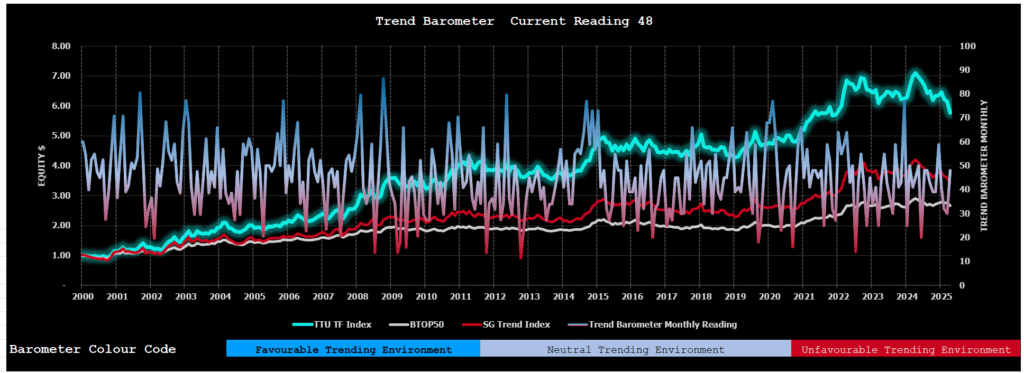
TTU Trend Barometer: 43% – Neutral
- Last week: 34%
- 10-day rate-of-change: Rising Moderately
The TTU Trend Barometer staged a late-week resurgence, finishing at 43%—a shift back into neutral territory. It’s not a trend breakout, but it’s no longer a freeze. Systems may be sensing the first stirrings of structure beneath the noise.
“Below 40% is cold. At 43%? The thaw has started.”

The Top Traders Unplugged (TTU) Trend Barometer is a proprietary tool that measures the percentage of markets with medium to strong trends. Similar to a thermometer, where 0 degrees Celsius equates to freezing, a TTU Trend Barometer reading below 40% indicates a “cold” environment for trend-following, while readings above 55% signal a “hotter,” more favourable trend environment.
Weekly Asset Class Snapshot

Source: Finwiz.com
Volatility collapsed. Equities climbed. Meats and bonds moved mildly higher. But most asset classes—energy, metals, softs, grains—faltered again. A low-energy week overall, with only equities offering a flicker of momentum.
Asset Class Breakdown – Cooling After the Storm
- Energy: -2.98% (Prev: -0.62%)
Crude, gas, and heating oil slid—reversing last week’s breakouts. - Metals: -2.62% (Prev: +5.88%)
A sharp correction after last week’s surge. Gold, silver, and platinum all pulled back. - Equities: +1.56% (Prev: -2.39%)
Modest recovery across indices. Tech bounced, while broader names held. - Soft Commodities: -0.74% (Prev: -0.08%)
Continued fade in coffee, sugar, and cotton. Cocoa remains unstable. - Grains: -0.51% (Prev: +2.23%)
Corn and wheat resumed their decline. Trend signals weakening. - Meats: +0.72% (Prev: +0.40%)
Lean hogs and live cattle found traction. Quiet but consistent. - Bonds: +0.64% (Prev: -0.47%)
A small bounce in fixed income as yields eased. - Currencies: -0.42% (Prev: +1.42%)
USD strength returned. FX drifted back into indecision. - Volatility Index: -8.81% (Prev: +13.55%)
Volatility snapped back. Calm returned—but not confidence.
Performance Highlights – This Week’s Market Leaders & Laggards

Top Market Movers
Biggest Gainers
- Oats: +6.62% – A surprise outlier in a quiet grain market—though still trading within range.
- Orange Juice: +4.59% – Still climbing this week off a low base following a significant slump, resisting the broader softs downtrend.
- Lean Hogs: +3.25% – Quiet breakout—early signs of a potential sustained move.
- Rough Rice / Nikkei 225 / Nasdaq 100 – Tech and Asia led equity strength
Biggest Losers
- Natural Gas: -8.81% – Heavy downside reversal
- Coffee: -5.21% / Soybean Oil: -4.96% / Corn: -3.48% – Softs and grains weakened
- Heating Oil, Platinum, Gold – Gave back recent momentum
Portfolio View – What the Moves Meant for Systems
- Energy & Metals: Reversals dominated. Last week’s strength became this week’s losses.
- Grains & Softs: Bearish continuation. Long signals remain underwater.
- Equities: A modest bright spot. Some systems may have caught the bounce.
- Meats: Quietly supportive. A rare zone of trend persistence.
- Volatility: Major retreat. Risk metrics re-stabilized—but signals remain unclear.
- Currencies & Bonds: Mixed. Limited follow-through in either direction.
Final Reflections – A Glimmer Beyond the Fog
This wasn’t a violent week. But it wasn’t a clear one either.
Trend followers are navigating a muted, two-faced environment: Volatility falls, yet conviction is absent. Equities rise, even as energy declines. Oats surge, while most commodities stall.
The SG Trend Index is less negative. And the TTU Trend Barometer has climbed back toward neutral. It’s not a breakout—but it might be the first hint of structure emerging from drift.
In this environment, it’s not about chasing fire—it’s about staying lit.
Because in these markets, trends don’t disappear. They just wait for silence to speak.
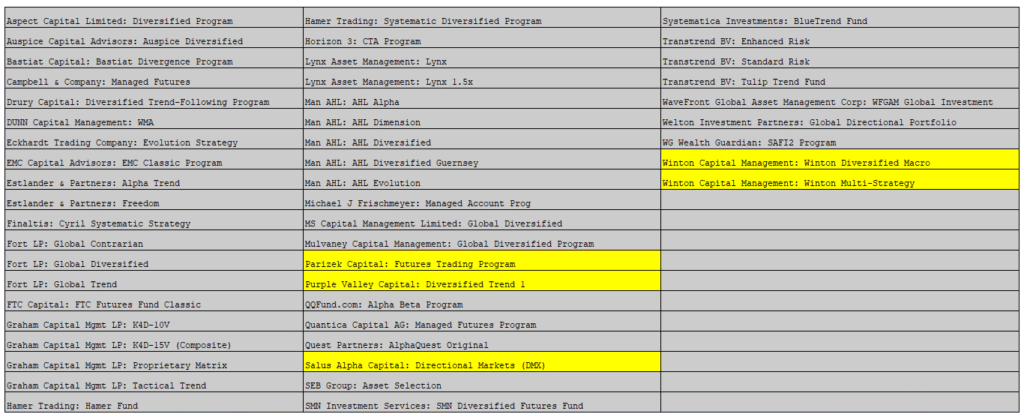
List of Resources used in the Week in Review
Important Disclaimers
This document is directly solely to Accredited Investors, Qualified Eligible Participants, Qualified Clients and Qualified Purchasers. No investment decision should be made until prospective investors have read the detailed information in the fund offering documents of any manager mentioned in this document. This document is furnished on a confidential basis only for the use of the recipient and only for discussion purposes and is subject to amendment This document is neither advice nor a recommendation to enter into any transaction. This document is not an offer to buy or sell, nor a solicitation of an offer to buy or sell, any security or other financial instrument. This presentation is based on information obtained from sources that TopTradersUnplugged (“TTU”) (“considers to be reliable however, TTU makes no representation as to, and accepts no responsibility or liability for, the accuracy or completeness of the information. TTU has not independently verified third party manager or benchmark information, does not represent it as accurate, true or complete, makes no warranty, express or implied regarding it and shall not be liable for any losses, damages, costs or expenses relating to its adequacy, accuracy, truth, completeness or use.
All projections, valuations, and statistical analyses are provided to assist the recipient in the evaluation of the matters described herein. Such projections, valuations and analyses may be based on subjective assessments and assumptions and may use one among many alternative methodologies that produce different results accordingly, such projections, valuations and statistical analyses should not be viewed as facts and should not be relied upon as an accurate prediction of future events. There is no guarantee that any targeted performance will be achieved Commodity trading involves substantial risk of loss and may not be suitable for everyone
TTU is not and does not purport to be an advisor as to legal, taxation, accounting, financial or regulatory matters in any jurisdiction. The recipient should independently evaluate and judge the matters referred to herein. TTU does not provide advice or recommendations regarding an investor’s decision to allocate to funds or accounts managed by any manager (“or to maintain or sell investments in funds or accounts managed by any manager, and no fiduciary relationship under ERISA is created by the investor investing in funds or accounts managed by any manager, or through any communication between TTU and the investor
In reviewing this document, it should be understood that the past performance results of any asset class, or any investment or trading program set forth herein, are not necessarily indicative of any future results that may be achieved in connection with any transaction. Any persons subscribing for an investment must be able to bear the risks involved and must meet the suitability requirements relating to such investment. Some or all alternative investment programs discussed herein may not be suitable for certain investors This document is directed only to persons having professional experience in matters relating to investments. Any investment or investment activity to which this document relates is available only to such investment professionals. Persons who do not have professional experience in matters relating to investments should not rely upon this document.
This document and its contents are proprietary information of TTU and may not be reproduced or otherwise disseminated in whole or in part without TTU’s prior written consent.
This document contains simulated or hypothetical performance results that have certain inherent limitations AND SHOULD BE VIEWED FOR ILLUSTRATIVE PURPOSES. Unlike the results shown in an actual performance record, these results do not represent actual trading. HYPOTHETICAL PERFORMANCE RESULTS HAVE MANY INHERENT LIMITATIONS, SOME OF WHICH ARE DESCRIBED BELOW. NO REPRESENTATION IS BEING MADE THAT ANY ACCOUNT WILL OR IS LIKELY TO ACHIEVE PROFITS OR LOSSES SIMILAR TO THOSE SHOWN IN FACT, THERE ARE FREQUENTLY SHARP DIFFERENCES BETWEEN HYPOTHETICAL PERFORMANCE RESULTS AND THE ACTUAL RESULTS SUBSEQUENTLY ACHIEVED BY ANY PARTICULAR INVESTMENT ACCOUNT.
ONE OF THE LIMITATIONS OF HYPOTHETICAL PERFORMANCE RESULTS IS THAT THEY ARE GENERALLY PREPARED WITH THE BENEFIT OF HINDSIGHT IN ADDITION, HYPOTHETICAL TRADING DOES NOT INVOLVE FINANCIAL RISK, AND NO HYPOTHETICAL TRADING RECORD CAN COMPLETELY ACCOUNT FOR THE IMPACT OF FINANCIAL RISK IN ACTUAL TRADING FOR EXAMPLE, THE ABILITY TO WITHSTAND LOSSES OR TO ADHERE TO A PARTICULAR TRADING PROGRAM OR OTHER ASSET.
There are numerous other factors related to the markets in general or to the implementation of any specific trading program which cannot be fully accounted for in the preparation of hypothetical performance results and all of which can adversely affect actual trading results. No representation is being made that any investment will or is likely to achieve profits or losses similar to those being shown.